San Vicente Airbnb Market Analysis 2026: Short Term Rental Data & Vacation Rental Statistics in San Jose Province, Costa Rica
Is Airbnb profitable in San Vicente in 2026? Explore comprehensive Airbnb analytics for San Vicente, San Jose Province, Costa Rica to uncover income potential. This 2026 STR market report for San Vicente, based on AirROI data from February 2025 to January 2026, reveals key trends in the niche market of 20 active listings.
Whether you're considering an Airbnb investment in San Vicente, optimizing your existing vacation rental, or exploring rental arbitrage opportunities, understanding the San Vicente Airbnb data is crucial. Leveraging the low regulation environment is key to maximizing your short term rental income potential. Let's dive into the specifics.
Key San Vicente Airbnb Performance Metrics Overview
Monthly Airbnb Revenue Variations & Income Potential in San Vicente (2026)
Understanding the monthly revenue variations for Airbnb listings in San Vicente is key to maximizing your short term rental income potential. Seasonality significantly impacts earnings. Our analysis, based on data from the past 12 months, shows that the peak revenue month for STRs in San Vicente is typically February, while September often presents the lowest earnings, highlighting opportunities for strategic pricing adjustments during shoulder and low seasons. Explore the typical Airbnb income in San Vicente across different performance tiers:
- Best-in-class properties (Top 10%) achieve $1,436+ monthly, often utilizing dynamic pricing and superior guest experiences.
- Strong performing properties (Top 25%) earn $943 or more, indicating effective management and desirable locations/amenities.
- Typical properties (Median) generate around $491 per month, representing the average market performance.
- Entry-level properties (Bottom 25%) see earnings around $238, often with potential for optimization.
Average Monthly Airbnb Earnings Trend in San Vicente
San Vicente Airbnb Occupancy Rate Trends (2026)
Maximize your bookings by understanding the San Vicente STR occupancy trends. Seasonal demand shifts significantly influence how often properties are booked. Typically, Februarysees the highest demand (peak season occupancy), while September experiences the lowest (low season). Effective strategies, like adjusting minimum stays or offering promotions, can boost occupancy during slower periods. Here's how different property tiers perform in San Vicente:
- Best-in-class properties (Top 10%) achieve 81%+ occupancy, indicating high desirability and potentially optimized availability.
- Strong performing properties (Top 25%) maintain 64% or higher occupancy, suggesting good market fit and guest satisfaction.
- Typical properties (Median) have an occupancy rate around 38%.
- Entry-level properties (Bottom 25%) average 15% occupancy, potentially facing higher vacancy.
Average Monthly Occupancy Rate Trend in San Vicente
Average Daily Rate (ADR) Airbnb Trends in San Vicente (2026)
Effective short term rental pricing strategy in San Vicente involves understanding monthly ADR fluctuations. The Average Daily Rate (ADR) for Airbnb in San Vicente typically peaks in September and dips lowest during February. Leveraging Airbnb dynamic pricing tools or strategies based on this seasonality can significantly boost revenue. Here's a look at the typical nightly rates achieved:
- Best-in-class properties (Top 10%) command rates of $97+ per night, often due to premium features or locations.
- Strong performing properties (Top 25%) achieve nightly rates of $59 or more.
- Typical properties (Median) charge around $41 per night.
- Entry-level properties (Bottom 25%) earn around $30 per night.
Average Daily Rate (ADR) Trend by Month in San Vicente
Get Live San Vicente Market Intelligence 👇

Explore Real-time Analytics
Airbnb Seasonality Analysis & Trends in San Vicente (2026)
Peak Season (February, November, December)
- Revenue averages $864 per month
- Occupancy rates average 53.9%
- Daily rates average $63
Shoulder Season
- Revenue averages $699 per month
- Occupancy maintains around 44.7%
- Daily rates hold near $60
Low Season (January, May, September)
- Revenue drops to average $383 per month
- Occupancy decreases to average 23.0%
- Daily rates adjust to average $64
Seasonality Insights for San Vicente
- The Airbnb seasonality in San Vicente shows highly seasonal trends requiring careful strategy. While the sections above show seasonal averages, it's also insightful to look at the extremes:
- During the high season, the absolute peak month showcases San Vicente's highest earning potential, with monthly revenues capable of climbing to $910, occupancy reaching a high of 58.5%, and ADRs peaking at $66.
- Conversely, the slowest single month of the year, typically falling within the low season, marks the market's lowest point. In this month, revenue might dip to $226, occupancy could drop to 15.6%, and ADRs may adjust down to $59.
- Understanding both the seasonal averages and these monthly peaks and troughs in revenue, occupancy, and ADR is crucial for maximizing your Airbnb profit potential in San Vicente.
Seasonal Strategies for Maximizing Profit
- Peak Season: Maximize revenue through premium pricing and potentially longer minimum stays. Ensure high availability.
- Low Season: Offer competitive pricing, special promotions (e.g., extended stay discounts), and flexible cancellation policies. Target off-season travelers like remote workers or budget-conscious guests.
- Shoulder Seasons: Implement dynamic pricing that balances peak and low rates. Target weekend travelers or specific events. Offer slightly more flexible terms than peak season.
- Regularly analyze your own performance against these San Vicente seasonality benchmarks and adjust your pricing and availability strategy accordingly.
Best Areas for Airbnb Investment in San Vicente (2026)
Exploring the top neighborhoods for short-term rentals in San Vicente? This section highlights key areas, outlining why they are attractive for hosts and guests, along with notable local attractions. Consider these locations based on your target guest profile and investment strategy.
| Neighborhood / Area | Why Host Here? (Target Guests & Appeal) | Key Attractions & Landmarks |
|---|---|---|
| Playa San Vicente | A beautiful beach area known for its stunning coastline and tranquil atmosphere. It attracts both tourists and locals seeking a relaxing getaway by the ocean, making it ideal for vacation rentals. | Playa San Vicente Beach, Surfing and water sports, Local seafood restaurants, Scenic coastal views, Nature walks |
| San Vicente Town Center | The heart of San Vicente with local shops and eateries. It's convenient for travelers looking for a more local experience while being close to beach access. | Local markets, Cultural events, Community festivals, Charming cafes, Artisan shops |
| Playa Coyote | An idyllic beach known for its pristine waters and less tourist traffic. Perfect for nature lovers and those seeking tranquility, making it a hidden gem for Airbnb hosting. | Beautiful sunsets, Wildlife viewing, Fishing opportunities, Beach activities, Secluded spots |
| Cerro de La Muerte | A high-altitude area offering stunning views of the mountains and valleys. Ideal for hikers and nature enthusiasts, featuring unique flora and fauna. | Hiking trails, Nature reserves, Bird watching, Stargazing, Scenic viewpoints |
| Santa Teresa | A vibrant surf destination attracting both local and international tourists. Known for its surfing culture and bohemian lifestyle, it has a strong demand for vacation rentals. | Surfing, Yoga retreats, Beach parties, Eco-friendly lifestyle, Art galleries and shops |
| Monteverde | A world-renowned cloud forest destination, popular for eco-tourism and nature lovers. It offers unique experiences such as canopy tours and wildlife watching. | Monteverde Cloud Forest Reserve, Canopy zip-lining, Bird watching tours, Hiking trails, Eco-lodges |
| Nosara | Known for its serene beaches and wellness retreats, Nosara attracts visitors looking for both adventure and relaxation, creating strong demand for Airbnb accommodations. | Yoga retreats, Surfing, Nature reserves, Healthy restaurants, Beautiful beaches |
| Arenal Volcano | An iconic destination in Costa Rica, famous for its stunning volcano and hot springs. This area attracts tourists year-round, making it a prime location for hosting | Arenal Volcano National Park, Hot springs, Adventure activities, Scenic hiking trails, Wildlife encounters |
Understanding Airbnb License Requirements & STR Laws in San Vicente (2026)
While San Vicente, San Jose Province, Costa Rica currently shows low STR regulations, specific Airbnb license requirements might still exist or change. Always verify the latest short term rental regulations and Airbnb license requirements directly with local government authorities for San Vicente to ensure full compliance before hosting.
(Source: AirROI data, 2026, finding no licensed listings among those analyzed)
Top Performing Airbnb Properties in San Vicente (2026)
Benchmark your potential! Explore examples of top-performing Airbnb properties in San Vicentebased on Trailing Twelve Month (TTM) revenue. Analyze their characteristics, revenue, occupancy rate, and ADR to understand what drives success in this market.
Feel yourself at home
Entire Place • 2 bedrooms

Vista Moravia Container EcoFarm
Entire Place • 1 bedroom

Cozzy & secure home for extended stays Costa Rica
Entire Place • 3 bedrooms

Casa Musa, Moravia downtown.
Entire Place • 1 bedroom
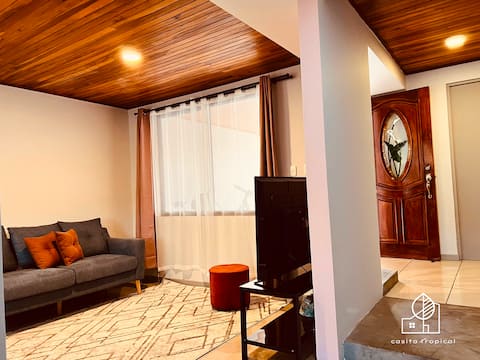
Casita Tropical Moravia, San Jose
Entire Place • 2 bedrooms
Quiet and safe full apartment in a condominium
Entire Place • 2 bedrooms
Note: Performance varies based on location, size, amenities, seasonality, and management quality. Data reflects the past 12 months.
Top Performing Airbnb Hosts in San Vicente (2026)
Learn from the best! This table showcases top-performing Airbnb hosts in San Vicente based on the number of properties managed and estimated total revenue over the past year. Analyze their scale and performance metrics.
| Host Name | Properties | Grossing Revenue | Stay Reviews | Avg Rating |
|---|---|---|---|---|
| Andrea | 1 | $17,116 | 53 | 4.94/5.0 |
| Henry | 1 | $9,836 | 5 | 4.80/5.0 |
| Joseph Madison | 1 | $8,847 | 13 | 5.00/5.0 |
| Carlos Alberto | 1 | $6,913 | 74 | 4.88/5.0 |
| DevOp | 4 | $6,443 | 30 | 4.72/5.0 |
| Daniel | 1 | $4,715 | 39 | 4.95/5.0 |
| Ronald | 1 | $4,648 | 56 | 4.66/5.0 |
| Andrés | 1 | $3,627 | 3 | 5.00/5.0 |
| Suleyka | 1 | $3,288 | 17 | 4.65/5.0 |
| Byron | 1 | $3,038 | 23 | 4.87/5.0 |
Analyzing the strategies of top hosts, such as their property selection, pricing, and guest communication, can offer valuable lessons for optimizing your own Airbnb operations in San Vicente.
Dive Deeper: Advanced San Vicente STR Market Data (2026)
Ready to unlock more insights? AirROI provides access to advanced metrics and comprehensive Airbnb data for San Vicente. Explore detailed analytics beyond this report to refine your investment strategy, optimize pricing, and maximize your vacation rental profits.
Explore Advanced MetricsSan Vicente Short-Term Rental Market Composition (2026): Property & Room Types
Room Type Distribution
Property Type Distribution
Market Composition Insights for San Vicente
- The San Vicente Airbnb market composition is heavily skewed towards Entire Home/Apt listings, which make up 60% of the 20 active rentals. This indicates strong guest preference for privacy and space.
- However, a notable 40% share for Private Rooms suggests opportunities for budget-conscious travelers or hosts renting out spare rooms.
- Looking at the property type distribution in San Vicente, House properties are the most common (50%), reflecting the local real estate landscape.
- Houses represent a significant 50% portion, catering likely to families or larger groups.
San Vicente Airbnb Room Capacity Analysis (2026): Bedroom Distribution
Distribution of Listings by Number of Bedrooms
Room Capacity Insights for San Vicente
- The dominant room capacity in San Vicente is 2 bedrooms listings, making up 40% of the market. This suggests a strong demand for properties suitable for couples or solo travelers.
- Together, 2 bedrooms and 3 bedrooms properties represent 55.0% of the active Airbnb listings in San Vicente, indicating a high concentration in these sizes.
San Vicente Vacation Rental Guest Capacity Trends (2026)
Distribution of Listings by Guest Capacity
Guest Capacity Insights for San Vicente
- The most common guest capacity trend in San Vicente vacation rentals is listings accommodating 4 guests (15%). This suggests the primary traveler segment is likely small families or groups.
- Properties designed for 4 guests and 3 guests dominate the San Vicente STR market, accounting for 30.0% of listings.
- On average, properties in San Vicente are equipped to host 2.4 guests.
San Vicente Airbnb Booking Patterns (2026): Available vs. Booked Days
Available Days Distribution
Booked Days Distribution
Booking Pattern Insights for San Vicente
- The most common availability pattern in San Vicente falls within the 271-366 days range, representing 70% of listings. This suggests many properties have significant open periods on their calendars.
- Approximately 95.0% of listings show high availability (181+ days open annually), indicating potential for increased bookings or specific owner usage patterns.
- For booked days, the 1-30 days range is most frequent in San Vicente (40%), reflecting common guest stay durations or potential owner blocking patterns.
- A notable 5.0% of properties secure long booking periods (181+ days booked per year), highlighting successful long-term rental strategies or significant owner usage.
San Vicente Airbnb Minimum Stay Requirements Analysis
Distribution of Listings by Minimum Night Requirement
1 Night
10 listings
50% of total
2 Nights
3 listings
15% of total
3 Nights
1 listings
5% of total
4-6 Nights
2 listings
10% of total
7-29 Nights
1 listings
5% of total
30+ Nights
3 listings
15% of total
Key Insights
- The most prevalent minimum stay requirement in San Vicente is 1 Night, adopted by 50% of listings. This highlights the market's preference for shorter, flexible bookings.
- A strong majority (65.0%) of the San Vicente Airbnb data shows acceptance of very short stays (1-2 nights), indicating a dynamic, high-turnover market.
- A significant segment (15%) caters to monthly stays (30+ nights) in San Vicente, pointing to opportunities in the extended-stay market.
Recommendations
- Align with the market by considering a 1 Night minimum stay, as 50% of San Vicente hosts use this setting.
- Explore offering discounts for stays of 30+ nights to attract the 15% of the market seeking extended stays.
- Adjust minimum nights based on seasonality – potentially shorter during low season and longer during peak demand periods in San Vicente.
San Vicente Airbnb Cancellation Policy Trends Analysis (2026)
Flexible
7 listings
35% of total
Moderate
12 listings
60% of total
Strict
1 listings
5% of total
Cancellation Policy Insights for San Vicente
- The prevailing Airbnb cancellation policy trend in San Vicente is Moderate, used by 60% of listings.
- The market strongly favors guest-friendly terms, with 95.0% of listings offering Flexible or Moderate policies. This suggests guests in San Vicente may expect booking flexibility.
- Strict cancellation policies are quite rare (5%), potentially making listings with this policy less competitive unless justified by high demand or property type.
Recommendations for Hosts
- Consider adopting a Moderate policy to align with the 60% market standard in San Vicente.
- Using a Strict policy might deter some guests, as only 5% of listings use it. Evaluate if potential revenue protection outweighs possible lower booking rates.
- Regularly review your cancellation policy against competitors and market demand shifts in San Vicente.
San Vicente STR Booking Lead Time Analysis (2026)
Average Booking Lead Time by Month
Booking Lead Time Insights for San Vicente
- The overall average booking lead time for vacation rentals in San Vicente is 38 days.
- Guests book furthest in advance for stays during November (average 46 days), likely coinciding with peak travel demand or local events.
- The shortest booking windows occur for stays in August (average 9 days), indicating more last-minute travel plans during this time.
- Seasonally, Fall (30 days avg.) sees the longest lead times, while Summer (18 days avg.) has the shortest, reflecting typical travel planning cycles.
Recommendations for Hosts
- Use the overall average lead time (38 days) as a baseline for your pricing and availability strategy in San Vicente.
- During August, focus on last-minute booking availability and promotions, as guests book with very short notice (9 days avg.).
- Target marketing efforts for the Fall season well in advance (at least 30 days) to capture early planners.
- Monitor your own booking lead times against these San Vicente averages to identify opportunities for dynamic pricing adjustments.
Popular & Essential Airbnb Amenities in San Vicente (2026)
Amenity Prevalence
Amenity Insights for San Vicente
- Essential amenities in San Vicente that guests expect include: Wifi, Kitchen. Lacking these (any) could significantly impact bookings.
- Popular amenities like Washer, Refrigerator, TV are common but not universal. Offering these can provide a competitive edge.
Recommendations for Hosts
- Ensure your listing includes all essential amenities for San Vicente: Wifi, Kitchen.
- Prioritize adding missing essentials: Kitchen.
- Consider adding popular differentiators like Washer or Refrigerator to increase appeal.
- Highlight unique or less common amenities you offer (e.g., hot tub, dedicated workspace, EV charger) in your listing description and photos.
- Regularly check competitor amenities in San Vicente to stay competitive.
San Vicente Airbnb Guest Demographics & Profile Analysis (2026)
Guest Profile Summary for San Vicente
- The typical guest profile for Airbnb in San Vicente consists of a mix of domestic (49%) and international guests, with top international origins including United States, typically belonging to the Post-2000s (Gen Z/Alpha) group (50%), primarily speaking English or Spanish.
- Domestic travelers account for 49.4% of guests.
- Key international markets include Costa Rica (49.4%) and United States (24.7%).
- Top languages spoken are English (45.2%) followed by Spanish (42.5%).
- A significant demographic segment is the Post-2000s (Gen Z/Alpha) group, representing 50% of guests.
Recommendations for Hosts
- Balance marketing efforts between domestic and international channels based on the guest mix.
- Tailor amenities and listing descriptions to appeal to the dominant Post-2000s (Gen Z/Alpha) demographic (e.g., highlight fast WiFi, smart home features, local guides).
- Highlight unique local experiences or amenities relevant to the primary guest profile.
- Consider seasonal promotions aligned with peak travel times for key origin markets.
Nearby Short-Term Rental Market Comparison
How does the San Vicente Airbnb market stack up against its neighbors? Compare key performance metrics like average monthly revenue, ADR, and occupancy rates in surrounding areas to understand the broader regional STR landscape.
| Market | Active Properties | Monthly Revenue | Daily Rate | Avg. Occupancy |
|---|---|---|---|---|
| Nacascolo | 32 | $6,132 | $1145.14 | 33% |
| Pinilla | 91 | $4,982 | $544.03 | 35% |
| Playa Tamarindo | 21 | $4,869 | $404.48 | 44% |
| Playa Langosta | 163 | $4,380 | $474.00 | 39% |
| Punta Islita | 27 | $4,193 | $518.64 | 36% |
| Tamarindo | 1,302 | $3,897 | $386.82 | 41% |
| Osa | 10 | $3,418 | $586.45 | 32% |
| Cabo Velas | 922 | $3,316 | $381.01 | 38% |
| Playa Grande | 33 | $3,195 | $397.35 | 40% |
| Nosara | 873 | $3,169 | $421.13 | 39% |