San Marcos Airbnb Market Analysis 2026: Short Term Rental Data & Vacation Rental Statistics in San Jose Province, Costa Rica
Is Airbnb profitable in San Marcos in 2026? Explore comprehensive Airbnb analytics for San Marcos, San Jose Province, Costa Rica to uncover income potential. This 2026 STR market report for San Marcos, based on AirROI data from February 2025 to January 2026, reveals key trends in the niche market of 25 active listings.
Whether you're considering an Airbnb investment in San Marcos, optimizing your existing vacation rental, or exploring rental arbitrage opportunities, understanding the San Marcos Airbnb data is crucial. Leveraging the low regulation environment is key to maximizing your short term rental income potential. Let's dive into the specifics.
Key San Marcos Airbnb Performance Metrics Overview
Monthly Airbnb Revenue Variations & Income Potential in San Marcos (2026)
Understanding the monthly revenue variations for Airbnb listings in San Marcos is key to maximizing your short term rental income potential. Seasonality significantly impacts earnings. Our analysis, based on data from the past 12 months, shows that the peak revenue month for STRs in San Marcos is typically December, while October often presents the lowest earnings, highlighting opportunities for strategic pricing adjustments during shoulder and low seasons. Explore the typical Airbnb income in San Marcos across different performance tiers:
- Best-in-class properties (Top 10%) achieve $1,952+ monthly, often utilizing dynamic pricing and superior guest experiences.
- Strong performing properties (Top 25%) earn $1,356 or more, indicating effective management and desirable locations/amenities.
- Typical properties (Median) generate around $718 per month, representing the average market performance.
- Entry-level properties (Bottom 25%) see earnings around $368, often with potential for optimization.
Average Monthly Airbnb Earnings Trend in San Marcos
San Marcos Airbnb Occupancy Rate Trends (2026)
Maximize your bookings by understanding the San Marcos STR occupancy trends. Seasonal demand shifts significantly influence how often properties are booked. Typically, Decembersees the highest demand (peak season occupancy), while October experiences the lowest (low season). Effective strategies, like adjusting minimum stays or offering promotions, can boost occupancy during slower periods. Here's how different property tiers perform in San Marcos:
- Best-in-class properties (Top 10%) achieve 57%+ occupancy, indicating high desirability and potentially optimized availability.
- Strong performing properties (Top 25%) maintain 41% or higher occupancy, suggesting good market fit and guest satisfaction.
- Typical properties (Median) have an occupancy rate around 21%.
- Entry-level properties (Bottom 25%) average 11% occupancy, potentially facing higher vacancy.
Average Monthly Occupancy Rate Trend in San Marcos
Average Daily Rate (ADR) Airbnb Trends in San Marcos (2026)
Effective short term rental pricing strategy in San Marcos involves understanding monthly ADR fluctuations. The Average Daily Rate (ADR) for Airbnb in San Marcos typically peaks in September and dips lowest during March. Leveraging Airbnb dynamic pricing tools or strategies based on this seasonality can significantly boost revenue. Here's a look at the typical nightly rates achieved:
- Best-in-class properties (Top 10%) command rates of $201+ per night, often due to premium features or locations.
- Strong performing properties (Top 25%) achieve nightly rates of $127 or more.
- Typical properties (Median) charge around $86 per night.
- Entry-level properties (Bottom 25%) earn around $62 per night.
Average Daily Rate (ADR) Trend by Month in San Marcos
Get Live San Marcos Market Intelligence 👇

Explore Real-time Analytics
Airbnb Seasonality Analysis & Trends in San Marcos (2026)
Peak Season (December, April, January)
- Revenue averages $1,204 per month
- Occupancy rates average 33.2%
- Daily rates average $116
Shoulder Season
- Revenue averages $922 per month
- Occupancy maintains around 26.3%
- Daily rates hold near $117
Low Season (February, September, October)
- Revenue drops to average $720 per month
- Occupancy decreases to average 23.7%
- Daily rates adjust to average $117
Seasonality Insights for San Marcos
- The Airbnb seasonality in San Marcos shows highly seasonal trends requiring careful strategy. While the sections above show seasonal averages, it's also insightful to look at the extremes:
- During the high season, the absolute peak month showcases San Marcos's highest earning potential, with monthly revenues capable of climbing to $1,516, occupancy reaching a high of 38.2%, and ADRs peaking at $125.
- Conversely, the slowest single month of the year, typically falling within the low season, marks the market's lowest point. In this month, revenue might dip to $673, occupancy could drop to 19.4%, and ADRs may adjust down to $110.
- Understanding both the seasonal averages and these monthly peaks and troughs in revenue, occupancy, and ADR is crucial for maximizing your Airbnb profit potential in San Marcos.
Seasonal Strategies for Maximizing Profit
- Peak Season: Maximize revenue through premium pricing and potentially longer minimum stays. Ensure high availability.
- Low Season: Offer competitive pricing, special promotions (e.g., extended stay discounts), and flexible cancellation policies. Target off-season travelers like remote workers or budget-conscious guests.
- Shoulder Seasons: Implement dynamic pricing that balances peak and low rates. Target weekend travelers or specific events. Offer slightly more flexible terms than peak season.
- Regularly analyze your own performance against these San Marcos seasonality benchmarks and adjust your pricing and availability strategy accordingly.
Best Areas for Airbnb Investment in San Marcos (2026)
Exploring the top neighborhoods for short-term rentals in San Marcos? This section highlights key areas, outlining why they are attractive for hosts and guests, along with notable local attractions. Consider these locations based on your target guest profile and investment strategy.
| Neighborhood / Area | Why Host Here? (Target Guests & Appeal) | Key Attractions & Landmarks |
|---|---|---|
| San Marcos Centro | The heart of San Marcos with easy access to shops, restaurants, and local culture. Ideal for visitors looking to experience the local lifestyle and community events. | Central Park, Local Markets, Community Festivals |
| La Palma | Known for its beautiful views and quiet atmosphere, La Palma attracts nature lovers and those looking to escape the hustle and bustle while still being close to local attractions. | La Palma Waterfall, Coffee Tours, Nature Trails |
| San Antonio | A tranquil area featuring lovely rural scenery and friendly locals, perfect for visitors interested in immersing themselves in a laid-back Costa Rican experience. | Rural Market, Artisan Shops, Natural Reserves |
| Pavones | Famous for its stunning beaches and surf culture, Pavones draws beachgoers and surfers from around the world, making it a hot spot for tourism. | Pavones Beach, Surfing Spots, Beachfront Cafes |
| San Luis | A vibrant community known for its agricultural activities and local farms, San Luis is perfect for tourists interested in sustainable tourism and farm-to-table dining experiences. | Coffee Plantations, Farm Tours, Organic Markets |
| Cerro de La Muerte | A serene mountainous region offering breathtaking views and cooler climate, appealing to eco-tourists and hikers looking for adventure and wildlife. | Hiking Trails, Bird Watching, Scenic Lookouts |
| Los Santos | Rich in culture and coffee production, Los Santos attracts tourists looking for authentic experiences in the heart of Costa Rica's coffee country. | Coffee Plantations, Local Cafes, Cultural Heritage Sites |
| El Jardín | A picturesque area filled with vibrant flowers and gardens, El Jardín is ideal for eco-tourists and travelers interested in biodiversity and nature walks. | Botanical Gardens, Nature Walks, Floral Exhibits |
Understanding Airbnb License Requirements & STR Laws in San Marcos (2026)
While San Marcos, San Jose Province, Costa Rica currently shows low STR regulations, specific Airbnb license requirements might still exist or change. Always verify the latest short term rental regulations and Airbnb license requirements directly with local government authorities for San Marcos to ensure full compliance before hosting.
(Source: AirROI data, 2026, based on 4% licensed listings)
Top Performing Airbnb Properties in San Marcos (2026)
Benchmark your potential! Explore examples of top-performing Airbnb properties in San Marcosbased on Trailing Twelve Month (TTM) revenue. Analyze their characteristics, revenue, occupancy rate, and ADR to understand what drives success in this market.

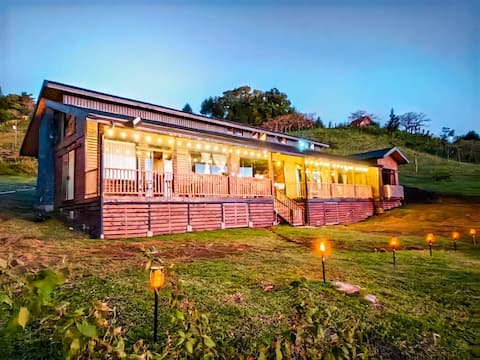
Dream cabin cr
Entire Place • 2 bedrooms

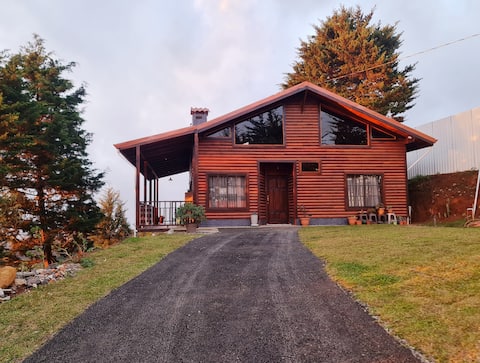
Quinta Los Santos - Los Tucanes Cabin
Entire Place • 5 bedrooms
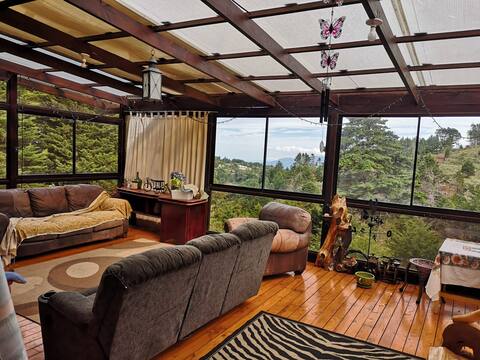
The Casona de Los Santos
Entire Place • 5 bedrooms
Casa Ámbar- Breathtaking Views Perfect for Hiking
Entire Place • 3 bedrooms
Zoella family cabin
Entire Place • 3 bedrooms

Los Encinos Forest Cabin
Entire Place • 3 bedrooms
Note: Performance varies based on location, size, amenities, seasonality, and management quality. Data reflects the past 12 months.
Top Performing Airbnb Hosts in San Marcos (2026)
Learn from the best! This table showcases top-performing Airbnb hosts in San Marcos based on the number of properties managed and estimated total revenue over the past year. Analyze their scale and performance metrics.
| Host Name | Properties | Grossing Revenue | Stay Reviews | Avg Rating |
|---|---|---|---|---|
| Doug | 3 | $36,964 | 87 | 4.85/5.0 |
| Carlos | 2 | $33,572 | 154 | 4.93/5.0 |
| Paula | 1 | $22,419 | 68 | 4.97/5.0 |
| Geovanny | 1 | $19,085 | 101 | 4.81/5.0 |
| David | 3 | $18,141 | 237 | 4.91/5.0 |
| Rosario | 1 | $14,791 | 175 | 4.82/5.0 |
| Patricia | 1 | $13,114 | 96 | 5.00/5.0 |
| Deibid | 1 | $11,715 | 49 | 4.98/5.0 |
| Laura | 1 | $10,836 | 66 | 4.97/5.0 |
| Edwin | 1 | $7,360 | 29 | 4.90/5.0 |
Analyzing the strategies of top hosts, such as their property selection, pricing, and guest communication, can offer valuable lessons for optimizing your own Airbnb operations in San Marcos.
Dive Deeper: Advanced San Marcos STR Market Data (2026)
Ready to unlock more insights? AirROI provides access to advanced metrics and comprehensive Airbnb data for San Marcos. Explore detailed analytics beyond this report to refine your investment strategy, optimize pricing, and maximize your vacation rental profits.
Explore Advanced MetricsSan Marcos Short-Term Rental Market Composition (2026): Property & Room Types
Room Type Distribution
Property Type Distribution
Market Composition Insights for San Marcos
- The San Marcos Airbnb market composition is heavily skewed towards Entire Home/Apt listings, which make up 100% of the 25 active rentals. This indicates strong guest preference for privacy and space.
- Looking at the property type distribution in San Marcos, Outdoor/Unique properties are the most common (76%), reflecting the local real estate landscape.
- Smaller segments like others, apartment/condo, hotel/boutique (combined 12.0%) offer potential for unique stay experiences.
San Marcos Airbnb Room Capacity Analysis (2026): Bedroom Distribution
Distribution of Listings by Number of Bedrooms
Room Capacity Insights for San Marcos
- The dominant room capacity in San Marcos is 2 bedrooms listings, making up 36% of the market. This suggests a strong demand for properties suitable for couples or solo travelers.
- Together, 2 bedrooms and 3 bedrooms properties represent 64.0% of the active Airbnb listings in San Marcos, indicating a high concentration in these sizes.
- A significant 40.0% of listings offer 3+ bedrooms, catering to larger groups and families seeking more space in San Marcos.
San Marcos Vacation Rental Guest Capacity Trends (2026)
Distribution of Listings by Guest Capacity
Guest Capacity Insights for San Marcos
- The most common guest capacity trend in San Marcos vacation rentals is listings accommodating 8+ guests (32%). This suggests the primary traveler segment is likely larger groups.
- Properties designed for 8+ guests and 4 guests dominate the San Marcos STR market, accounting for 56.0% of listings.
- 52.0% of properties accommodate 6+ guests, serving the market segment for larger families or group travel in San Marcos.
- On average, properties in San Marcos are equipped to host 5.6 guests.
San Marcos Airbnb Booking Patterns (2026): Available vs. Booked Days
Available Days Distribution
Booked Days Distribution
Booking Pattern Insights for San Marcos
- The most common availability pattern in San Marcos falls within the 271-366 days range, representing 72% of listings. This suggests many properties have significant open periods on their calendars.
- Approximately 92.0% of listings show high availability (181+ days open annually), indicating potential for increased bookings or specific owner usage patterns.
- For booked days, the 31-90 days range is most frequent in San Marcos (44%), reflecting common guest stay durations or potential owner blocking patterns.
- A notable 8.0% of properties secure long booking periods (181+ days booked per year), highlighting successful long-term rental strategies or significant owner usage.
San Marcos Airbnb Minimum Stay Requirements Analysis
Distribution of Listings by Minimum Night Requirement
1 Night
21 listings
84% of total
2 Nights
2 listings
8% of total
30+ Nights
2 listings
8% of total
Key Insights
- The most prevalent minimum stay requirement in San Marcos is 1 Night, adopted by 84% of listings. This highlights the market's preference for shorter, flexible bookings.
- A strong majority (92.0%) of the San Marcos Airbnb data shows acceptance of very short stays (1-2 nights), indicating a dynamic, high-turnover market.
Recommendations
- Align with the market by considering a 1 Night minimum stay, as 84% of San Marcos hosts use this setting.
- Explore offering discounts for stays of 30+ nights to attract the 8% of the market seeking extended stays.
- Adjust minimum nights based on seasonality – potentially shorter during low season and longer during peak demand periods in San Marcos.
San Marcos Airbnb Cancellation Policy Trends Analysis (2026)
Flexible
10 listings
40% of total
Moderate
7 listings
28% of total
Firm
4 listings
16% of total
Strict
4 listings
16% of total
Cancellation Policy Insights for San Marcos
- The prevailing Airbnb cancellation policy trend in San Marcos is Flexible, used by 40% of listings.
- There's a relatively balanced mix between guest-friendly (68.0%) and stricter (32.0%) policies, offering choices for different guest needs.
Recommendations for Hosts
- Consider adopting a Flexible policy to align with the 40% market standard in San Marcos.
- Regularly review your cancellation policy against competitors and market demand shifts in San Marcos.
San Marcos STR Booking Lead Time Analysis (2026)
Average Booking Lead Time by Month
Booking Lead Time Insights for San Marcos
- The overall average booking lead time for vacation rentals in San Marcos is 20 days.
- Guests book furthest in advance for stays during December (average 34 days), likely coinciding with peak travel demand or local events.
- The shortest booking windows occur for stays in July (average 13 days), indicating more last-minute travel plans during this time.
- Seasonally, Winter (23 days avg.) sees the longest lead times, while Summer (15 days avg.) has the shortest, reflecting typical travel planning cycles.
Recommendations for Hosts
- Use the overall average lead time (20 days) as a baseline for your pricing and availability strategy in San Marcos.
- For December stays, consider implementing length-of-stay discounts or slightly higher rates for bookings made less than 34 days out to capitalize on advance planning.
- Target marketing efforts for the Winter season well in advance (at least 23 days) to capture early planners.
- Monitor your own booking lead times against these San Marcos averages to identify opportunities for dynamic pricing adjustments.
Popular & Essential Airbnb Amenities in San Marcos (2026)
Amenity Prevalence
Amenity Insights for San Marcos
- Essential amenities in San Marcos that guests expect include: Wifi, TV. Lacking these (any) could significantly impact bookings.
- Popular amenities like Free parking on premises, Dishes and silverware, Coffee maker are common but not universal. Offering these can provide a competitive edge.
Recommendations for Hosts
- Ensure your listing includes all essential amenities for San Marcos: Wifi, TV.
- Prioritize adding missing essentials: TV.
- Consider adding popular differentiators like Free parking on premises or Dishes and silverware to increase appeal.
- Highlight unique or less common amenities you offer (e.g., hot tub, dedicated workspace, EV charger) in your listing description and photos.
- Regularly check competitor amenities in San Marcos to stay competitive.
San Marcos Airbnb Guest Demographics & Profile Analysis (2026)
Guest Profile Summary for San Marcos
- The typical guest profile for Airbnb in San Marcos consists of primarily domestic travelers (86%), often arriving from nearby San José, typically belonging to the Post-2000s (Gen Z/Alpha) group (50%), primarily speaking Spanish or English.
- Domestic travelers account for 85.7% of guests.
- Key international markets include Costa Rica (85.7%) and United States (6.3%).
- Top languages spoken are Spanish (45.3%) followed by English (42.5%).
- A significant demographic segment is the Post-2000s (Gen Z/Alpha) group, representing 50% of guests.
Recommendations for Hosts
- Target domestic marketing efforts towards travelers from San José and Heredia.
- Tailor amenities and listing descriptions to appeal to the dominant Post-2000s (Gen Z/Alpha) demographic (e.g., highlight fast WiFi, smart home features, local guides).
- Highlight unique local experiences or amenities relevant to the primary guest profile.
- Consider seasonal promotions aligned with peak travel times for key origin markets.
Nearby Short-Term Rental Market Comparison
How does the San Marcos Airbnb market stack up against its neighbors? Compare key performance metrics like average monthly revenue, ADR, and occupancy rates in surrounding areas to understand the broader regional STR landscape.
| Market | Active Properties | Monthly Revenue | Daily Rate | Avg. Occupancy |
|---|---|---|---|---|
| Osa | 10 | $3,418 | $586.45 | 32% |
| Savegre de Aguirre | 15 | $2,740 | $372.47 | 36% |
| Quepos | 1,172 | $2,594 | $246.50 | 39% |
| Cabeceras | 33 | $2,508 | $190.48 | 44% |
| Caldera | 36 | $2,490 | $270.58 | 33% |
| Venado | 10 | $2,404 | $200.90 | 41% |
| Jacó | 2,135 | $2,188 | $296.12 | 33% |
| Savegre | 186 | $2,150 | $256.31 | 34% |
| Bahía Ballena | 1,282 | $2,099 | $237.59 | 37% |
| Tárcoles | 294 | $1,978 | $253.51 | 30% |