Sabanilla Airbnb Market Analysis 2025: Short Term Rental Data & Vacation Rental Statistics in San Jose Province, Costa Rica
Is Airbnb profitable in Sabanilla in 2025? Explore comprehensive Airbnb analytics for Sabanilla, San Jose Province, Costa Rica to uncover income potential. This 2025 STR market report for Sabanilla, based on AirROI data from November 2024 to October 2025, reveals key trends in the niche market of 22 active listings.
Whether you're considering an Airbnb investment in Sabanilla, optimizing your existing vacation rental, or exploring rental arbitrage opportunities, understanding the Sabanilla Airbnb data is crucial. Leveraging the low regulation environment is key to maximizing your short term rental income potential. Let's dive into the specifics.
Key Sabanilla Airbnb Performance Metrics Overview
Monthly Airbnb Revenue Variations & Income Potential in Sabanilla (2025)
Understanding the monthly revenue variations for Airbnb listings in Sabanilla is key to maximizing your short term rental income potential. Seasonality significantly impacts earnings. Our analysis, based on data from the past 12 months, shows that the peak revenue month for STRs in Sabanilla is typically July, while November often presents the lowest earnings, highlighting opportunities for strategic pricing adjustments during shoulder and low seasons. Explore the typical Airbnb income in Sabanilla across different performance tiers:
- Best-in-class properties (Top 10%) achieve $1,554+ monthly, often utilizing dynamic pricing and superior guest experiences.
- Strong performing properties (Top 25%) earn $766 or more, indicating effective management and desirable locations/amenities.
- Typical properties (Median) generate around $431 per month, representing the average market performance.
- Entry-level properties (Bottom 25%) see earnings around $255, often with potential for optimization.
Average Monthly Airbnb Earnings Trend in Sabanilla
Sabanilla Airbnb Occupancy Rate Trends (2025)
Maximize your bookings by understanding the Sabanilla STR occupancy trends. Seasonal demand shifts significantly influence how often properties are booked. Typically, Julysees the highest demand (peak season occupancy), while October experiences the lowest (low season). Effective strategies, like adjusting minimum stays or offering promotions, can boost occupancy during slower periods. Here's how different property tiers perform in Sabanilla:
- Best-in-class properties (Top 10%) achieve 75%+ occupancy, indicating high desirability and potentially optimized availability.
- Strong performing properties (Top 25%) maintain 47% or higher occupancy, suggesting good market fit and guest satisfaction.
- Typical properties (Median) have an occupancy rate around 34%.
- Entry-level properties (Bottom 25%) average 21% occupancy, potentially facing higher vacancy.
Average Monthly Occupancy Rate Trend in Sabanilla
Average Daily Rate (ADR) Airbnb Trends in Sabanilla (2025)
Effective short term rental pricing strategy in Sabanilla involves understanding monthly ADR fluctuations. The Average Daily Rate (ADR) for Airbnb in Sabanilla typically peaks in July and dips lowest during March. Leveraging Airbnb dynamic pricing tools or strategies based on this seasonality can significantly boost revenue. Here's a look at the typical nightly rates achieved:
- Best-in-class properties (Top 10%) command rates of $92+ per night, often due to premium features or locations.
- Strong performing properties (Top 25%) achieve nightly rates of $55 or more.
- Typical properties (Median) charge around $42 per night.
- Entry-level properties (Bottom 25%) earn around $33 per night.
Average Daily Rate (ADR) Trend by Month in Sabanilla
Get Live Sabanilla Market Intelligence 👇

Explore Real-time Analytics
Airbnb Seasonality Analysis & Trends in Sabanilla (2025)
Peak Season (July, January, February)
- Revenue averages $1,019 per month
- Occupancy rates average 49.7%
- Daily rates average $60
Shoulder Season
- Revenue averages $660 per month
- Occupancy maintains around 36.5%
- Daily rates hold near $60
Low Season (May, October, November)
- Revenue drops to average $456 per month
- Occupancy decreases to average 28.2%
- Daily rates adjust to average $60
Seasonality Insights for Sabanilla
- The Airbnb seasonality in Sabanilla shows highly seasonal trends requiring careful strategy. While the sections above show seasonal averages, it's also insightful to look at the extremes:
- During the high season, the absolute peak month showcases Sabanilla's highest earning potential, with monthly revenues capable of climbing to $1,205, occupancy reaching a high of 59.5%, and ADRs peaking at $62.
- Conversely, the slowest single month of the year, typically falling within the low season, marks the market's lowest point. In this month, revenue might dip to $451, occupancy could drop to 23.6%, and ADRs may adjust down to $58.
- Understanding both the seasonal averages and these monthly peaks and troughs in revenue, occupancy, and ADR is crucial for maximizing your Airbnb profit potential in Sabanilla.
Seasonal Strategies for Maximizing Profit
- Peak Season: Maximize revenue through premium pricing and potentially longer minimum stays. Ensure high availability.
- Low Season: Offer competitive pricing, special promotions (e.g., extended stay discounts), and flexible cancellation policies. Target off-season travelers like remote workers or budget-conscious guests.
- Shoulder Seasons: Implement dynamic pricing that balances peak and low rates. Target weekend travelers or specific events. Offer slightly more flexible terms than peak season.
- Regularly analyze your own performance against these Sabanilla seasonality benchmarks and adjust your pricing and availability strategy accordingly.
Best Areas for Airbnb Investment in Sabanilla (2025)
Exploring the top neighborhoods for short-term rentals in Sabanilla? This section highlights key areas, outlining why they are attractive for hosts and guests, along with notable local attractions. Consider these locations based on your target guest profile and investment strategy.
| Neighborhood / Area | Why Host Here? (Target Guests & Appeal) | Key Attractions & Landmarks |
|---|---|---|
| Sabanilla Centro | Sabanilla Centro is a bustling area with easy access to San Jose's urban amenities. It's ideal for travelers looking to experience local culture while being close to the capital. | Parque Sabanilla, Catedral de San José, Museo Nacional de Costa Rica, Mercado Central, Instituto Costarricense de Turismo |
| San Pedro | A vibrant neighborhood popular among students and young adults thanks to its proximity to the university and nightlife. Great for attracting a younger crowd. | Universidad de Costa Rica, Parque La Sabana, Cerro Chirripó, Café de los Deseos, San Pedro Mall |
| Curridabat | A residential area with a growing expat community, offering a suburban feel with convenient access to shopping and dining. | Catedral de Curridabat, Plaza del Sol, Parque Bicentenario, Centro Comercial Los Faroles, Iglesia de San Sebastián |
| Cartago | Cartago is rich in history and culture, being one of the oldest cities in Costa Rica. It attracts tourists looking for historical experiences. | Basílica de Nuestra Señora de los Ángeles, Ruinas de la Parroquia de Santiago Apóstol, Jardín Botánico Lankester, Museo de Oro Precolombino |
| Escazú | A high-end neighborhood known for its luxurious homes and amenities. It's popular with affluent travelers looking for upscale experiences. | Cerro de la Cruz, Multiplaza Escazú, Plaza Itskazú, Casa de los Rojas |
| Alajuelita | This area offers a more local experience with beautiful views of the valley, catering to adventurous and cultural tourists. | Parque Nacional Chirripó, Mirador de La Paz, Iglesia de Alajuelita, Lagos de Costa Rica |
| Los Yoses | A trendy area that attracts young professionals and digital nomads with its cafes, co-working spaces, and vibrant community. | Parque Los Yoses, Galería de Arte, Café Rojo, Café La Mancha, Teatro de La Aduana |
| Desamparados | This area combines a local feel with tourist potential, accessing both nature and urban features. It is less touristy and more community-focused. | Parque de Desamparados, Iglesia de Desamparados, Laguna de Fraijanes, Cerro Rabo de Gato |
Understanding Airbnb License Requirements & STR Laws in Sabanilla (2025)
While Sabanilla, San Jose Province, Costa Rica currently shows low STR regulations, specific Airbnb license requirements might still exist or change. Always verify the latest short term rental regulations and Airbnb license requirements directly with local government authorities for Sabanilla to ensure full compliance before hosting.
(Source: AirROI data, 2025, finding no licensed listings among those analyzed)
Top Performing Airbnb Properties in Sabanilla (2025)
Benchmark your potential! Explore examples of top-performing Airbnb properties in Sabanillabased on Trailing Twelve Month (TTM) revenue. Analyze their characteristics, revenue, occupancy rate, and ADR to understand what drives success in this market.

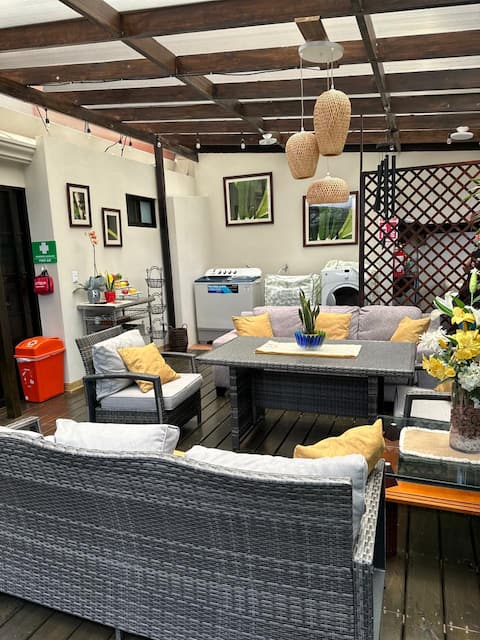
Large house in Sabanilla
Entire Place • 6 bedrooms
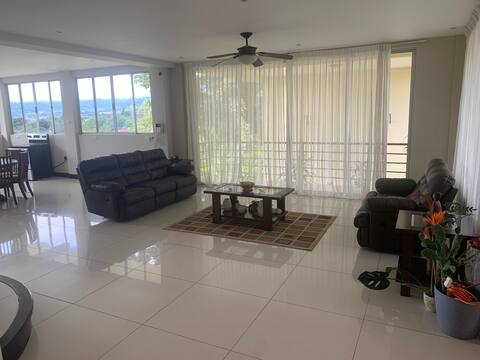
Harmony with Nature
Entire Place • 2 bedrooms

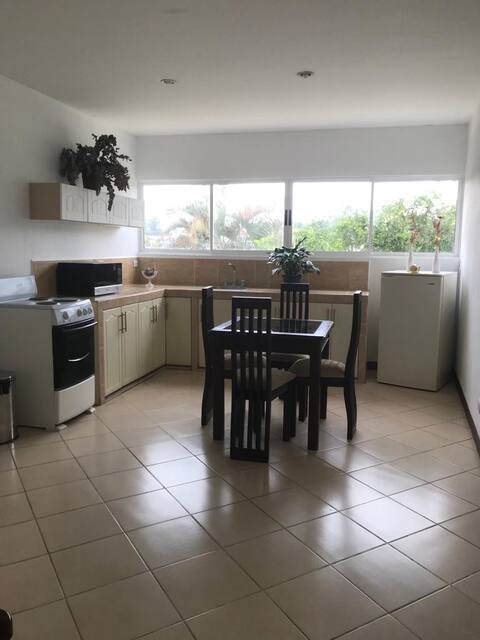
Safe and excellent location
Entire Place • 2 bedrooms
2 spacious rooms/Sabanilla
Private Room • 2 bedrooms

Colorful 2 bedroom home in great location
Entire Place • 2 bedrooms
Apartamento Tulin 3
Entire Place • 1 bedroom
Note: Performance varies based on location, size, amenities, seasonality, and management quality. Data reflects the past 12 months.
Top Performing Airbnb Hosts in Sabanilla (2025)
Learn from the best! This table showcases top-performing Airbnb hosts in Sabanilla based on the number of properties managed and estimated total revenue over the past year. Analyze their scale and performance metrics.
| Host Name | Properties | Grossing Revenue | Stay Reviews | Avg Rating |
|---|---|---|---|---|
| Jocelyne | 5 | $48,470 | 32 | 4.97/5.0 |
| Alberto | 2 | $9,220 | 206 | 4.75/5.0 |
| Ana Luisa | 1 | $8,458 | 50 | 4.92/5.0 |
| Fabiola | 1 | $8,412 | 7 | 5.00/5.0 |
| Pavlo | 2 | $7,750 | 345 | 4.92/5.0 |
| Marion | 1 | $6,182 | 17 | 5.00/5.0 |
| José Jacinto | 1 | $3,759 | 61 | 4.93/5.0 |
| Host #103340729 | 6 | $2,795 | 142 | 4.70/5.0 |
| Beto | 1 | $1,825 | 32 | 4.91/5.0 |
| David | 1 | $693 | 100 | 4.81/5.0 |
Analyzing the strategies of top hosts, such as their property selection, pricing, and guest communication, can offer valuable lessons for optimizing your own Airbnb operations in Sabanilla.
Dive Deeper: Advanced Sabanilla STR Market Data (2025)
Ready to unlock more insights? AirROI provides access to advanced metrics and comprehensive Airbnb data for Sabanilla. Explore detailed analytics beyond this report to refine your investment strategy, optimize pricing, and maximize your vacation rental profits.
Explore Advanced MetricsSabanilla Short-Term Rental Market Composition (2025): Property & Room Types
Room Type Distribution
Property Type Distribution
Market Composition Insights for Sabanilla
- The Sabanilla Airbnb market composition is heavily skewed towards Private Room listings, which make up 50% of the 22 active rentals. This indicates strong guest preference for privacy and space.
- Looking at the property type distribution in Sabanilla, Apartment/Condo properties are the most common (50%), reflecting the local real estate landscape.
- Houses represent a significant 45.5% portion, catering likely to families or larger groups.
- Smaller segments like hotel/boutique (combined 4.5%) offer potential for unique stay experiences.
Sabanilla Airbnb Room Capacity Analysis (2025): Bedroom Distribution
Distribution of Listings by Number of Bedrooms
Room Capacity Insights for Sabanilla
- The dominant room capacity in Sabanilla is 1 bedroom listings, making up 50% of the market. This suggests a strong demand for properties suitable for couples or solo travelers.
- Together, 1 bedroom and 2 bedrooms properties represent 77.3% of the active Airbnb listings in Sabanilla, indicating a high concentration in these sizes.
- Listings with 3+ bedrooms (9.1%) represent a smaller niche, potentially indicating an underserved market for larger group accommodations in Sabanilla.
Sabanilla Vacation Rental Guest Capacity Trends (2025)
Distribution of Listings by Guest Capacity
Guest Capacity Insights for Sabanilla
- The most common guest capacity trend in Sabanilla vacation rentals is listings accommodating 2 guests (50%). This suggests the primary traveler segment is likely couples or solo travelers.
- Properties designed for 2 guests and 4 guests dominate the Sabanilla STR market, accounting for 63.6% of listings.
- A significant 50.0% of listings cater specifically to 1-2 guests, highlighting strong demand from couples and solo travelers in Sabanilla.
- On average, properties in Sabanilla are equipped to host 2.6 guests.
Sabanilla Airbnb Booking Patterns (2025): Available vs. Booked Days
Available Days Distribution
Booked Days Distribution
Booking Pattern Insights for Sabanilla
- The most common availability pattern in Sabanilla falls within the 271-366 days range, representing 68.2% of listings. This suggests many properties have significant open periods on their calendars.
- Approximately 95.5% of listings show high availability (181+ days open annually), indicating potential for increased bookings or specific owner usage patterns.
- For booked days, the 91-180 days range is most frequent in Sabanilla (40.9%), reflecting common guest stay durations or potential owner blocking patterns.
- A notable 4.5% of properties secure long booking periods (181+ days booked per year), highlighting successful long-term rental strategies or significant owner usage.
Sabanilla Airbnb Minimum Stay Requirements Analysis
Distribution of Listings by Minimum Night Requirement
1 Night
10 listings
62.5% of total
2 Nights
2 listings
12.5% of total
3 Nights
2 listings
12.5% of total
30+ Nights
2 listings
12.5% of total
Key Insights
- The most prevalent minimum stay requirement in Sabanilla is 1 Night, adopted by 62.5% of listings. This highlights the market's preference for shorter, flexible bookings.
- A strong majority (75.0%) of the Sabanilla Airbnb data shows acceptance of very short stays (1-2 nights), indicating a dynamic, high-turnover market.
- A significant segment (12.5%) caters to monthly stays (30+ nights) in Sabanilla, pointing to opportunities in the extended-stay market.
Recommendations
- Align with the market by considering a 1 Night minimum stay, as 62.5% of Sabanilla hosts use this setting.
- Explore offering discounts for stays of 30+ nights to attract the 12.5% of the market seeking extended stays.
- Adjust minimum nights based on seasonality – potentially shorter during low season and longer during peak demand periods in Sabanilla.
Sabanilla Airbnb Cancellation Policy Trends Analysis (2025)
Flexible
12 listings
75% of total
Moderate
2 listings
12.5% of total
Firm
1 listings
6.3% of total
Strict
1 listings
6.3% of total
Cancellation Policy Insights for Sabanilla
- The prevailing Airbnb cancellation policy trend in Sabanilla is Flexible, used by 75% of listings.
- The market strongly favors guest-friendly terms, with 87.5% of listings offering Flexible or Moderate policies. This suggests guests in Sabanilla may expect booking flexibility.
- Strict cancellation policies are quite rare (6.3%), potentially making listings with this policy less competitive unless justified by high demand or property type.
Recommendations for Hosts
- Consider adopting a Flexible policy to align with the 75% market standard in Sabanilla.
- Given the high prevalence of Flexible policies (75%), offering this can enhance booking appeal, especially during shoulder seasons.
- Using a Strict policy might deter some guests, as only 6.3% of listings use it. Evaluate if potential revenue protection outweighs possible lower booking rates.
- Regularly review your cancellation policy against competitors and market demand shifts in Sabanilla.
Sabanilla STR Booking Lead Time Analysis (2025)
Average Booking Lead Time by Month
Booking Lead Time Insights for Sabanilla
- The overall average booking lead time for vacation rentals in Sabanilla is 45 days.
- Guests book furthest in advance for stays during November (average 50 days), likely coinciding with peak travel demand or local events.
- The shortest booking windows occur for stays in February (average 10 days), indicating more last-minute travel plans during this time.
- Seasonally, Fall (28 days avg.) sees the longest lead times, while Spring (14 days avg.) has the shortest, reflecting typical travel planning cycles.
Recommendations for Hosts
- Use the overall average lead time (45 days) as a baseline for your pricing and availability strategy in Sabanilla.
- During February, focus on last-minute booking availability and promotions, as guests book with very short notice (10 days avg.).
- Target marketing efforts for the Fall season well in advance (at least 28 days) to capture early planners.
- Monitor your own booking lead times against these Sabanilla averages to identify opportunities for dynamic pricing adjustments.
Popular & Essential Airbnb Amenities in Sabanilla (2025)
Amenity Prevalence
Amenity Insights for Sabanilla
- Essential amenities in Sabanilla that guests expect include: Wifi, TV, Kitchen. Lacking these (any) could significantly impact bookings.
- Popular amenities like Free parking on premises, Dishes and silverware, Refrigerator are common but not universal. Offering these can provide a competitive edge.
Recommendations for Hosts
- Ensure your listing includes all essential amenities for Sabanilla: Wifi, TV, Kitchen.
- Prioritize adding missing essentials: TV, Kitchen.
- Consider adding popular differentiators like Free parking on premises or Dishes and silverware to increase appeal.
- Highlight unique or less common amenities you offer (e.g., hot tub, dedicated workspace, EV charger) in your listing description and photos.
- Regularly check competitor amenities in Sabanilla to stay competitive.
Sabanilla Airbnb Guest Demographics & Profile Analysis (2025)
Guest Profile Summary for Sabanilla
- The typical guest profile for Airbnb in Sabanilla consists of a mix of domestic (58%) and international guests, often arriving from nearby San José, typically belonging to the Post-2000s (Gen Z/Alpha) group (50%), primarily speaking Spanish or English.
- Domestic travelers account for 58.3% of guests.
- Key international markets include Costa Rica (58.3%) and United States (18.1%).
- Top languages spoken are Spanish (48.9%) followed by English (40%).
- A significant demographic segment is the Post-2000s (Gen Z/Alpha) group, representing 50% of guests.
Recommendations for Hosts
- Balance marketing efforts between domestic and international channels based on the guest mix.
- Tailor amenities and listing descriptions to appeal to the dominant Post-2000s (Gen Z/Alpha) demographic (e.g., highlight fast WiFi, smart home features, local guides).
- Highlight unique local experiences or amenities relevant to the primary guest profile.
- Consider seasonal promotions aligned with peak travel times for key origin markets.
Nearby Short-Term Rental Market Comparison
How does the Sabanilla Airbnb market stack up against its neighbors? Compare key performance metrics like average monthly revenue, ADR, and occupancy rates in surrounding areas to understand the broader regional STR landscape.
| Market | Active Properties | Monthly Revenue | Daily Rate | Avg. Occupancy |
|---|---|---|---|---|
| Nacascolo | 32 | $7,159 | $1165.34 | 35% |
| Pinilla | 74 | $5,903 | $615.77 | 37% |
| Playa Tamarindo | 21 | $5,694 | $409.60 | 48% |
| Playa Langosta | 164 | $4,968 | $497.33 | 42% |
| Punta Islita | 28 | $4,963 | $551.73 | 37% |
| Tamarindo | 1,232 | $4,671 | $411.22 | 44% |
| Cabo Velas | 944 | $3,808 | $400.71 | 40% |
| Nosara | 864 | $3,759 | $433.44 | 42% |
| Tempate | 698 | $3,352 | $398.13 | 38% |
| Quepos | 1,125 | $2,927 | $258.22 | 41% |