Pozos Airbnb Market Analysis 2026: Short Term Rental Data & Vacation Rental Statistics in San Jose Province, Costa Rica
Is Airbnb profitable in Pozos in 2026? Explore comprehensive Airbnb analytics for Pozos, San Jose Province, Costa Rica to uncover income potential. This 2026 STR market report for Pozos, based on AirROI data from February 2025 to January 2026, reveals key trends in the niche market of 38 active listings.
Whether you're considering an Airbnb investment in Pozos, optimizing your existing vacation rental, or exploring rental arbitrage opportunities, understanding the Pozos Airbnb data is crucial. Leveraging the low regulation environment is key to maximizing your short term rental income potential. Let's dive into the specifics.
Key Pozos Airbnb Performance Metrics Overview
Monthly Airbnb Revenue Variations & Income Potential in Pozos (2026)
Understanding the monthly revenue variations for Airbnb listings in Pozos is key to maximizing your short term rental income potential. Seasonality significantly impacts earnings. Our analysis, based on data from the past 12 months, shows that the peak revenue month for STRs in Pozos is typically March, while January often presents the lowest earnings, highlighting opportunities for strategic pricing adjustments during shoulder and low seasons. Explore the typical Airbnb income in Pozos across different performance tiers:
- Best-in-class properties (Top 10%) achieve $1,942+ monthly, often utilizing dynamic pricing and superior guest experiences.
- Strong performing properties (Top 25%) earn $1,324 or more, indicating effective management and desirable locations/amenities.
- Typical properties (Median) generate around $710 per month, representing the average market performance.
- Entry-level properties (Bottom 25%) see earnings around $365, often with potential for optimization.
Average Monthly Airbnb Earnings Trend in Pozos
Pozos Airbnb Occupancy Rate Trends (2026)
Maximize your bookings by understanding the Pozos STR occupancy trends. Seasonal demand shifts significantly influence how often properties are booked. Typically, Marchsees the highest demand (peak season occupancy), while September experiences the lowest (low season). Effective strategies, like adjusting minimum stays or offering promotions, can boost occupancy during slower periods. Here's how different property tiers perform in Pozos:
- Best-in-class properties (Top 10%) achieve 80%+ occupancy, indicating high desirability and potentially optimized availability.
- Strong performing properties (Top 25%) maintain 62% or higher occupancy, suggesting good market fit and guest satisfaction.
- Typical properties (Median) have an occupancy rate around 33%.
- Entry-level properties (Bottom 25%) average 20% occupancy, potentially facing higher vacancy.
Average Monthly Occupancy Rate Trend in Pozos
Average Daily Rate (ADR) Airbnb Trends in Pozos (2026)
Effective short term rental pricing strategy in Pozos involves understanding monthly ADR fluctuations. The Average Daily Rate (ADR) for Airbnb in Pozos typically peaks in September and dips lowest during April. Leveraging Airbnb dynamic pricing tools or strategies based on this seasonality can significantly boost revenue. Here's a look at the typical nightly rates achieved:
- Best-in-class properties (Top 10%) command rates of $233+ per night, often due to premium features or locations.
- Strong performing properties (Top 25%) achieve nightly rates of $92 or more.
- Typical properties (Median) charge around $58 per night.
- Entry-level properties (Bottom 25%) earn around $40 per night.
Average Daily Rate (ADR) Trend by Month in Pozos
Get Live Pozos Market Intelligence 👇

Explore Real-time Analytics
Airbnb Seasonality Analysis & Trends in Pozos (2026)
Peak Season (March, February, April)
- Revenue averages $1,660 per month
- Occupancy rates average 45.9%
- Daily rates average $114
Shoulder Season
- Revenue averages $942 per month
- Occupancy maintains around 40.3%
- Daily rates hold near $119
Low Season (January, September, October)
- Revenue drops to average $704 per month
- Occupancy decreases to average 37.6%
- Daily rates adjust to average $130
Seasonality Insights for Pozos
- The Airbnb seasonality in Pozos shows highly seasonal trends requiring careful strategy. While the sections above show seasonal averages, it's also insightful to look at the extremes:
- During the high season, the absolute peak month showcases Pozos's highest earning potential, with monthly revenues capable of climbing to $2,216, occupancy reaching a high of 53.7%, and ADRs peaking at $131.
- Conversely, the slowest single month of the year, typically falling within the low season, marks the market's lowest point. In this month, revenue might dip to $669, occupancy could drop to 29.2%, and ADRs may adjust down to $112.
- Understanding both the seasonal averages and these monthly peaks and troughs in revenue, occupancy, and ADR is crucial for maximizing your Airbnb profit potential in Pozos.
Seasonal Strategies for Maximizing Profit
- Peak Season: Maximize revenue through premium pricing and potentially longer minimum stays. Ensure high availability.
- Low Season: Offer competitive pricing, special promotions (e.g., extended stay discounts), and flexible cancellation policies. Target off-season travelers like remote workers or budget-conscious guests.
- Shoulder Seasons: Implement dynamic pricing that balances peak and low rates. Target weekend travelers or specific events. Offer slightly more flexible terms than peak season.
- Regularly analyze your own performance against these Pozos seasonality benchmarks and adjust your pricing and availability strategy accordingly.
Best Areas for Airbnb Investment in Pozos (2026)
Exploring the top neighborhoods for short-term rentals in Pozos? This section highlights key areas, outlining why they are attractive for hosts and guests, along with notable local attractions. Consider these locations based on your target guest profile and investment strategy.
| Neighborhood / Area | Why Host Here? (Target Guests & Appeal) | Key Attractions & Landmarks |
|---|---|---|
| Santa Ana | A rapidly developing area with a mix of residential and commercial spaces, known for its proximity to San Jose and pleasant climate. Ideal for travelers looking for a suburban escape near the city. | Multiplaza Escazu, Parque Empresarial Zona Franca, Museo de Arte Costarricense, El Pueblo, Santa Ana downtown |
| Escazu | An upscale neighborhood known for its luxury homes and amenities. Popular for its beautiful views, shopping centers, and as a hub for expatriates. | Escazu Village, Paseo de las Flores, Plaza Laureles, Iglesia de Escazu, Café de los Angeles |
| San Pedro | A vibrant university area filled with young people, cafes, and cultural activities. Great for attracting younger travelers and those interested in a lively atmosphere. | Universidad de Costa Rica, Parque La Sabana, Casa del Cuño, Mercado de San Pedro, Café La Mancha |
| Heredia | Known for its picturesque surroundings and coffee plantations, this area attracts nature lovers and those seeking a peaceful getaway. | Barva Volcano, Orosi Coffee Tour, Parque Central de Heredia, Museo Histórico de Heredia, Café Brit |
| Alajuela | A convenient location near the international airport, making it ideal for travelers arriving in Costa Rica for short stays or transit. | Juan Santamaría International Airport, Central Park Alajuela, Museo Juan Santamaría, Zoo Ave, Coffee plant tours |
| Tamarindo | A beach town known for its surf culture and vibrant nightlife. Attracts tourists looking for sun, surf, and relaxation. | Tamarindo Beach, Las Baulas National Marine Park, Estuary Tours, Nightlife spots, Surf lessons |
| La Fortuna | Famous for its proximity to Arenal Volcano and stunning natural attractions. Perfect for adventure seekers and eco-tourists. | Arenal Volcano National Park, La Fortuna Waterfall, Hot Springs, Lake Arenal, Canopy Tours |
| Monteverde | A cloud forest reserve that offers unique biodiversity and eco-tourism activities. Popular among nature lovers and those seeking a tranquil retreat. | Monteverde Cloud Forest Reserve, Hanging Bridges, Sky Walk, Stargazing Tours, Coffee Tours |
Understanding Airbnb License Requirements & STR Laws in Pozos (2026)
While Pozos, San Jose Province, Costa Rica currently shows low STR regulations, specific Airbnb license requirements might still exist or change. Always verify the latest short term rental regulations and Airbnb license requirements directly with local government authorities for Pozos to ensure full compliance before hosting.
(Source: AirROI data, 2026, finding no licensed listings among those analyzed)
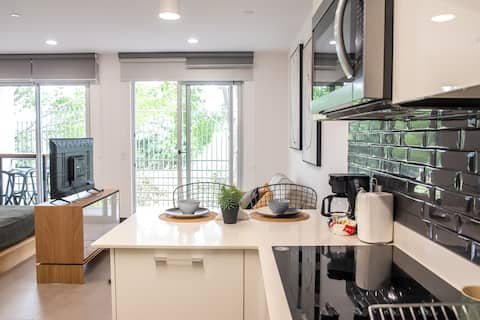
Top Performing Airbnb Properties in Pozos (2026)
Benchmark your potential! Explore examples of top-performing Airbnb properties in Pozosbased on Trailing Twelve Month (TTM) revenue. Analyze their characteristics, revenue, occupancy rate, and ADR to understand what drives success in this market.
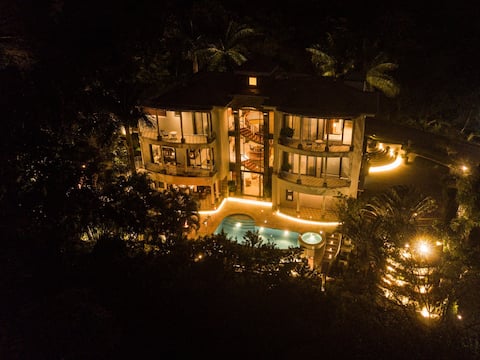
Exclusive Lux Estate
Entire Place • 5 bedrooms
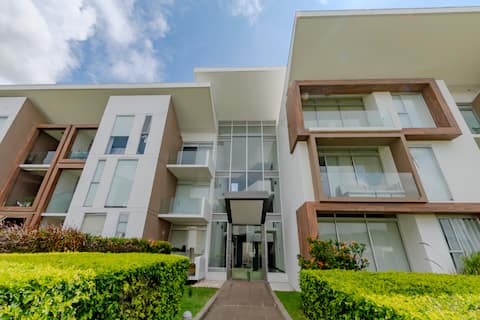
Apto 3 Hab Santa Ana cerca de todo. Full Equipado.
Entire Place • 3 bedrooms

Santa Ana/Escazu, 20 min to SJO, 10 min to CIMA
Entire Place • 2 bedrooms
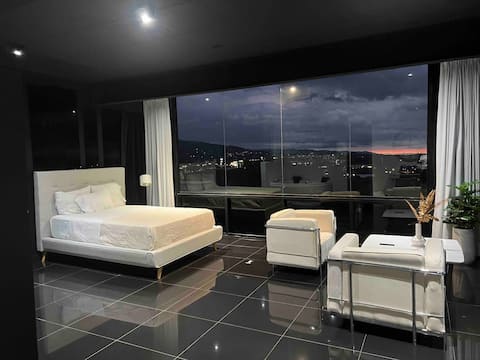
Apartment with Jacuzzi and beautiful city view
Entire Place • 1 bedroom
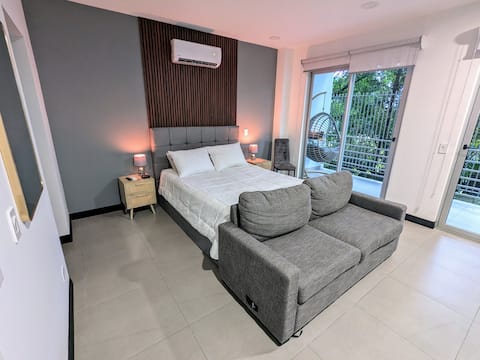
Secure Modern Flat in Santa Ana
Entire Place • 1 bedroom
Modern safe flat Lindora Santa Ana a/c
Entire Place • 1 bedroom
Note: Performance varies based on location, size, amenities, seasonality, and management quality. Data reflects the past 12 months.
Top Performing Airbnb Hosts in Pozos (2026)
Learn from the best! This table showcases top-performing Airbnb hosts in Pozos based on the number of properties managed and estimated total revenue over the past year. Analyze their scale and performance metrics.
| Host Name | Properties | Grossing Revenue | Stay Reviews | Avg Rating |
|---|---|---|---|---|
| Nemvo | 13 | $43,494 | 196 | 4.65/5.0 |
| Federico | 1 | $40,748 | 29 | 5.00/5.0 |
| Alejandro | 1 | $31,868 | 26 | 4.92/5.0 |
| Kattia | 3 | $18,629 | 9 | 4.83/5.0 |
| Maria | 1 | $18,539 | 26 | 4.92/5.0 |
| Felipe José | 1 | $15,312 | 191 | 4.75/5.0 |
| Franco | 1 | $15,286 | 37 | 4.86/5.0 |
| Miguel | 1 | $12,070 | 383 | 4.88/5.0 |
| Maria Amanda | 1 | $11,459 | 6 | 5.00/5.0 |
| Tatiana | 2 | $10,519 | 214 | 4.64/5.0 |
Analyzing the strategies of top hosts, such as their property selection, pricing, and guest communication, can offer valuable lessons for optimizing your own Airbnb operations in Pozos.
Dive Deeper: Advanced Pozos STR Market Data (2026)
Ready to unlock more insights? AirROI provides access to advanced metrics and comprehensive Airbnb data for Pozos. Explore detailed analytics beyond this report to refine your investment strategy, optimize pricing, and maximize your vacation rental profits.
Explore Advanced MetricsPozos Short-Term Rental Market Composition (2026): Property & Room Types
Room Type Distribution
Property Type Distribution
Market Composition Insights for Pozos
- The Pozos Airbnb market composition is heavily skewed towards Entire Home/Apt listings, which make up 97.4% of the 38 active rentals. This indicates strong guest preference for privacy and space.
- Looking at the property type distribution in Pozos, Apartment/Condo properties are the most common (81.6%), reflecting the local real estate landscape.
- Smaller segments like outdoor/unique, hotel/boutique (combined 5.2%) offer potential for unique stay experiences.
Pozos Airbnb Room Capacity Analysis (2026): Bedroom Distribution
Distribution of Listings by Number of Bedrooms
Room Capacity Insights for Pozos
- The dominant room capacity in Pozos is 1 bedroom listings, making up 73.7% of the market. This suggests a strong demand for properties suitable for couples or solo travelers.
- Together, 1 bedroom and 2 bedrooms properties represent 81.6% of the active Airbnb listings in Pozos, indicating a high concentration in these sizes.
- With over half the market (73.7%) consisting of studios or 1-bedroom units, Pozos is particularly well-suited for individuals or couples.
Pozos Vacation Rental Guest Capacity Trends (2026)
Distribution of Listings by Guest Capacity
Guest Capacity Insights for Pozos
- The most common guest capacity trend in Pozos vacation rentals is listings accommodating 2 guests (57.9%). This suggests the primary traveler segment is likely couples or solo travelers.
- Properties designed for 2 guests and 4 guests dominate the Pozos STR market, accounting for 71.1% of listings.
- A significant 57.9% of listings cater specifically to 1-2 guests, highlighting strong demand from couples and solo travelers in Pozos.
- 15.9% of properties accommodate 6+ guests, serving the market segment for larger families or group travel in Pozos.
- On average, properties in Pozos are equipped to host 3.2 guests.
Pozos Airbnb Booking Patterns (2026): Available vs. Booked Days
Available Days Distribution
Booked Days Distribution
Booking Pattern Insights for Pozos
- The most common availability pattern in Pozos falls within the 271-366 days range, representing 63.2% of listings. This suggests many properties have significant open periods on their calendars.
- Approximately 86.9% of listings show high availability (181+ days open annually), indicating potential for increased bookings or specific owner usage patterns.
- For booked days, the 31-90 days range is most frequent in Pozos (34.2%), reflecting common guest stay durations or potential owner blocking patterns.
- A notable 13.1% of properties secure long booking periods (181+ days booked per year), highlighting successful long-term rental strategies or significant owner usage.
Pozos Airbnb Minimum Stay Requirements Analysis
Distribution of Listings by Minimum Night Requirement
1 Night
7 listings
18.4% of total
2 Nights
21 listings
55.3% of total
3 Nights
3 listings
7.9% of total
7-29 Nights
1 listings
2.6% of total
30+ Nights
6 listings
15.8% of total
Key Insights
- The most prevalent minimum stay requirement in Pozos is 2 Nights, adopted by 55.3% of listings. This highlights the market's preference for shorter, flexible bookings.
- A strong majority (73.7%) of the Pozos Airbnb data shows acceptance of very short stays (1-2 nights), indicating a dynamic, high-turnover market.
- A significant segment (15.8%) caters to monthly stays (30+ nights) in Pozos, pointing to opportunities in the extended-stay market.
Recommendations
- Align with the market by considering a 2 Nights minimum stay, as 55.3% of Pozos hosts use this setting.
- If feasible, allowing 1-night stays, especially midweek or during low season, could capture last-minute bookings, as only 18.4% currently do.
- A 2-night minimum appears standard (55.3%). Consider this for weekends or peak periods.
- Explore offering discounts for stays of 30+ nights to attract the 15.8% of the market seeking extended stays.
- Adjust minimum nights based on seasonality – potentially shorter during low season and longer during peak demand periods in Pozos.
Pozos Airbnb Cancellation Policy Trends Analysis (2026)
Flexible
14 listings
36.8% of total
Moderate
8 listings
21.1% of total
Firm
13 listings
34.2% of total
Strict
3 listings
7.9% of total
Cancellation Policy Insights for Pozos
- The prevailing Airbnb cancellation policy trend in Pozos is Flexible, used by 36.8% of listings.
- There's a relatively balanced mix between guest-friendly (57.9%) and stricter (42.1%) policies, offering choices for different guest needs.
- Strict cancellation policies are quite rare (7.9%), potentially making listings with this policy less competitive unless justified by high demand or property type.
Recommendations for Hosts
- Consider adopting a Flexible policy to align with the 36.8% market standard in Pozos.
- Using a Strict policy might deter some guests, as only 7.9% of listings use it. Evaluate if potential revenue protection outweighs possible lower booking rates.
- Regularly review your cancellation policy against competitors and market demand shifts in Pozos.
Pozos STR Booking Lead Time Analysis (2026)
Average Booking Lead Time by Month
Booking Lead Time Insights for Pozos
- The overall average booking lead time for vacation rentals in Pozos is 19 days.
- Guests book furthest in advance for stays during January (average 28 days), likely coinciding with peak travel demand or local events.
- The shortest booking windows occur for stays in October (average 6 days), indicating more last-minute travel plans during this time.
- Seasonally, Winter (22 days avg.) sees the longest lead times, while Fall (13 days avg.) has the shortest, reflecting typical travel planning cycles.
Recommendations for Hosts
- Use the overall average lead time (19 days) as a baseline for your pricing and availability strategy in Pozos.
- During October, focus on last-minute booking availability and promotions, as guests book with very short notice (6 days avg.).
- Target marketing efforts for the Winter season well in advance (at least 22 days) to capture early planners.
- Monitor your own booking lead times against these Pozos averages to identify opportunities for dynamic pricing adjustments.
Popular & Essential Airbnb Amenities in Pozos (2026)
Amenity Prevalence
Amenity Insights for Pozos
- Essential amenities in Pozos that guests expect include: Wifi. Lacking these (this) could significantly impact bookings.
- Popular amenities like Free parking on premises, TV, Air conditioning are common but not universal. Offering these can provide a competitive edge.
Recommendations for Hosts
- Ensure your listing includes all essential amenities for Pozos: Wifi.
- Consider adding popular differentiators like Free parking on premises or TV to increase appeal.
- Highlight unique or less common amenities you offer (e.g., hot tub, dedicated workspace, EV charger) in your listing description and photos.
- Regularly check competitor amenities in Pozos to stay competitive.
Pozos Airbnb Guest Demographics & Profile Analysis (2026)
Guest Profile Summary for Pozos
- The typical guest profile for Airbnb in Pozos consists of a mix of domestic (51%) and international guests, often arriving from nearby San José, typically belonging to the Post-2000s (Gen Z/Alpha) group (50%), primarily speaking Spanish or English.
- Domestic travelers account for 51.1% of guests.
- Key international markets include Costa Rica (51.1%) and United States (26.7%).
- Top languages spoken are Spanish (43.8%) followed by English (39.2%).
- A significant demographic segment is the Post-2000s (Gen Z/Alpha) group, representing 50% of guests.
Recommendations for Hosts
- Balance marketing efforts between domestic and international channels based on the guest mix.
- Tailor amenities and listing descriptions to appeal to the dominant Post-2000s (Gen Z/Alpha) demographic (e.g., highlight fast WiFi, smart home features, local guides).
- Highlight unique local experiences or amenities relevant to the primary guest profile.
- Consider seasonal promotions aligned with peak travel times for key origin markets.
Nearby Short-Term Rental Market Comparison
How does the Pozos Airbnb market stack up against its neighbors? Compare key performance metrics like average monthly revenue, ADR, and occupancy rates in surrounding areas to understand the broader regional STR landscape.
| Market | Active Properties | Monthly Revenue | Daily Rate | Avg. Occupancy |
|---|---|---|---|---|
| Nacascolo | 32 | $6,132 | $1145.14 | 33% |
| Pinilla | 91 | $4,982 | $544.03 | 35% |
| Playa Tamarindo | 21 | $4,869 | $404.48 | 44% |
| Playa Langosta | 163 | $4,380 | $474.00 | 39% |
| Punta Islita | 27 | $4,193 | $518.64 | 36% |
| Tamarindo | 1,302 | $3,897 | $386.82 | 41% |
| Osa | 10 | $3,418 | $586.45 | 32% |
| Cabo Velas | 922 | $3,316 | $381.01 | 38% |
| Playa Grande | 33 | $3,195 | $397.35 | 40% |
| Nosara | 873 | $3,169 | $421.13 | 39% |