Copey Airbnb Market Analysis 2026: Short Term Rental Data & Vacation Rental Statistics in San Jose Province, Costa Rica
Is Airbnb profitable in Copey in 2026? Explore comprehensive Airbnb analytics for Copey, San Jose Province, Costa Rica to uncover income potential. This 2026 STR market report for Copey, based on AirROI data from February 2025 to January 2026, reveals key trends in the niche market of 74 active listings.
Whether you're considering an Airbnb investment in Copey, optimizing your existing vacation rental, or exploring rental arbitrage opportunities, understanding the Copey Airbnb data is crucial. Leveraging the low regulation environment is key to maximizing your short term rental income potential. Let's dive into the specifics.
Key Copey Airbnb Performance Metrics Overview
Monthly Airbnb Revenue Variations & Income Potential in Copey (2026)
Understanding the monthly revenue variations for Airbnb listings in Copey is key to maximizing your short term rental income potential. Seasonality significantly impacts earnings. Our analysis, based on data from the past 12 months, shows that the peak revenue month for STRs in Copey is typically January, while October often presents the lowest earnings, highlighting opportunities for strategic pricing adjustments during shoulder and low seasons. Explore the typical Airbnb income in Copey across different performance tiers:
- Best-in-class properties (Top 10%) achieve $2,774+ monthly, often utilizing dynamic pricing and superior guest experiences.
- Strong performing properties (Top 25%) earn $1,268 or more, indicating effective management and desirable locations/amenities.
- Typical properties (Median) generate around $679 per month, representing the average market performance.
- Entry-level properties (Bottom 25%) see earnings around $347, often with potential for optimization.
Average Monthly Airbnb Earnings Trend in Copey
Copey Airbnb Occupancy Rate Trends (2026)
Maximize your bookings by understanding the Copey STR occupancy trends. Seasonal demand shifts significantly influence how often properties are booked. Typically, Februarysees the highest demand (peak season occupancy), while October experiences the lowest (low season). Effective strategies, like adjusting minimum stays or offering promotions, can boost occupancy during slower periods. Here's how different property tiers perform in Copey:
- Best-in-class properties (Top 10%) achieve 59%+ occupancy, indicating high desirability and potentially optimized availability.
- Strong performing properties (Top 25%) maintain 41% or higher occupancy, suggesting good market fit and guest satisfaction.
- Typical properties (Median) have an occupancy rate around 25%.
- Entry-level properties (Bottom 25%) average 14% occupancy, potentially facing higher vacancy.
Average Monthly Occupancy Rate Trend in Copey
Average Daily Rate (ADR) Airbnb Trends in Copey (2026)
Effective short term rental pricing strategy in Copey involves understanding monthly ADR fluctuations. The Average Daily Rate (ADR) for Airbnb in Copey typically peaks in January and dips lowest during February. Leveraging Airbnb dynamic pricing tools or strategies based on this seasonality can significantly boost revenue. Here's a look at the typical nightly rates achieved:
- Best-in-class properties (Top 10%) command rates of $203+ per night, often due to premium features or locations.
- Strong performing properties (Top 25%) achieve nightly rates of $118 or more.
- Typical properties (Median) charge around $83 per night.
- Entry-level properties (Bottom 25%) earn around $60 per night.
Average Daily Rate (ADR) Trend by Month in Copey
Get Live Copey Market Intelligence 👇

Explore Real-time Analytics
Airbnb Seasonality Analysis & Trends in Copey (2026)
Peak Season (January, March, April)
- Revenue averages $1,432 per month
- Occupancy rates average 36.5%
- Daily rates average $111
Shoulder Season
- Revenue averages $1,210 per month
- Occupancy maintains around 29.6%
- Daily rates hold near $109
Low Season (June, September, October)
- Revenue drops to average $937 per month
- Occupancy decreases to average 22.7%
- Daily rates adjust to average $111
Seasonality Insights for Copey
- The Airbnb seasonality in Copey shows moderate seasonality with distinct peak and low periods. While the sections above show seasonal averages, it's also insightful to look at the extremes:
- During the high season, the absolute peak month showcases Copey's highest earning potential, with monthly revenues capable of climbing to $1,595, occupancy reaching a high of 37.2%, and ADRs peaking at $119.
- Conversely, the slowest single month of the year, typically falling within the low season, marks the market's lowest point. In this month, revenue might dip to $826, occupancy could drop to 21.0%, and ADRs may adjust down to $104.
- Understanding both the seasonal averages and these monthly peaks and troughs in revenue, occupancy, and ADR is crucial for maximizing your Airbnb profit potential in Copey.
Seasonal Strategies for Maximizing Profit
- Peak Season: Maximize revenue through premium pricing and potentially longer minimum stays. Ensure high availability.
- Low Season: Offer competitive pricing, special promotions (e.g., extended stay discounts), and flexible cancellation policies. Target off-season travelers like remote workers or budget-conscious guests.
- Shoulder Seasons: Implement dynamic pricing that balances peak and low rates. Target weekend travelers or specific events. Offer slightly more flexible terms than peak season.
- Regularly analyze your own performance against these Copey seasonality benchmarks and adjust your pricing and availability strategy accordingly.
Best Areas for Airbnb Investment in Copey (2026)
Exploring the top neighborhoods for short-term rentals in Copey? This section highlights key areas, outlining why they are attractive for hosts and guests, along with notable local attractions. Consider these locations based on your target guest profile and investment strategy.
| Neighborhood / Area | Why Host Here? (Target Guests & Appeal) | Key Attractions & Landmarks |
|---|---|---|
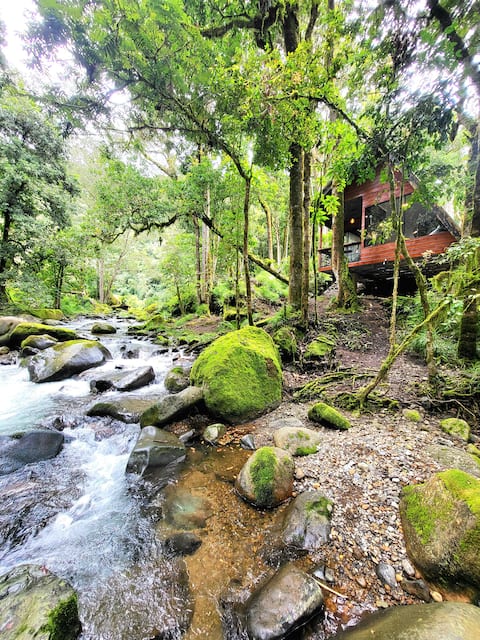
| Copey de Dota | A serene and picturesque location nestled in the mountains, known for its lush landscapes and rich biodiversity. Ideal for nature lovers and those seeking a peaceful retreat. | Los Quetzales National Park, Cloud Forests, Bird watching, Hiking trails, Trout fishing |
| San Gerardo de Dota | Famous for its stunning natural beauty and biodiversity, this area attracts nature enthusiasts and offers a tranquil escape from urban life. | Cerro de la Muerte, Los Quetzales National Park, Birdwatching, Hiking Adventures, Charming local eateries |
| Santa María de Dota | A quaint town offering picturesque views of the mountains and coffee plantations, perfect for those looking to experience coffee culture and local traditions. | Coffee plantations, Local fairs, Hiking trails, Cultural experiences, Stunning views |
| El alto de La Palma | A rural community offering a genuine Costa Rican experience. Great for hiding from the city hustle and enjoying the fresh air and scenic views. | Stargazing, Nature walks, Local shops, Traditional cuisine, Cultural activities |
| Cieneguita | A lesser-known village offering a serene environment and proximity to nature trails, ideal for travelers looking to escape the tourist crowds. | Nature walks, Local fauna, Cultural immersion, Quiet landscapes, Rural experiences |
| Los Angeles | This village features beautiful scenery and is a gateway to numerous outdoor activities in the surrounding mountains, attracting adventure seekers. | Outdoor adventures, Scenic landscapes, Nature hikes, Campgrounds, Wildlife observations |
| San Ignacio | A peaceful town known for its warm community and beautiful surroundings, ideal for visitors looking to connect with local culture and nature. | Local markets, Hiking trails, Community festivals, Cultural experiences, Nature reserves |
| Aserri | A suburb of San José offering cooler temperatures and easy access to nature, appealing to visitors looking for a mix of urban and natural experiences. | Natural parks, Cultural sites, Restaurants, Cafes, Scenic viewpoints |
Understanding Airbnb License Requirements & STR Laws in Copey (2026)
While Copey, San Jose Province, Costa Rica currently shows low STR regulations, specific Airbnb license requirements might still exist or change. Always verify the latest short term rental regulations and Airbnb license requirements directly with local government authorities for Copey to ensure full compliance before hosting.
(Source: AirROI data, 2026, finding no licensed listings among those analyzed)
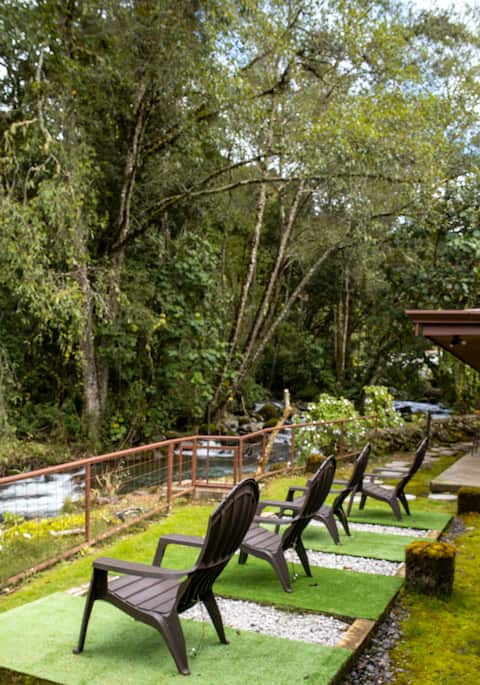
Top Performing Airbnb Properties in Copey (2026)
Benchmark your potential! Explore examples of top-performing Airbnb properties in Copeybased on Trailing Twelve Month (TTM) revenue. Analyze their characteristics, revenue, occupancy rate, and ADR to understand what drives success in this market.
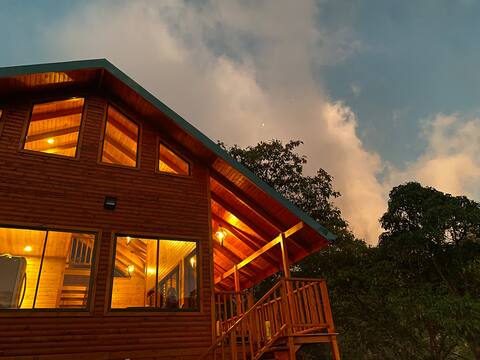
Unicorn Chalet : A Riverfront Quetzal Paradise !
Entire Place • 1 bedroom

Unicorn Lodge:Riverfront: Best of Costa Rica Award
Entire Place • 2 bedrooms

Unicorn Dome:Private Riverfront Jacuzzi Tub:Relax!
Entire Place • 1 bedroom

Unicorn Aframe : Breathtaking River Views !
Entire Place • 2 bedrooms
Nice Mountain Cabin in CostaRica
Entire Place • 2 bedrooms
River House
Entire Place • 3 bedrooms
Note: Performance varies based on location, size, amenities, seasonality, and management quality. Data reflects the past 12 months.
Top Performing Airbnb Hosts in Copey (2026)
Learn from the best! This table showcases top-performing Airbnb hosts in Copey based on the number of properties managed and estimated total revenue over the past year. Analyze their scale and performance metrics.
| Host Name | Properties | Grossing Revenue | Stay Reviews | Avg Rating |
|---|---|---|---|---|
| Jessica And Travis | 4 | $278,449 | 529 | 4.94/5.0 |
| Joost | 4 | $58,862 | 26 | 5.00/5.0 |
| Laura | 1 | $35,625 | 44 | 4.91/5.0 |
| Hotel Savegre | 2 | $34,629 | 51 | 4.50/5.0 |
| Rolland | 3 | $26,924 | 228 | 4.86/5.0 |
| Kenneth | 3 | $22,473 | 32 | 4.90/5.0 |
| Ernesto | 2 | $20,854 | 83 | 4.91/5.0 |
| Amanda | 3 | $20,492 | 388 | 4.77/5.0 |
| Roberto | 2 | $19,338 | 377 | 4.82/5.0 |
| Finca San Francisco | 1 | $17,462 | 45 | 4.98/5.0 |
Analyzing the strategies of top hosts, such as their property selection, pricing, and guest communication, can offer valuable lessons for optimizing your own Airbnb operations in Copey.
Dive Deeper: Advanced Copey STR Market Data (2026)
Ready to unlock more insights? AirROI provides access to advanced metrics and comprehensive Airbnb data for Copey. Explore detailed analytics beyond this report to refine your investment strategy, optimize pricing, and maximize your vacation rental profits.
Explore Advanced MetricsCopey Short-Term Rental Market Composition (2026): Property & Room Types
Room Type Distribution
Property Type Distribution
Market Composition Insights for Copey
- The Copey Airbnb market composition is heavily skewed towards Entire Home/Apt listings, which make up 81.1% of the 74 active rentals. This indicates strong guest preference for privacy and space.
- Looking at the property type distribution in Copey, Outdoor/Unique properties are the most common (64.9%), reflecting the local real estate landscape.
- Houses represent a significant 18.9% portion, catering likely to families or larger groups.
- The presence of 9.5% Hotel/Boutique listings indicates integration with traditional hospitality.
- Smaller segments like apartment/condo, others, unique stays (combined 6.8%) offer potential for unique stay experiences.
Copey Airbnb Room Capacity Analysis (2026): Bedroom Distribution
Distribution of Listings by Number of Bedrooms
Room Capacity Insights for Copey
- The dominant room capacity in Copey is 1 bedroom listings, making up 51.4% of the market. This suggests a strong demand for properties suitable for couples or solo travelers.
- Together, 1 bedroom and 2 bedrooms properties represent 86.5% of the active Airbnb listings in Copey, indicating a high concentration in these sizes.
- With over half the market (51.4%) consisting of studios or 1-bedroom units, Copey is particularly well-suited for individuals or couples.
Copey Vacation Rental Guest Capacity Trends (2026)
Distribution of Listings by Guest Capacity
Guest Capacity Insights for Copey
- The most common guest capacity trend in Copey vacation rentals is listings accommodating 4 guests (33.8%). This suggests the primary traveler segment is likely small families or groups.
- Properties designed for 4 guests and 2 guests dominate the Copey STR market, accounting for 63.5% of listings.
- 23.1% of properties accommodate 6+ guests, serving the market segment for larger families or group travel in Copey.
- On average, properties in Copey are equipped to host 3.9 guests.
Copey Airbnb Booking Patterns (2026): Available vs. Booked Days
Available Days Distribution
Booked Days Distribution
Booking Pattern Insights for Copey
- The most common availability pattern in Copey falls within the 271-366 days range, representing 66.2% of listings. This suggests many properties have significant open periods on their calendars.
- Approximately 94.6% of listings show high availability (181+ days open annually), indicating potential for increased bookings or specific owner usage patterns.
- For booked days, the 31-90 days range is most frequent in Copey (47.3%), reflecting common guest stay durations or potential owner blocking patterns.
- A notable 6.8% of properties secure long booking periods (181+ days booked per year), highlighting successful long-term rental strategies or significant owner usage.
Copey Airbnb Minimum Stay Requirements Analysis
Distribution of Listings by Minimum Night Requirement
1 Night
65 listings
87.8% of total
2 Nights
6 listings
8.1% of total
30+ Nights
3 listings
4.1% of total
Key Insights
- The most prevalent minimum stay requirement in Copey is 1 Night, adopted by 87.8% of listings. This highlights the market's preference for shorter, flexible bookings.
- A strong majority (95.9%) of the Copey Airbnb data shows acceptance of very short stays (1-2 nights), indicating a dynamic, high-turnover market.
Recommendations
- Align with the market by considering a 1 Night minimum stay, as 87.8% of Copey hosts use this setting.
- Adjust minimum nights based on seasonality – potentially shorter during low season and longer during peak demand periods in Copey.
Copey Airbnb Cancellation Policy Trends Analysis (2026)
Flexible
32 listings
43.2% of total
Moderate
20 listings
27% of total
Firm
19 listings
25.7% of total
Strict
3 listings
4.1% of total
Cancellation Policy Insights for Copey
- The prevailing Airbnb cancellation policy trend in Copey is Flexible, used by 43.2% of listings.
- The market strongly favors guest-friendly terms, with 70.2% of listings offering Flexible or Moderate policies. This suggests guests in Copey may expect booking flexibility.
- Strict cancellation policies are quite rare (4.1%), potentially making listings with this policy less competitive unless justified by high demand or property type.
Recommendations for Hosts
- Consider adopting a Flexible policy to align with the 43.2% market standard in Copey.
- Using a Strict policy might deter some guests, as only 4.1% of listings use it. Evaluate if potential revenue protection outweighs possible lower booking rates.
- Regularly review your cancellation policy against competitors and market demand shifts in Copey.
Copey STR Booking Lead Time Analysis (2026)
Average Booking Lead Time by Month
Booking Lead Time Insights for Copey
- The overall average booking lead time for vacation rentals in Copey is 38 days.
- Guests book furthest in advance for stays during December (average 61 days), likely coinciding with peak travel demand or local events.
- The shortest booking windows occur for stays in June (average 21 days), indicating more last-minute travel plans during this time.
- Seasonally, Winter (59 days avg.) sees the longest lead times, while Summer (27 days avg.) has the shortest, reflecting typical travel planning cycles.
Recommendations for Hosts
- Use the overall average lead time (38 days) as a baseline for your pricing and availability strategy in Copey.
- For December stays, consider implementing length-of-stay discounts or slightly higher rates for bookings made less than 61 days out to capitalize on advance planning.
- Target marketing efforts for the Winter season well in advance (at least 59 days) to capture early planners.
- Monitor your own booking lead times against these Copey averages to identify opportunities for dynamic pricing adjustments.
Popular & Essential Airbnb Amenities in Copey (2026)
Amenity Prevalence
Amenity Insights for Copey
- Essential amenities in Copey that guests expect include: Free parking on premises. Lacking these (this) could significantly impact bookings.
- Popular amenities like Hot water, Wifi, Coffee maker are common but not universal. Offering these can provide a competitive edge.
- Warning: Wifi is not universally provided but is considered essential globally. Ensure reliable Wifi is offered.
Recommendations for Hosts
- Ensure your listing includes all essential amenities for Copey: Free parking on premises.
- Prioritize adding missing essentials: Free parking on premises.
- Consider adding popular differentiators like Hot water or Wifi to increase appeal.
- Highlight unique or less common amenities you offer (e.g., hot tub, dedicated workspace, EV charger) in your listing description and photos.
- Regularly check competitor amenities in Copey to stay competitive.
Copey Airbnb Guest Demographics & Profile Analysis (2026)
Guest Profile Summary for Copey
- The typical guest profile for Airbnb in Copey consists of a mix of domestic (53%) and international guests, often arriving from nearby San José, typically belonging to the Post-2000s (Gen Z/Alpha) group (50%), primarily speaking English or Spanish.
- Domestic travelers account for 52.6% of guests.
- Key international markets include Costa Rica (52.6%) and United States (20.7%).
- Top languages spoken are English (42.4%) followed by Spanish (38.6%).
- A significant demographic segment is the Post-2000s (Gen Z/Alpha) group, representing 50% of guests.
Recommendations for Hosts
- Balance marketing efforts between domestic and international channels based on the guest mix.
- Tailor amenities and listing descriptions to appeal to the dominant Post-2000s (Gen Z/Alpha) demographic (e.g., highlight fast WiFi, smart home features, local guides).
- Highlight unique local experiences or amenities relevant to the primary guest profile.
- Consider seasonal promotions aligned with peak travel times for key origin markets.
Nearby Short-Term Rental Market Comparison
How does the Copey Airbnb market stack up against its neighbors? Compare key performance metrics like average monthly revenue, ADR, and occupancy rates in surrounding areas to understand the broader regional STR landscape.
| Market | Active Properties | Monthly Revenue | Daily Rate | Avg. Occupancy |
|---|---|---|---|---|
| Osa | 10 | $3,418 | $586.45 | 32% |
| Savegre de Aguirre | 15 | $2,740 | $372.47 | 36% |
| Quepos | 1,172 | $2,594 | $246.50 | 39% |
| Cabeceras | 33 | $2,508 | $190.48 | 44% |
| Caldera | 36 | $2,490 | $270.58 | 33% |
| Venado | 10 | $2,404 | $200.90 | 41% |
| Jacó | 2,135 | $2,188 | $296.12 | 33% |
| Savegre | 186 | $2,150 | $256.31 | 34% |
| Bahía Ballena | 1,282 | $2,099 | $237.59 | 37% |
| Tárcoles | 294 | $1,978 | $253.51 | 30% |