Lepanto Airbnb Market Analysis 2026: Short Term Rental Data & Vacation Rental Statistics in Puntarenas Province, Costa Rica
Is Airbnb profitable in Lepanto in 2026? Explore comprehensive Airbnb analytics for Lepanto, Puntarenas Province, Costa Rica to uncover income potential. This 2026 STR market report for Lepanto, based on AirROI data from February 2025 to January 2026, reveals key trends in the niche market of 21 active listings.
Whether you're considering an Airbnb investment in Lepanto, optimizing your existing vacation rental, or exploring rental arbitrage opportunities, understanding the Lepanto Airbnb data is crucial. Leveraging the low regulation environment is key to maximizing your short term rental income potential. Let's dive into the specifics.
Key Lepanto Airbnb Performance Metrics Overview
Monthly Airbnb Revenue Variations & Income Potential in Lepanto (2026)
Understanding the monthly revenue variations for Airbnb listings in Lepanto is key to maximizing your short term rental income potential. Seasonality significantly impacts earnings. Our analysis, based on data from the past 12 months, shows that the peak revenue month for STRs in Lepanto is typically April, while October often presents the lowest earnings, highlighting opportunities for strategic pricing adjustments during shoulder and low seasons. Explore the typical Airbnb income in Lepanto across different performance tiers:
- Best-in-class properties (Top 10%) achieve $1,063+ monthly, often utilizing dynamic pricing and superior guest experiences.
- Strong performing properties (Top 25%) earn $670 or more, indicating effective management and desirable locations/amenities.
- Typical properties (Median) generate around $329 per month, representing the average market performance.
- Entry-level properties (Bottom 25%) see earnings around $216, often with potential for optimization.
Average Monthly Airbnb Earnings Trend in Lepanto
Lepanto Airbnb Occupancy Rate Trends (2026)
Maximize your bookings by understanding the Lepanto STR occupancy trends. Seasonal demand shifts significantly influence how often properties are booked. Typically, Aprilsees the highest demand (peak season occupancy), while October experiences the lowest (low season). Effective strategies, like adjusting minimum stays or offering promotions, can boost occupancy during slower periods. Here's how different property tiers perform in Lepanto:
- Best-in-class properties (Top 10%) achieve 29%+ occupancy, indicating high desirability and potentially optimized availability.
- Strong performing properties (Top 25%) maintain 20% or higher occupancy, suggesting good market fit and guest satisfaction.
- Typical properties (Median) have an occupancy rate around 11%.
- Entry-level properties (Bottom 25%) average 8% occupancy, potentially facing higher vacancy.
Average Monthly Occupancy Rate Trend in Lepanto
Average Daily Rate (ADR) Airbnb Trends in Lepanto (2026)
Effective short term rental pricing strategy in Lepanto involves understanding monthly ADR fluctuations. The Average Daily Rate (ADR) for Airbnb in Lepanto typically peaks in December and dips lowest during March. Leveraging Airbnb dynamic pricing tools or strategies based on this seasonality can significantly boost revenue. Here's a look at the typical nightly rates achieved:
- Best-in-class properties (Top 10%) command rates of $209+ per night, often due to premium features or locations.
- Strong performing properties (Top 25%) achieve nightly rates of $109 or more.
- Typical properties (Median) charge around $75 per night.
- Entry-level properties (Bottom 25%) earn around $58 per night.
Average Daily Rate (ADR) Trend by Month in Lepanto
Get Live Lepanto Market Intelligence 👇

Explore Real-time Analytics
Airbnb Seasonality Analysis & Trends in Lepanto (2026)
Peak Season (April, June, January)
- Revenue averages $664 per month
- Occupancy rates average 18.1%
- Daily rates average $111
Shoulder Season
- Revenue averages $484 per month
- Occupancy maintains around 15.8%
- Daily rates hold near $110
Low Season (May, October, November)
- Revenue drops to average $224 per month
- Occupancy decreases to average 7.7%
- Daily rates adjust to average $113
Seasonality Insights for Lepanto
- The Airbnb seasonality in Lepanto shows highly seasonal trends requiring careful strategy. While the sections above show seasonal averages, it's also insightful to look at the extremes:
- During the high season, the absolute peak month showcases Lepanto's highest earning potential, with monthly revenues capable of climbing to $739, occupancy reaching a high of 20.7%, and ADRs peaking at $121.
- Conversely, the slowest single month of the year, typically falling within the low season, marks the market's lowest point. In this month, revenue might dip to $206, occupancy could drop to 7.0%, and ADRs may adjust down to $104.
- Understanding both the seasonal averages and these monthly peaks and troughs in revenue, occupancy, and ADR is crucial for maximizing your Airbnb profit potential in Lepanto.
Seasonal Strategies for Maximizing Profit
- Peak Season: Maximize revenue through premium pricing and potentially longer minimum stays. Ensure high availability.
- Low Season: Offer competitive pricing, special promotions (e.g., extended stay discounts), and flexible cancellation policies. Target off-season travelers like remote workers or budget-conscious guests.
- Shoulder Seasons: Implement dynamic pricing that balances peak and low rates. Target weekend travelers or specific events. Offer slightly more flexible terms than peak season.
- Regularly analyze your own performance against these Lepanto seasonality benchmarks and adjust your pricing and availability strategy accordingly.
Best Areas for Airbnb Investment in Lepanto (2026)
Exploring the top neighborhoods for short-term rentals in Lepanto? This section highlights key areas, outlining why they are attractive for hosts and guests, along with notable local attractions. Consider these locations based on your target guest profile and investment strategy.
| Neighborhood / Area | Why Host Here? (Target Guests & Appeal) | Key Attractions & Landmarks |
|---|---|---|
| Lepanto Beach | A serene beach area known for its natural beauty and tranquility. It attracts visitors looking for a peaceful getaway with unspoiled landscapes and wildlife. | Lepanto Beach, Local fishing spots, Nature trails, Wildlife viewing, Beachfront cafes |
| Playa Manzanillo | This stunning beach is popular for its clear waters and beautiful sunsets. Great for families and couples seeking a romantic environment. | Manzanillo Beach, Snorkeling spots, Water sports, Cozy beachfront restaurants, Picnic areas |
| Playa Herradura | Close to Jaco, this beach area is known for luxury resorts and a vibrant nightlife. Ideal for tourists seeking action and fun activities. | Herradura Beach, Marina Herradura, Los Suenos Resort, Golf courses, Nightlife spots |
| Isla Tortuga | An offshore island famous for its beautiful beaches and marine life. A perfect destination for day trips and adventure seekers. | Tortuga Island, Snorkeling tours, Boat trips, Scenic views, Wildlife observation |
| Cabuya | A small village that offers eco-tourism and access to Curu Wildlife Reserve. It attracts nature lovers and those looking for adventure. | Curu Wildlife Reserve, Cabuya Island, Waterfall hikes, Local artisan shops, Beach camping |
| Monteverde | Famous for its cloud forests and rich biodiversity. Attracts nature enthusiasts, bird watchers, and families. | Monteverde Cloud Forest Reserve, Hanging bridges, Coffee plantations, Zip-lining tours, Birdwatching spots |
| Quepos | Flagship destination for sports fishing and gateway to Manuel Antonio National Park. Ideal for adventure travelers. | Manuel Antonio National Park, Marina Pez Vela, Beachfront dining, Outdoor sports, Wildlife tours |
| Jaco | A vibrant coastal town known for its surf culture and nightlife. Popular among young travelers and surfers. | Jaco Beach, Surf schools, Nightclubs, Dining options, Shopping areas |
Understanding Airbnb License Requirements & STR Laws in Lepanto (2026)
While Lepanto, Puntarenas Province, Costa Rica currently shows low STR regulations, specific Airbnb license requirements might still exist or change. Always verify the latest short term rental regulations and Airbnb license requirements directly with local government authorities for Lepanto to ensure full compliance before hosting.
(Source: AirROI data, 2026, finding no licensed listings among those analyzed)
Top Performing Airbnb Properties in Lepanto (2026)
Benchmark your potential! Explore examples of top-performing Airbnb properties in Lepantobased on Trailing Twelve Month (TTM) revenue. Analyze their characteristics, revenue, occupancy rate, and ADR to understand what drives success in this market.
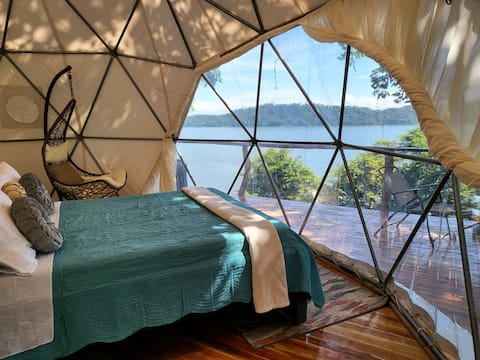
Luxury dome on an island, ocean view and pool
Entire Place • 1 bedroom

A dome on the island with an ocean view and a Jacuzzi
Entire Place • 1 bedroom

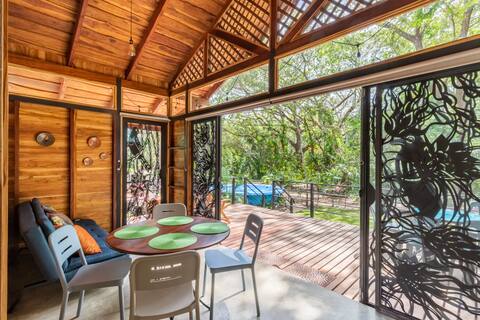
House with a beautiful ocean view
Entire Place • 3 bedrooms

Connect with nature in Nicoya Silvestre!
Entire Place • N/A
Connect with nature: Nicoya Silvestre farm!
Entire Place • 1 bedroom

Casa Mangos Macondo Lepanto
Entire Place • 2 bedrooms
Note: Performance varies based on location, size, amenities, seasonality, and management quality. Data reflects the past 12 months.
Top Performing Airbnb Hosts in Lepanto (2026)
Learn from the best! This table showcases top-performing Airbnb hosts in Lepanto based on the number of properties managed and estimated total revenue over the past year. Analyze their scale and performance metrics.
| Host Name | Properties | Grossing Revenue | Stay Reviews | Avg Rating |
|---|---|---|---|---|
| Carolina | 2 | $18,630 | 17 | 5.00/5.0 |
| Karol | 2 | $10,514 | 31 | 4.79/5.0 |
| Lucia | 1 | $7,841 | 23 | 5.00/5.0 |
| Michelle | 3 | $6,049 | 47 | 4.34/5.0 |
| Leidy Karina | 1 | $4,612 | 5 | 4.60/5.0 |
| Greivin | 3 | $4,090 | 75 | 4.93/5.0 |
| Luana | 1 | $3,983 | 42 | 4.81/5.0 |
| Dinlogan | 2 | $3,375 | 44 | 4.87/5.0 |
| Ana Laura | 1 | $3,336 | 7 | 4.57/5.0 |
| Ashlynn | 1 | $2,027 | 2 | Not Rated |
Analyzing the strategies of top hosts, such as their property selection, pricing, and guest communication, can offer valuable lessons for optimizing your own Airbnb operations in Lepanto.
Dive Deeper: Advanced Lepanto STR Market Data (2026)
Ready to unlock more insights? AirROI provides access to advanced metrics and comprehensive Airbnb data for Lepanto. Explore detailed analytics beyond this report to refine your investment strategy, optimize pricing, and maximize your vacation rental profits.
Explore Advanced MetricsLepanto Short-Term Rental Market Composition (2026): Property & Room Types
Room Type Distribution
Property Type Distribution
Market Composition Insights for Lepanto
- The Lepanto Airbnb market composition is heavily skewed towards Entire Home/Apt listings, which make up 95.2% of the 21 active rentals. This indicates strong guest preference for privacy and space.
- Looking at the property type distribution in Lepanto, Outdoor/Unique properties are the most common (57.1%), reflecting the local real estate landscape.
- Houses represent a significant 23.8% portion, catering likely to families or larger groups.
- Smaller segments like apartment/condo (combined 4.8%) offer potential for unique stay experiences.
Lepanto Airbnb Room Capacity Analysis (2026): Bedroom Distribution
Distribution of Listings by Number of Bedrooms
Room Capacity Insights for Lepanto
- The dominant room capacity in Lepanto is 1 bedroom listings, making up 47.6% of the market. This suggests a strong demand for properties suitable for couples or solo travelers.
- Together, 1 bedroom and 2 bedrooms properties represent 76.2% of the active Airbnb listings in Lepanto, indicating a high concentration in these sizes.
Lepanto Vacation Rental Guest Capacity Trends (2026)
Distribution of Listings by Guest Capacity
Guest Capacity Insights for Lepanto
- The most common guest capacity trend in Lepanto vacation rentals is listings accommodating 4 guests (33.3%). This suggests the primary traveler segment is likely small families or groups.
- Properties designed for 4 guests and 6 guests dominate the Lepanto STR market, accounting for 47.6% of listings.
- 28.6% of properties accommodate 6+ guests, serving the market segment for larger families or group travel in Lepanto.
- On average, properties in Lepanto are equipped to host 4.6 guests.
Lepanto Airbnb Booking Patterns (2026): Available vs. Booked Days
Available Days Distribution
Booked Days Distribution
Booking Pattern Insights for Lepanto
- The most common availability pattern in Lepanto falls within the 271-366 days range, representing 100% of listings. This suggests many properties have significant open periods on their calendars.
- Approximately 100.0% of listings show high availability (181+ days open annually), indicating potential for increased bookings or specific owner usage patterns.
- For booked days, the 1-30 days range is most frequent in Lepanto (52.4%), reflecting common guest stay durations or potential owner blocking patterns.
Lepanto Airbnb Minimum Stay Requirements Analysis
Distribution of Listings by Minimum Night Requirement
1 Night
18 listings
85.7% of total
2 Nights
1 listings
4.8% of total
30+ Nights
2 listings
9.5% of total
Key Insights
- The most prevalent minimum stay requirement in Lepanto is 1 Night, adopted by 85.7% of listings. This highlights the market's preference for shorter, flexible bookings.
- A strong majority (90.5%) of the Lepanto Airbnb data shows acceptance of very short stays (1-2 nights), indicating a dynamic, high-turnover market.
Recommendations
- Align with the market by considering a 1 Night minimum stay, as 85.7% of Lepanto hosts use this setting.
- Explore offering discounts for stays of 30+ nights to attract the 9.5% of the market seeking extended stays.
- Adjust minimum nights based on seasonality – potentially shorter during low season and longer during peak demand periods in Lepanto.
Lepanto Airbnb Cancellation Policy Trends Analysis (2026)
Flexible
13 listings
61.9% of total
Moderate
5 listings
23.8% of total
Firm
3 listings
14.3% of total
Cancellation Policy Insights for Lepanto
- The prevailing Airbnb cancellation policy trend in Lepanto is Flexible, used by 61.9% of listings.
- The market strongly favors guest-friendly terms, with 85.7% of listings offering Flexible or Moderate policies. This suggests guests in Lepanto may expect booking flexibility.
Recommendations for Hosts
- Consider adopting a Flexible policy to align with the 61.9% market standard in Lepanto.
- Given the high prevalence of Flexible policies (61.9%), offering this can enhance booking appeal, especially during shoulder seasons.
- Regularly review your cancellation policy against competitors and market demand shifts in Lepanto.
Lepanto STR Booking Lead Time Analysis (2026)
Average Booking Lead Time by Month
Booking Lead Time Insights for Lepanto
- The overall average booking lead time for vacation rentals in Lepanto is 26 days.
- Guests book furthest in advance for stays during April (average 42 days), likely coinciding with peak travel demand or local events.
- The shortest booking windows occur for stays in October (average 1 days), indicating more last-minute travel plans during this time.
- Seasonally, Spring (31 days avg.) sees the longest lead times, while Fall (18 days avg.) has the shortest, reflecting typical travel planning cycles.
Recommendations for Hosts
- Use the overall average lead time (26 days) as a baseline for your pricing and availability strategy in Lepanto.
- For April stays, consider implementing length-of-stay discounts or slightly higher rates for bookings made less than 42 days out to capitalize on advance planning.
- During October, focus on last-minute booking availability and promotions, as guests book with very short notice (1 days avg.).
- Target marketing efforts for the Spring season well in advance (at least 31 days) to capture early planners.
- Monitor your own booking lead times against these Lepanto averages to identify opportunities for dynamic pricing adjustments.
Popular & Essential Airbnb Amenities in Lepanto (2026)
Amenity Prevalence
Amenity Insights for Lepanto
- Popular amenities like Bed linens, Dishes and silverware, Refrigerator are common but not universal. Offering these can provide a competitive edge.
- Warning: Wifi is not universally provided but is considered essential globally. Ensure reliable Wifi is offered.
Recommendations for Hosts
- Consider adding popular differentiators like Bed linens or Dishes and silverware to increase appeal.
- Highlight unique or less common amenities you offer (e.g., hot tub, dedicated workspace, EV charger) in your listing description and photos.
- Regularly check competitor amenities in Lepanto to stay competitive.
Lepanto Airbnb Guest Demographics & Profile Analysis (2026)
Guest Profile Summary for Lepanto
- The typical guest profile for Airbnb in Lepanto consists of a mix of domestic (43%) and international guests, with top international origins including United States, typically belonging to the Post-2000s (Gen Z/Alpha) group (50%), primarily speaking English or Spanish.
- Domestic travelers account for 42.9% of guests.
- Key international markets include Costa Rica (42.9%) and United States (16.3%).
- Top languages spoken are English (35.4%) followed by Spanish (32.3%).
- A significant demographic segment is the Post-2000s (Gen Z/Alpha) group, representing 50% of guests.
Recommendations for Hosts
- Balance marketing efforts between domestic and international channels based on the guest mix.
- Tailor amenities and listing descriptions to appeal to the dominant Post-2000s (Gen Z/Alpha) demographic (e.g., highlight fast WiFi, smart home features, local guides).
- Highlight unique local experiences or amenities relevant to the primary guest profile.
- Consider seasonal promotions aligned with peak travel times for key origin markets.
Nearby Short-Term Rental Market Comparison
How does the Lepanto Airbnb market stack up against its neighbors? Compare key performance metrics like average monthly revenue, ADR, and occupancy rates in surrounding areas to understand the broader regional STR landscape.
| Market | Active Properties | Monthly Revenue | Daily Rate | Avg. Occupancy |
|---|---|---|---|---|
| Nacascolo | 32 | $6,132 | $1145.14 | 33% |
| Pinilla | 91 | $4,982 | $544.03 | 35% |
| Playa Tamarindo | 21 | $4,869 | $404.48 | 44% |
| Playa Langosta | 163 | $4,380 | $474.00 | 39% |
| Punta Islita | 27 | $4,193 | $518.64 | 36% |
| Tamarindo | 1,302 | $3,897 | $386.82 | 41% |
| Cabo Velas | 922 | $3,316 | $381.01 | 38% |
| Playa Grande | 33 | $3,195 | $397.35 | 40% |
| Nosara | 873 | $3,169 | $421.13 | 39% |
| Tempate | 681 | $3,024 | $398.54 | 35% |