Caldera Airbnb Market Analysis 2026: Short Term Rental Data & Vacation Rental Statistics in Puntarenas Province, Costa Rica
Is Airbnb profitable in Caldera in 2026? Explore comprehensive Airbnb analytics for Caldera, Puntarenas Province, Costa Rica to uncover income potential. This 2026 STR market report for Caldera, based on AirROI data from February 2025 to January 2026, reveals key trends in the niche market of 36 active listings.
Whether you're considering an Airbnb investment in Caldera, optimizing your existing vacation rental, or exploring rental arbitrage opportunities, understanding the Caldera Airbnb data is crucial. Leveraging the low regulation environment is key to maximizing your short term rental income potential. Let's dive into the specifics.
Key Caldera Airbnb Performance Metrics Overview
Monthly Airbnb Revenue Variations & Income Potential in Caldera (2026)
Understanding the monthly revenue variations for Airbnb listings in Caldera is key to maximizing your short term rental income potential. Seasonality significantly impacts earnings. Our analysis, based on data from the past 12 months, shows that the peak revenue month for STRs in Caldera is typically February, while September often presents the lowest earnings, highlighting opportunities for strategic pricing adjustments during shoulder and low seasons. Explore the typical Airbnb income in Caldera across different performance tiers:
- Best-in-class properties (Top 10%) achieve $7,683+ monthly, often utilizing dynamic pricing and superior guest experiences.
- Strong performing properties (Top 25%) earn $4,612 or more, indicating effective management and desirable locations/amenities.
- Typical properties (Median) generate around $2,031 per month, representing the average market performance.
- Entry-level properties (Bottom 25%) see earnings around $866, often with potential for optimization.
Average Monthly Airbnb Earnings Trend in Caldera
Caldera Airbnb Occupancy Rate Trends (2026)
Maximize your bookings by understanding the Caldera STR occupancy trends. Seasonal demand shifts significantly influence how often properties are booked. Typically, Februarysees the highest demand (peak season occupancy), while September experiences the lowest (low season). Effective strategies, like adjusting minimum stays or offering promotions, can boost occupancy during slower periods. Here's how different property tiers perform in Caldera:
- Best-in-class properties (Top 10%) achieve 64%+ occupancy, indicating high desirability and potentially optimized availability.
- Strong performing properties (Top 25%) maintain 47% or higher occupancy, suggesting good market fit and guest satisfaction.
- Typical properties (Median) have an occupancy rate around 27%.
- Entry-level properties (Bottom 25%) average 15% occupancy, potentially facing higher vacancy.
Average Monthly Occupancy Rate Trend in Caldera
Average Daily Rate (ADR) Airbnb Trends in Caldera (2026)
Effective short term rental pricing strategy in Caldera involves understanding monthly ADR fluctuations. The Average Daily Rate (ADR) for Airbnb in Caldera typically peaks in April and dips lowest during October. Leveraging Airbnb dynamic pricing tools or strategies based on this seasonality can significantly boost revenue. Here's a look at the typical nightly rates achieved:
- Best-in-class properties (Top 10%) command rates of $504+ per night, often due to premium features or locations.
- Strong performing properties (Top 25%) achieve nightly rates of $314 or more.
- Typical properties (Median) charge around $239 per night.
- Entry-level properties (Bottom 25%) earn around $129 per night.
Average Daily Rate (ADR) Trend by Month in Caldera
Get Live Caldera Market Intelligence 👇

Explore Real-time Analytics
Airbnb Seasonality Analysis & Trends in Caldera (2026)
Peak Season (February, March, July)
- Revenue averages $4,729 per month
- Occupancy rates average 46.6%
- Daily rates average $258
Shoulder Season
- Revenue averages $3,352 per month
- Occupancy maintains around 32.0%
- Daily rates hold near $256
Low Season (September, October, November)
- Revenue drops to average $1,946 per month
- Occupancy decreases to average 21.4%
- Daily rates adjust to average $237
Seasonality Insights for Caldera
- The Airbnb seasonality in Caldera shows highly seasonal trends requiring careful strategy. While the sections above show seasonal averages, it's also insightful to look at the extremes:
- During the high season, the absolute peak month showcases Caldera's highest earning potential, with monthly revenues capable of climbing to $5,110, occupancy reaching a high of 54.2%, and ADRs peaking at $261.
- Conversely, the slowest single month of the year, typically falling within the low season, marks the market's lowest point. In this month, revenue might dip to $1,688, occupancy could drop to 17.9%, and ADRs may adjust down to $235.
- Understanding both the seasonal averages and these monthly peaks and troughs in revenue, occupancy, and ADR is crucial for maximizing your Airbnb profit potential in Caldera.
Seasonal Strategies for Maximizing Profit
- Peak Season: Maximize revenue through premium pricing and potentially longer minimum stays. Ensure high availability.
- Low Season: Offer competitive pricing, special promotions (e.g., extended stay discounts), and flexible cancellation policies. Target off-season travelers like remote workers or budget-conscious guests.
- Shoulder Seasons: Implement dynamic pricing that balances peak and low rates. Target weekend travelers or specific events. Offer slightly more flexible terms than peak season.
- Regularly analyze your own performance against these Caldera seasonality benchmarks and adjust your pricing and availability strategy accordingly.
Best Areas for Airbnb Investment in Caldera (2026)
Exploring the top neighborhoods for short-term rentals in Caldera? This section highlights key areas, outlining why they are attractive for hosts and guests, along with notable local attractions. Consider these locations based on your target guest profile and investment strategy.
| Neighborhood / Area | Why Host Here? (Target Guests & Appeal) | Key Attractions & Landmarks |
|---|---|---|
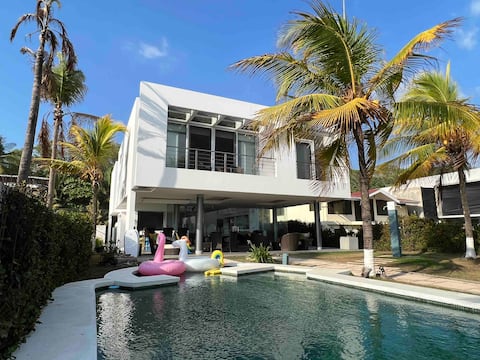
| Caldera Beach | Caldera Beach is known for its beautiful sandy shores and proximity to popular attractions. It's an ideal spot for tourists looking for relaxation and aquatic activities such as snorkeling and swimming. | Caldera Beach, Playa Mantas, Fishing trips, Water sports activities, Local seafood restaurants |
| Port Caldera | Port Caldera is a busy marina area with cruise ship connections and export activities. It's popular for those looking to explore local marine life and enjoy water-related activities. | Caldera Marina, Boat tours, Water taxi services, Fishing excursions |
| San Luis | San Luis offers a more local experience with access to nearby nature trails and wildlife. It's perfect for eco-tourists and those looking to experience the natural beauty of Costa Rica. | Hiking trails, Wildlife reserves, Natural hot springs, Bird watching |
| Punta Leona | Punta Leona is a well-known eco-resort area that attracts nature lovers and beachgoers. It's famous for its national park and stunning beaches, making it a desirable Airbnb market. | Punta Leona Beach, Carrara National Park, Wildlife encounters, Scenic viewpoints |
| Jacó | Jacó is a vibrant beach town known for its surf culture and nightlife. It's a hotspot for young travelers and surfers looking for adventure and entertainment. | Jacó Beach, Surfing lessons, Nightlife, Shopping |
| Manuel Antonio | Manuel Antonio is famous for its national park with diverse wildlife and beautiful beaches. It's ideal for tourists seeking adventure, relaxation, and stunning landscapes. | Manuel Antonio National Park, Beautiful beaches, Biodiversity tours, Adventure sports |
| Tortuga Island | Tortuga Island is known for its idyllic beaches and nature reserve. It's a perfect escape for tourists looking to enjoy water sports and pristine nature. | Snorkeling, Scuba diving, Island tours, Relaxation spots |
| Playa Hermosa | Playa Hermosa is known for its relaxing atmosphere and beautiful beach. It's suitable for families and travelers seeking a quieter beach experience. | Playa Hermosa Beach, Family-friendly resorts, Dining options, Scenic sunsets |
Understanding Airbnb License Requirements & STR Laws in Caldera (2026)
While Caldera, Puntarenas Province, Costa Rica currently shows low STR regulations, specific Airbnb license requirements might still exist or change. Always verify the latest short term rental regulations and Airbnb license requirements directly with local government authorities for Caldera to ensure full compliance before hosting.
(Source: AirROI data, 2026, based on 3% licensed listings)
Top Performing Airbnb Properties in Caldera (2026)
Benchmark your potential! Explore examples of top-performing Airbnb properties in Calderabased on Trailing Twelve Month (TTM) revenue. Analyze their characteristics, revenue, occupancy rate, and ADR to understand what drives success in this market.
The Sunset | Beachfront Villa
Entire Place • 6 bedrooms

Álamos Beachfront House
Entire Place • 6 bedrooms
Playa Tivives- Aslan’s Country
Entire Place • 3 bedrooms
Casa Álamos II Beachfront
Entire Place • 6 bedrooms
Beachfront House in Playa Tivives w/ private pool
Entire Place • 4 bedrooms
El Descanso: Beachfront house w/ pool and view
Entire Place • 4 bedrooms
Note: Performance varies based on location, size, amenities, seasonality, and management quality. Data reflects the past 12 months.
Top Performing Airbnb Hosts in Caldera (2026)
Learn from the best! This table showcases top-performing Airbnb hosts in Caldera based on the number of properties managed and estimated total revenue over the past year. Analyze their scale and performance metrics.
| Host Name | Properties | Grossing Revenue | Stay Reviews | Avg Rating |
|---|---|---|---|---|
| Tirzah | 9 | $199,706 | 101 | 4.85/5.0 |
| Edgar | 1 | $193,200 | 212 | 4.96/5.0 |
| Titi | 3 | $146,687 | 122 | 4.99/5.0 |
| Jose Alberto | 3 | $101,152 | 71 | 4.92/5.0 |
| Jorge | 1 | $76,964 | 117 | 4.79/5.0 |
| Bernardo | 1 | $57,074 | 141 | 4.93/5.0 |
| Maricarmen | 1 | $53,587 | 14 | 4.57/5.0 |
| Lucas | 1 | $42,155 | 38 | 4.66/5.0 |
| Giovanni | 1 | $36,697 | 207 | 4.96/5.0 |
| Amnon | 1 | $31,485 | 45 | 4.91/5.0 |
Analyzing the strategies of top hosts, such as their property selection, pricing, and guest communication, can offer valuable lessons for optimizing your own Airbnb operations in Caldera.
Dive Deeper: Advanced Caldera STR Market Data (2026)
Ready to unlock more insights? AirROI provides access to advanced metrics and comprehensive Airbnb data for Caldera. Explore detailed analytics beyond this report to refine your investment strategy, optimize pricing, and maximize your vacation rental profits.
Explore Advanced MetricsCaldera Short-Term Rental Market Composition (2026): Property & Room Types
Room Type Distribution
Property Type Distribution
Market Composition Insights for Caldera
- The Caldera Airbnb market composition is heavily skewed towards Entire Home/Apt listings, which make up 91.7% of the 36 active rentals. This indicates strong guest preference for privacy and space.
- Looking at the property type distribution in Caldera, House properties are the most common (88.9%), reflecting the local real estate landscape.
- Houses represent a significant 88.9% portion, catering likely to families or larger groups.
- The presence of 8.3% Hotel/Boutique listings indicates integration with traditional hospitality.
- Smaller segments like unique stays (combined 2.8%) offer potential for unique stay experiences.
Caldera Airbnb Room Capacity Analysis (2026): Bedroom Distribution
Distribution of Listings by Number of Bedrooms
Room Capacity Insights for Caldera
- The dominant room capacity in Caldera is 3 bedrooms listings, making up 38.9% of the market. This suggests a strong demand for properties suitable for families or small groups.
- Together, 3 bedrooms and 4 bedrooms properties represent 61.1% of the active Airbnb listings in Caldera, indicating a high concentration in these sizes.
- A significant 72.2% of listings offer 3+ bedrooms, catering to larger groups and families seeking more space in Caldera.
Caldera Vacation Rental Guest Capacity Trends (2026)
Distribution of Listings by Guest Capacity
Guest Capacity Insights for Caldera
- The most common guest capacity trend in Caldera vacation rentals is listings accommodating 8+ guests (47.2%). This suggests the primary traveler segment is likely larger groups.
- Properties designed for 8+ guests and 7 guests dominate the Caldera STR market, accounting for 63.9% of listings.
- 77.8% of properties accommodate 6+ guests, serving the market segment for larger families or group travel in Caldera.
- On average, properties in Caldera are equipped to host 6.7 guests.
Caldera Airbnb Booking Patterns (2026): Available vs. Booked Days
Available Days Distribution
Booked Days Distribution
Booking Pattern Insights for Caldera
- The most common availability pattern in Caldera falls within the 271-366 days range, representing 61.1% of listings. This suggests many properties have significant open periods on their calendars.
- Approximately 88.9% of listings show high availability (181+ days open annually), indicating potential for increased bookings or specific owner usage patterns.
- For booked days, the 31-90 days range is most frequent in Caldera (41.7%), reflecting common guest stay durations or potential owner blocking patterns.
- A notable 11.1% of properties secure long booking periods (181+ days booked per year), highlighting successful long-term rental strategies or significant owner usage.
Caldera Airbnb Minimum Stay Requirements Analysis
Distribution of Listings by Minimum Night Requirement
1 Night
4 listings
11.1% of total
2 Nights
20 listings
55.6% of total
7-29 Nights
2 listings
5.6% of total
30+ Nights
10 listings
27.8% of total
Key Insights
- The most prevalent minimum stay requirement in Caldera is 2 Nights, adopted by 55.6% of listings. This highlights the market's preference for shorter, flexible bookings.
- A strong majority (66.7%) of the Caldera Airbnb data shows acceptance of very short stays (1-2 nights), indicating a dynamic, high-turnover market.
- A significant segment (27.8%) caters to monthly stays (30+ nights) in Caldera, pointing to opportunities in the extended-stay market.
Recommendations
- Align with the market by considering a 2 Nights minimum stay, as 55.6% of Caldera hosts use this setting.
- If feasible, allowing 1-night stays, especially midweek or during low season, could capture last-minute bookings, as only 11.1% currently do.
- A 2-night minimum appears standard (55.6%). Consider this for weekends or peak periods.
- Explore offering discounts for stays of 30+ nights to attract the 27.8% of the market seeking extended stays.
- Adjust minimum nights based on seasonality – potentially shorter during low season and longer during peak demand periods in Caldera.
Caldera Airbnb Cancellation Policy Trends Analysis (2026)
Super Strict 30 Days
1 listings
2.8% of total
Flexible
4 listings
11.1% of total
Moderate
2 listings
5.6% of total
Firm
12 listings
33.3% of total
Strict
17 listings
47.2% of total
Cancellation Policy Insights for Caldera
- The prevailing Airbnb cancellation policy trend in Caldera is Strict, used by 47.2% of listings.
- A majority (80.5%) of hosts in Caldera utilize Firm or Strict policies, indicating a market where hosts prioritize booking security.
Recommendations for Hosts
- Consider adopting a Strict policy to align with the 47.2% market standard in Caldera.
- With 47.2% using Strict terms, this is a viable option in Caldera, particularly for high-value properties or during peak demand periods.
- Regularly review your cancellation policy against competitors and market demand shifts in Caldera.
Caldera STR Booking Lead Time Analysis (2026)
Average Booking Lead Time by Month
Booking Lead Time Insights for Caldera
- The overall average booking lead time for vacation rentals in Caldera is 43 days.
- Guests book furthest in advance for stays during December (average 90 days), likely coinciding with peak travel demand or local events.
- The shortest booking windows occur for stays in September (average 13 days), indicating more last-minute travel plans during this time.
- Seasonally, Winter (73 days avg.) sees the longest lead times, while Fall (29 days avg.) has the shortest, reflecting typical travel planning cycles.
Recommendations for Hosts
- Use the overall average lead time (43 days) as a baseline for your pricing and availability strategy in Caldera.
- For December stays, consider implementing length-of-stay discounts or slightly higher rates for bookings made less than 90 days out to capitalize on advance planning.
- During September, focus on last-minute booking availability and promotions, as guests book with very short notice (13 days avg.).
- Target marketing efforts for the Winter season well in advance (at least 73 days) to capture early planners.
- Monitor your own booking lead times against these Caldera averages to identify opportunities for dynamic pricing adjustments.
Popular & Essential Airbnb Amenities in Caldera (2026)
Amenity Prevalence
Amenity Insights for Caldera
- Essential amenities in Caldera that guests expect include: Free parking on premises, Wifi, Pool, Kitchen, Air conditioning. Lacking these (any) could significantly impact bookings.
- Popular amenities like Outdoor shower, TV, Beach access are common but not universal. Offering these can provide a competitive edge.
Recommendations for Hosts
- Ensure your listing includes all essential amenities for Caldera: Free parking on premises, Wifi, Pool, Kitchen, Air conditioning.
- Prioritize adding missing essentials: Kitchen, Air conditioning.
- Consider adding popular differentiators like Outdoor shower or TV to increase appeal.
- Highlight unique or less common amenities you offer (e.g., hot tub, dedicated workspace, EV charger) in your listing description and photos.
- Regularly check competitor amenities in Caldera to stay competitive.
Caldera Airbnb Guest Demographics & Profile Analysis (2026)
Guest Profile Summary for Caldera
- The typical guest profile for Airbnb in Caldera consists of predominantly international visitors (66%), with top international origins including Costa Rica, typically belonging to the Post-2000s (Gen Z/Alpha) group (50%), primarily speaking English or Spanish.
- Domestic travelers account for 33.8% of guests.
- Key international markets include United States (50%) and Costa Rica (33.8%).
- Top languages spoken are English (50%) followed by Spanish (34.3%).
- A significant demographic segment is the Post-2000s (Gen Z/Alpha) group, representing 50% of guests.
Recommendations for Hosts
- Focus marketing internationally, particularly towards travelers from Costa Rica.
- Tailor amenities and listing descriptions to appeal to the dominant Post-2000s (Gen Z/Alpha) demographic (e.g., highlight fast WiFi, smart home features, local guides).
- Highlight unique local experiences or amenities relevant to the primary guest profile.
- Consider seasonal promotions aligned with peak travel times for key origin markets.
Nearby Short-Term Rental Market Comparison
How does the Caldera Airbnb market stack up against its neighbors? Compare key performance metrics like average monthly revenue, ADR, and occupancy rates in surrounding areas to understand the broader regional STR landscape.
| Market | Active Properties | Monthly Revenue | Daily Rate | Avg. Occupancy |
|---|---|---|---|---|
| Nacascolo | 32 | $6,132 | $1145.14 | 33% |
| Pinilla | 91 | $4,982 | $544.03 | 35% |
| Playa Tamarindo | 21 | $4,869 | $404.48 | 44% |
| Playa Langosta | 163 | $4,380 | $474.00 | 39% |
| Punta Islita | 27 | $4,193 | $518.64 | 36% |
| Tamarindo | 1,302 | $3,897 | $386.82 | 41% |
| Osa | 10 | $3,418 | $586.45 | 32% |
| Cabo Velas | 922 | $3,316 | $381.01 | 38% |
| Playa Grande | 33 | $3,195 | $397.35 | 40% |
| Nosara | 873 | $3,169 | $421.13 | 39% |