Bahía Drake Airbnb Market Analysis 2026: Short Term Rental Data & Vacation Rental Statistics in Puntarenas Province, Costa Rica
Is Airbnb profitable in Bahía Drake in 2026? Explore comprehensive Airbnb analytics for Bahía Drake, Puntarenas Province, Costa Rica to uncover income potential. This 2026 STR market report for Bahía Drake, based on AirROI data from February 2025 to January 2026, reveals key trends in the niche market of 170 active listings.
Whether you're considering an Airbnb investment in Bahía Drake, optimizing your existing vacation rental, or exploring rental arbitrage opportunities, understanding the Bahía Drake Airbnb data is crucial. Leveraging the low regulation environment is key to maximizing your short term rental income potential. Let's dive into the specifics.
Key Bahía Drake Airbnb Performance Metrics Overview
Monthly Airbnb Revenue Variations & Income Potential in Bahía Drake (2026)
Understanding the monthly revenue variations for Airbnb listings in Bahía Drake is key to maximizing your short term rental income potential. Seasonality significantly impacts earnings. Our analysis, based on data from the past 12 months, shows that the peak revenue month for STRs in Bahía Drake is typically February, while September often presents the lowest earnings, highlighting opportunities for strategic pricing adjustments during shoulder and low seasons. Explore the typical Airbnb income in Bahía Drake across different performance tiers:
- Best-in-class properties (Top 10%) achieve $3,373+ monthly, often utilizing dynamic pricing and superior guest experiences.
- Strong performing properties (Top 25%) earn $1,751 or more, indicating effective management and desirable locations/amenities.
- Typical properties (Median) generate around $686 per month, representing the average market performance.
- Entry-level properties (Bottom 25%) see earnings around $267, often with potential for optimization.
Average Monthly Airbnb Earnings Trend in Bahía Drake
Bahía Drake Airbnb Occupancy Rate Trends (2026)
Maximize your bookings by understanding the Bahía Drake STR occupancy trends. Seasonal demand shifts significantly influence how often properties are booked. Typically, Februarysees the highest demand (peak season occupancy), while September experiences the lowest (low season). Effective strategies, like adjusting minimum stays or offering promotions, can boost occupancy during slower periods. Here's how different property tiers perform in Bahía Drake:
- Best-in-class properties (Top 10%) achieve 67%+ occupancy, indicating high desirability and potentially optimized availability.
- Strong performing properties (Top 25%) maintain 47% or higher occupancy, suggesting good market fit and guest satisfaction.
- Typical properties (Median) have an occupancy rate around 27%.
- Entry-level properties (Bottom 25%) average 13% occupancy, potentially facing higher vacancy.
Average Monthly Occupancy Rate Trend in Bahía Drake
Average Daily Rate (ADR) Airbnb Trends in Bahía Drake (2026)
Effective short term rental pricing strategy in Bahía Drake involves understanding monthly ADR fluctuations. The Average Daily Rate (ADR) for Airbnb in Bahía Drake typically peaks in January and dips lowest during October. Leveraging Airbnb dynamic pricing tools or strategies based on this seasonality can significantly boost revenue. Here's a look at the typical nightly rates achieved:
- Best-in-class properties (Top 10%) command rates of $208+ per night, often due to premium features or locations.
- Strong performing properties (Top 25%) achieve nightly rates of $133 or more.
- Typical properties (Median) charge around $72 per night.
- Entry-level properties (Bottom 25%) earn around $45 per night.
Average Daily Rate (ADR) Trend by Month in Bahía Drake
Get Live Bahía Drake Market Intelligence 👇

Explore Real-time Analytics
Airbnb Seasonality Analysis & Trends in Bahía Drake (2026)
Peak Season (February, March, January)
- Revenue averages $1,676 per month
- Occupancy rates average 41.5%
- Daily rates average $113
Shoulder Season
- Revenue averages $1,282 per month
- Occupancy maintains around 30.7%
- Daily rates hold near $107
Low Season (May, September, November)
- Revenue drops to average $997 per month
- Occupancy decreases to average 26.9%
- Daily rates adjust to average $103
Seasonality Insights for Bahía Drake
- The Airbnb seasonality in Bahía Drake shows highly seasonal trends requiring careful strategy. While the sections above show seasonal averages, it's also insightful to look at the extremes:
- During the high season, the absolute peak month showcases Bahía Drake's highest earning potential, with monthly revenues capable of climbing to $1,879, occupancy reaching a high of 49.4%, and ADRs peaking at $115.
- Conversely, the slowest single month of the year, typically falling within the low season, marks the market's lowest point. In this month, revenue might dip to $822, occupancy could drop to 23.2%, and ADRs may adjust down to $98.
- Understanding both the seasonal averages and these monthly peaks and troughs in revenue, occupancy, and ADR is crucial for maximizing your Airbnb profit potential in Bahía Drake.
Seasonal Strategies for Maximizing Profit
- Peak Season: Maximize revenue through premium pricing and potentially longer minimum stays. Ensure high availability.
- Low Season: Offer competitive pricing, special promotions (e.g., extended stay discounts), and flexible cancellation policies. Target off-season travelers like remote workers or budget-conscious guests.
- Shoulder Seasons: Implement dynamic pricing that balances peak and low rates. Target weekend travelers or specific events. Offer slightly more flexible terms than peak season.
- Regularly analyze your own performance against these Bahía Drake seasonality benchmarks and adjust your pricing and availability strategy accordingly.
Best Areas for Airbnb Investment in Bahía Drake (2026)
Exploring the top neighborhoods for short-term rentals in Bahía Drake? This section highlights key areas, outlining why they are attractive for hosts and guests, along with notable local attractions. Consider these locations based on your target guest profile and investment strategy.
| Neighborhood / Area | Why Host Here? (Target Guests & Appeal) | Key Attractions & Landmarks |
|---|---|---|
| Bahía Drake | A picturesque coastal village surrounded by lush rainforest and marine reserves, making it a prime destination for ecotourism and adventure activities. | Corcovado National Park, Caño Island, drone tours, snorkeling and diving spots, wildlife watching, beach activities |
| La Palma | An emerging area for tourists looking to explore the pristine beaches and natural beauty of the Osa Peninsula, popular among nature lovers and eco-conscious travelers. | Playa Cacao, local trails, community cultural experiences, nature tours, wildlife refuges, beachfront dining |
| Rancho Quemado | A rural area close to Bahía Drake, offering a quiet getaway with opportunities for hiking and experiencing authentic Costa Rican culture. | hiking trails, local farms, community tours, cultural festivals, farm-to-table dining, tranquil landscapes |
| El Tigre | Known for its rugged beauty and access to secluded beaches, this area appeals to adventurous travelers seeking off-the-beaten-path experiences. | Playa San Josecito, Kayaking, Camping spots, Remote hiking trails, Wildlife reserves, local artisan markets |
| Puerto Jiménez | A charming town that serves as a gateway to the Osa Peninsula, attracting visitors looking for eco-adventures and a lively town atmosphere. | Corcovado National Park, Puerto Jiménez beach, local markets, fishing tours, wildlife tours, sustainable practices |
| Puntarenas | The gateway to various coastal attractions and a point of departure for boat excursions, making it a strategic location for tourism. | beachfront access, boat tours, local seafood markets, national park access, maritime activities, cultural festivals |
| Sierpe | A quaint village surrounded by mangroves, offering access to beautiful rivers and the nearby Corcovado National Park, perfect for eco-tourism enthusiasts. | Sierpe River, mangrove tours, wildlife viewing, boat excursions to Corcovado, eco lodges, local restaurants |
| Drake Bay | Famed for its stunning beaches and proximity to national parks, it’s a hot spot for nature tourists looking to immerse themselves in Costa Rica's biodiversity. | Playa Rio Claro, Corcovado tours, dolphin and whale watching, snorkeling trips, local artisanal shops, beachside relaxation |
Understanding Airbnb License Requirements & STR Laws in Bahía Drake (2026)
While Bahía Drake, Puntarenas Province, Costa Rica currently shows low STR regulations, specific Airbnb license requirements might still exist or change. Always verify the latest short term rental regulations and Airbnb license requirements directly with local government authorities for Bahía Drake to ensure full compliance before hosting.
(Source: AirROI data, 2026, finding no licensed listings among those analyzed)
Top Performing Airbnb Properties in Bahía Drake (2026)
Benchmark your potential! Explore examples of top-performing Airbnb properties in Bahía Drakebased on Trailing Twelve Month (TTM) revenue. Analyze their characteristics, revenue, occupancy rate, and ADR to understand what drives success in this market.
Equipped house with panoramic view of the bay
Entire Place • 4 bedrooms

Luxury ocean view, infinity pool, b/fast, eve meal
Entire Place • 2 bedrooms

Eden Corcovado - Bromelia House
Entire Place • 1 bedroom

Deluxe Bungalow with Ocean View & Jacuzzi•Aracari
Private Room • 1 bedroom
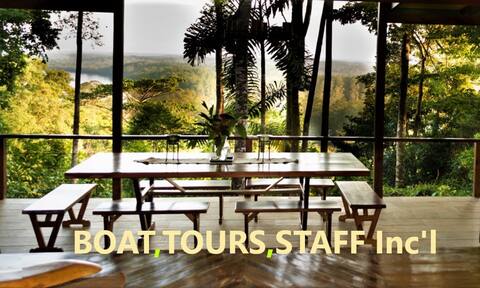
Boat, Tours & Staff Incl: Casa Rio Sierpe (Sierpe River House)
Entire Place • 2 bedrooms

Family Apartment with Ocean View • Ara Macao
Entire Place • 2 bedrooms
Note: Performance varies based on location, size, amenities, seasonality, and management quality. Data reflects the past 12 months.
Top Performing Airbnb Hosts in Bahía Drake (2026)
Learn from the best! This table showcases top-performing Airbnb hosts in Bahía Drake based on the number of properties managed and estimated total revenue over the past year. Analyze their scale and performance metrics.
| Host Name | Properties | Grossing Revenue | Stay Reviews | Avg Rating |
|---|---|---|---|---|
| Costa Rica | 10 | $295,513 | 432 | 4.84/5.0 |
| Susannah | 5 | $201,543 | 72 | 4.99/5.0 |
| Casa Horizontes Corcovado | 4 | $88,314 | 73 | 4.86/5.0 |
| Susana | 6 | $74,723 | 139 | 4.89/5.0 |
| Leonidas | 3 | $63,291 | 91 | 4.79/5.0 |
| Debra | 2 | $61,075 | 270 | 4.78/5.0 |
| Karin Dayana | 1 | $57,583 | 46 | 4.96/5.0 |
| Raquel | 2 | $55,309 | 110 | 4.92/5.0 |
| Teresa | 7 | $51,783 | 136 | 4.89/5.0 |
| Mark | 1 | $51,368 | 39 | 4.97/5.0 |
Analyzing the strategies of top hosts, such as their property selection, pricing, and guest communication, can offer valuable lessons for optimizing your own Airbnb operations in Bahía Drake.
Dive Deeper: Advanced Bahía Drake STR Market Data (2026)
Ready to unlock more insights? AirROI provides access to advanced metrics and comprehensive Airbnb data for Bahía Drake. Explore detailed analytics beyond this report to refine your investment strategy, optimize pricing, and maximize your vacation rental profits.
Explore Advanced MetricsBahía Drake Short-Term Rental Market Composition (2026): Property & Room Types
Room Type Distribution
Property Type Distribution
Market Composition Insights for Bahía Drake
- The Bahía Drake Airbnb market composition is heavily skewed towards Private Room listings, which make up 52.4% of the 170 active rentals. This indicates strong guest preference for privacy and space.
- Looking at the property type distribution in Bahía Drake, House properties are the most common (31.2%), reflecting the local real estate landscape.
- Houses represent a significant 31.2% portion, catering likely to families or larger groups.
- The presence of 24.1% Hotel/Boutique listings indicates integration with traditional hospitality.
- Smaller segments like others, unique stays (combined 1.2%) offer potential for unique stay experiences.
Bahía Drake Airbnb Room Capacity Analysis (2026): Bedroom Distribution
Distribution of Listings by Number of Bedrooms
Room Capacity Insights for Bahía Drake
- The dominant room capacity in Bahía Drake is 1 bedroom listings, making up 58.8% of the market. This suggests a strong demand for properties suitable for couples or solo travelers.
- Together, 1 bedroom and 2 bedrooms properties represent 74.1% of the active Airbnb listings in Bahía Drake, indicating a high concentration in these sizes.
- With over half the market (58.8%) consisting of studios or 1-bedroom units, Bahía Drake is particularly well-suited for individuals or couples.
- Listings with 3+ bedrooms (5.9%) represent a smaller niche, potentially indicating an underserved market for larger group accommodations in Bahía Drake.
Bahía Drake Vacation Rental Guest Capacity Trends (2026)
Distribution of Listings by Guest Capacity
Guest Capacity Insights for Bahía Drake
- The most common guest capacity trend in Bahía Drake vacation rentals is listings accommodating 4 guests (25.9%). This suggests the primary traveler segment is likely small families or groups.
- Properties designed for 4 guests and 2 guests dominate the Bahía Drake STR market, accounting for 47.7% of listings.
- On average, properties in Bahía Drake are equipped to host 2.8 guests.
Bahía Drake Airbnb Booking Patterns (2026): Available vs. Booked Days
Available Days Distribution
Booked Days Distribution
Booking Pattern Insights for Bahía Drake
- The most common availability pattern in Bahía Drake falls within the 271-366 days range, representing 64.7% of listings. This suggests many properties have significant open periods on their calendars.
- Approximately 93.5% of listings show high availability (181+ days open annually), indicating potential for increased bookings or specific owner usage patterns.
- For booked days, the 31-90 days range is most frequent in Bahía Drake (32.4%), reflecting common guest stay durations or potential owner blocking patterns.
- A notable 7.7% of properties secure long booking periods (181+ days booked per year), highlighting successful long-term rental strategies or significant owner usage.
Bahía Drake Airbnb Minimum Stay Requirements Analysis
Distribution of Listings by Minimum Night Requirement
1 Night
86 listings
50.6% of total
2 Nights
37 listings
21.8% of total
3 Nights
5 listings
2.9% of total
30+ Nights
42 listings
24.7% of total
Key Insights
- The most prevalent minimum stay requirement in Bahía Drake is 1 Night, adopted by 50.6% of listings. This highlights the market's preference for shorter, flexible bookings.
- A strong majority (72.4%) of the Bahía Drake Airbnb data shows acceptance of very short stays (1-2 nights), indicating a dynamic, high-turnover market.
- A significant segment (24.7%) caters to monthly stays (30+ nights) in Bahía Drake, pointing to opportunities in the extended-stay market.
Recommendations
- Align with the market by considering a 1 Night minimum stay, as 50.6% of Bahía Drake hosts use this setting.
- Explore offering discounts for stays of 30+ nights to attract the 24.7% of the market seeking extended stays.
- Adjust minimum nights based on seasonality – potentially shorter during low season and longer during peak demand periods in Bahía Drake.
Bahía Drake Airbnb Cancellation Policy Trends Analysis (2026)
Super Strict 60 Days
2 listings
1.2% of total
Super Strict 30 Days
12 listings
7.1% of total
Limited
5 listings
2.9% of total
Flexible
58 listings
34.1% of total
Moderate
29 listings
17.1% of total
Firm
51 listings
30% of total
Strict
13 listings
7.6% of total
Cancellation Policy Insights for Bahía Drake
- The prevailing Airbnb cancellation policy trend in Bahía Drake is Flexible, used by 34.1% of listings.
- There's a relatively balanced mix between guest-friendly (51.2%) and stricter (37.6%) policies, offering choices for different guest needs.
- Strict cancellation policies are quite rare (7.6%), potentially making listings with this policy less competitive unless justified by high demand or property type.
Recommendations for Hosts
- Consider adopting a Flexible policy to align with the 34.1% market standard in Bahía Drake.
- Using a Strict policy might deter some guests, as only 7.6% of listings use it. Evaluate if potential revenue protection outweighs possible lower booking rates.
- Regularly review your cancellation policy against competitors and market demand shifts in Bahía Drake.
Bahía Drake STR Booking Lead Time Analysis (2026)
Average Booking Lead Time by Month
Booking Lead Time Insights for Bahía Drake
- The overall average booking lead time for vacation rentals in Bahía Drake is 61 days.
- Guests book furthest in advance for stays during December (average 82 days), likely coinciding with peak travel demand or local events.
- The shortest booking windows occur for stays in June (average 38 days), indicating more last-minute travel plans during this time.
- Seasonally, Winter (76 days avg.) sees the longest lead times, while Spring (52 days avg.) has the shortest, reflecting typical travel planning cycles.
Recommendations for Hosts
- Use the overall average lead time (61 days) as a baseline for your pricing and availability strategy in Bahía Drake.
- For December stays, consider implementing length-of-stay discounts or slightly higher rates for bookings made less than 82 days out to capitalize on advance planning.
- Target marketing efforts for the Winter season well in advance (at least 76 days) to capture early planners.
- Monitor your own booking lead times against these Bahía Drake averages to identify opportunities for dynamic pricing adjustments.
Popular & Essential Airbnb Amenities in Bahía Drake (2026)
Amenity Prevalence
Amenity Insights for Bahía Drake
- Essential amenities in Bahía Drake that guests expect include: Wifi. Lacking these (this) could significantly impact bookings.
- Popular amenities like Free parking on premises, Essentials, Patio or balcony are common but not universal. Offering these can provide a competitive edge.
Recommendations for Hosts
- Ensure your listing includes all essential amenities for Bahía Drake: Wifi.
- Prioritize adding missing essentials: Wifi.
- Consider adding popular differentiators like Free parking on premises or Essentials to increase appeal.
- Highlight unique or less common amenities you offer (e.g., hot tub, dedicated workspace, EV charger) in your listing description and photos.
- Regularly check competitor amenities in Bahía Drake to stay competitive.
Bahía Drake Airbnb Guest Demographics & Profile Analysis (2026)
Guest Profile Summary for Bahía Drake
- The typical guest profile for Airbnb in Bahía Drake consists of predominantly international visitors (96%), with top international origins including Germany, typically belonging to the Post-2000s (Gen Z/Alpha) group (50%), primarily speaking English or Spanish.
- Domestic travelers account for 4.5% of guests.
- Key international markets include United States (31.2%) and Germany (15.1%).
- Top languages spoken are English (43.3%) followed by Spanish (17.3%).
- A significant demographic segment is the Post-2000s (Gen Z/Alpha) group, representing 50% of guests.
Recommendations for Hosts
- Focus marketing internationally, particularly towards travelers from Germany.
- Tailor amenities and listing descriptions to appeal to the dominant Post-2000s (Gen Z/Alpha) demographic (e.g., highlight fast WiFi, smart home features, local guides).
- Highlight unique local experiences or amenities relevant to the primary guest profile.
- Consider seasonal promotions aligned with peak travel times for key origin markets.
Nearby Short-Term Rental Market Comparison
How does the Bahía Drake Airbnb market stack up against its neighbors? Compare key performance metrics like average monthly revenue, ADR, and occupancy rates in surrounding areas to understand the broader regional STR landscape.
| Market | Active Properties | Monthly Revenue | Daily Rate | Avg. Occupancy |
|---|---|---|---|---|
| Osa | 10 | $3,418 | $586.45 | 32% |
| Savegre de Aguirre | 15 | $2,740 | $372.47 | 36% |
| Quepos | 1,172 | $2,594 | $246.50 | 39% |
| Caldera | 36 | $2,490 | $270.58 | 33% |
| Jacó | 2,135 | $2,188 | $296.12 | 33% |
| Savegre | 186 | $2,150 | $256.31 | 34% |
| Bahía Ballena | 1,282 | $2,099 | $237.59 | 37% |
| Tárcoles | 294 | $1,978 | $253.51 | 30% |
| El Roble | 22 | $1,805 | $219.87 | 32% |
| Parrita | 552 | $1,561 | $213.28 | 31% |