Puntarenas Airbnb Market Analysis 2025: Short Term Rental Data & Vacation Rental Statistics in Provincia de Puntarenas, Costa Rica
Is Airbnb profitable in Puntarenas in 2025? Explore comprehensive Airbnb analytics for Puntarenas, Provincia de Puntarenas, Costa Rica to uncover income potential. This 2025 STR market report for Puntarenas, based on AirROI data from December 2024 to November 2025, reveals key trends in the niche market of 31 active listings.
Whether you're considering an Airbnb investment in Puntarenas, optimizing your existing vacation rental, or exploring rental arbitrage opportunities, understanding the Puntarenas Airbnb data is crucial. Leveraging the low regulation environment is key to maximizing your short term rental income potential. Let's dive into the specifics.
Key Puntarenas Airbnb Performance Metrics Overview
Monthly Airbnb Revenue Variations & Income Potential in Puntarenas (2025)
Understanding the monthly revenue variations for Airbnb listings in Puntarenas is key to maximizing your short term rental income potential. Seasonality significantly impacts earnings. Our analysis, based on data from the past 12 months, shows that the peak revenue month for STRs in Puntarenas is typically September, while May often presents the lowest earnings, highlighting opportunities for strategic pricing adjustments during shoulder and low seasons. Explore the typical Airbnb income in Puntarenas across different performance tiers:
- Best-in-class properties (Top 10%) achieve $3,473+ monthly, often utilizing dynamic pricing and superior guest experiences.
- Strong performing properties (Top 25%) earn $1,689 or more, indicating effective management and desirable locations/amenities.
- Typical properties (Median) generate around $631 per month, representing the average market performance.
- Entry-level properties (Bottom 25%) see earnings around $351, often with potential for optimization.
Average Monthly Airbnb Earnings Trend in Puntarenas
Puntarenas Airbnb Occupancy Rate Trends (2025)
Maximize your bookings by understanding the Puntarenas STR occupancy trends. Seasonal demand shifts significantly influence how often properties are booked. Typically, Augustsees the highest demand (peak season occupancy), while May experiences the lowest (low season). Effective strategies, like adjusting minimum stays or offering promotions, can boost occupancy during slower periods. Here's how different property tiers perform in Puntarenas:
- Best-in-class properties (Top 10%) achieve 65%+ occupancy, indicating high desirability and potentially optimized availability.
- Strong performing properties (Top 25%) maintain 42% or higher occupancy, suggesting good market fit and guest satisfaction.
- Typical properties (Median) have an occupancy rate around 25%.
- Entry-level properties (Bottom 25%) average 12% occupancy, potentially facing higher vacancy.
Average Monthly Occupancy Rate Trend in Puntarenas
Average Daily Rate (ADR) Airbnb Trends in Puntarenas (2025)
Effective short term rental pricing strategy in Puntarenas involves understanding monthly ADR fluctuations. The Average Daily Rate (ADR) for Airbnb in Puntarenas typically peaks in November and dips lowest during June. Leveraging Airbnb dynamic pricing tools or strategies based on this seasonality can significantly boost revenue. Here's a look at the typical nightly rates achieved:
- Best-in-class properties (Top 10%) command rates of $286+ per night, often due to premium features or locations.
- Strong performing properties (Top 25%) achieve nightly rates of $176 or more.
- Typical properties (Median) charge around $108 per night.
- Entry-level properties (Bottom 25%) earn around $77 per night.
Average Daily Rate (ADR) Trend by Month in Puntarenas
Get Live Puntarenas Market Intelligence 👇
Explore Real-time Analytics
Airbnb Seasonality Analysis & Trends in Puntarenas (2025)
Peak Season (September, July, August)
- Revenue averages $1,716 per month
- Occupancy rates average 34.5%
- Daily rates average $158
Shoulder Season
- Revenue averages $746 per month
- Occupancy maintains around 18.0%
- Daily rates hold near $150
Low Season (March, April, December)
- Revenue drops to average $0 per month
- Occupancy decreases to average 0.0%
- Daily rates adjust to average $139
Seasonality Insights for Puntarenas
- The Airbnb seasonality in Puntarenas shows highly seasonal trends requiring careful strategy. While the sections above show seasonal averages, it's also insightful to look at the extremes:
- During the high season, the absolute peak month showcases Puntarenas's highest earning potential, with monthly revenues capable of climbing to $1,776, occupancy reaching a high of 36.5%, and ADRs peaking at $179.
- Conversely, the slowest single month of the year, typically falling within the low season, marks the market's lowest point. In this month, revenue might dip to $0, occupancy could drop to 0.0%, and ADRs may adjust down to $136.
- Understanding both the seasonal averages and these monthly peaks and troughs in revenue, occupancy, and ADR is crucial for maximizing your Airbnb profit potential in Puntarenas.
Seasonal Strategies for Maximizing Profit
- Peak Season: Maximize revenue through premium pricing and potentially longer minimum stays. Ensure high availability.
- Low Season: Offer competitive pricing, special promotions (e.g., extended stay discounts), and flexible cancellation policies. Target off-season travelers like remote workers or budget-conscious guests.
- Shoulder Seasons: Implement dynamic pricing that balances peak and low rates. Target weekend travelers or specific events. Offer slightly more flexible terms than peak season.
- Regularly analyze your own performance against these Puntarenas seasonality benchmarks and adjust your pricing and availability strategy accordingly.
Best Areas for Airbnb Investment in Puntarenas (2025)
Exploring the top neighborhoods for short-term rentals in Puntarenas? This section highlights key areas, outlining why they are attractive for hosts and guests, along with notable local attractions. Consider these locations based on your target guest profile and investment strategy.
| Neighborhood / Area | Why Host Here? (Target Guests & Appeal) | Key Attractions & Landmarks |
|---|---|---|
| Jacó Beach | Popular surf town known for its vibrant nightlife and stunning beaches. Ideal for tourists seeking adventure and relaxation with plenty of outdoor activities like surfing and hiking. | Jacó Beach, Carara National Park, Rainforest Adventures, Jaco Walk, Hermosa Beach, Los Sueños Marina |
| Manuel Antonio | Famous for its national park, beautiful beaches, and diverse wildlife. Attracts nature lovers and adventure seekers eager to explore pristine environments and relax by the ocean. | Manuel Antonio National Park, Manuel Antonio Beach, Espadilla Beach, Quepos, Rainmaker Park, Río Naranjo |
| Uvita | Home to the stunning Marino Ballena National Park, known for its whale tail beach and eco-tourism opportunities. Perfect for visitors interested in marine life and natural beauty. | Marino Ballena National Park, Uvita Beach, Whale Tail Beach, Alturas Wildlife Sanctuary, Osa Wildlife Sanctuary, Rincon de Osa |
| Dominical | A laid-back beach town favored by surfers and eco-tourists, offering beautiful landscapes and a relaxed atmosphere. Great for visitors looking for tranquility and adventure. | Dominical Beach, Nauyaca Waterfalls, Parque Reptilandia, Whale watching tours, Dominicalito Beach, Marino Ballena National Park |
| Golfito | Known for its beautiful bay and access to Corcovado National Park. Popular among eco-tourists looking to explore the rich biodiversity of Costa Rica. | Golfito Marina, Corcovado National Park, Pájaros Island, Playa Cacao, Las Escobas Beach, Golfito National Wildlife Refuge |
| Ojochal | A hidden gem on the southern Pacific coast, known for its gastronomy and relaxed vibe. Attracts foodies and those seeking a quieter beach experience. | Playa Ventanas, Cascadas de Uvita, Ojochal Beach, Ranchos de Playa, Ojochal Gastronomic Festival, Parque Nacional Marino Ballena |
| Santa Teresa | A small beach town known for its surf breaks and yoga retreats. Ideal for travelers looking for wellness, surf culture, and stunning sunsets. | Santa Teresa Beach, Mallet Beach, Cabo Blanco Nature Reserve, Yoga studios, Organico Restaurant, Surf schools |
| Quepos | Gateway to Manuel Antonio National Park, offering a mix of adventure activities and nightlife. Suitable for tourists wanting a vibrant yet nature-centric experience. | Marina Pez Vela, Quepos Beach, Manuel Antonio National Park, Local markets, Adventure tours, Pacific Park |
Understanding Airbnb License Requirements & STR Laws in Puntarenas (2025)
While Puntarenas, Provincia de Puntarenas, Costa Rica currently shows low STR regulations, specific Airbnb license requirements might still exist or change. Always verify the latest short term rental regulations and Airbnb license requirements directly with local government authorities for Puntarenas to ensure full compliance before hosting.
(Source: AirROI data, 2025, finding no licensed listings among those analyzed)
Top Performing Airbnb Properties in Puntarenas (2025)
Benchmark your potential! Explore examples of top-performing Airbnb properties in Puntarenasbased on Trailing Twelve Month (TTM) revenue. Analyze their characteristics, revenue, occupancy rate, and ADR to understand what drives success in this market.
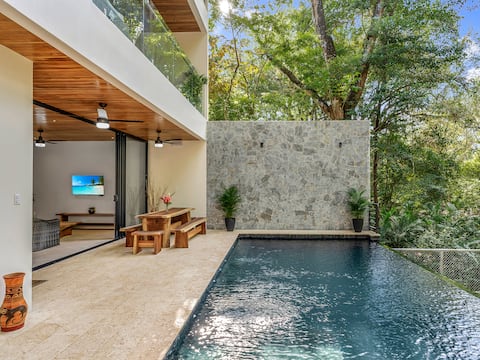
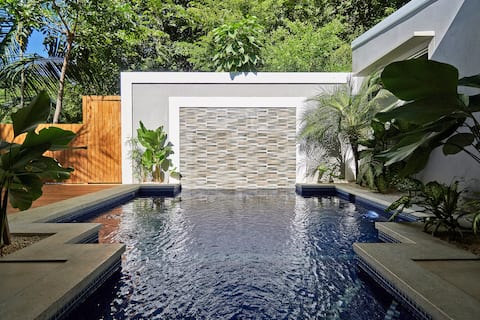
Villa with private pool
Entire Place • 7 bedrooms

2 Houses, 10 hectares with pool | Costa Casual
Entire Place • 4 bedrooms
Award Winning - 3 Bedroom Villa
Entire Place • 3 bedrooms
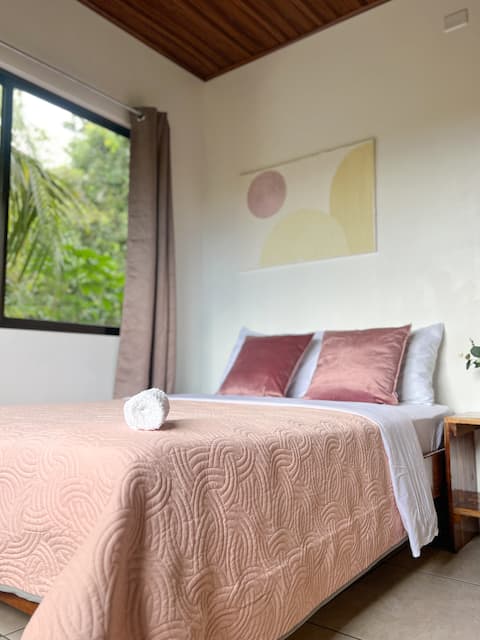
Short walk to beach, gym and supermarket
Entire Place • 1 bedroom

Villa Moa, 2BR,pool,jungle views
Entire Place • 2 bedrooms
A magnificent spacious Villa
Entire Place • 4 bedrooms
Note: Performance varies based on location, size, amenities, seasonality, and management quality. Data reflects the past 12 months.
Top Performing Airbnb Hosts in Puntarenas (2025)
Learn from the best! This table showcases top-performing Airbnb hosts in Puntarenas based on the number of properties managed and estimated total revenue over the past year. Analyze their scale and performance metrics.
| Host Name | Properties | Grossing Revenue | Stay Reviews | Avg Rating |
|---|---|---|---|---|
| Sarah | 1 | $39,393 | 4 | 5.00/5.0 |
| Nicholas | 3 | $28,412 | 17 | 4.73/5.0 |
| Aviram | 1 | $17,270 | 10 | 4.80/5.0 |
| Irina | 1 | $14,306 | 11 | 4.82/5.0 |
| Víctor | 4 | $13,285 | 97 | 4.70/5.0 |
| Martin Guillermo | 1 | $11,971 | 6 | 5.00/5.0 |
| Robert S | 1 | $11,488 | 5 | 5.00/5.0 |
| Todo Es Posible | 1 | $10,726 | 34 | 4.85/5.0 |
| Lorie | 1 | $9,712 | 8 | 5.00/5.0 |
| Benjamin | 1 | $8,325 | 13 | 5.00/5.0 |
Analyzing the strategies of top hosts, such as their property selection, pricing, and guest communication, can offer valuable lessons for optimizing your own Airbnb operations in Puntarenas.
Dive Deeper: Advanced Puntarenas STR Market Data (2025)
Ready to unlock more insights? AirROI provides access to advanced metrics and comprehensive Airbnb data for Puntarenas. Explore detailed analytics beyond this report to refine your investment strategy, optimize pricing, and maximize your vacation rental profits.
Explore Advanced MetricsPuntarenas Short-Term Rental Market Composition (2025): Property & Room Types
Room Type Distribution
Property Type Distribution
Market Composition Insights for Puntarenas
- The Puntarenas Airbnb market composition is heavily skewed towards Entire Home/Apt listings, which make up 80.6% of the 31 active rentals. This indicates strong guest preference for privacy and space.
- Looking at the property type distribution in Puntarenas, House properties are the most common (51.6%), reflecting the local real estate landscape.
- Houses represent a significant 51.6% portion, catering likely to families or larger groups.
- Smaller segments like others, hotel/boutique (combined 6.4%) offer potential for unique stay experiences.
Puntarenas Airbnb Room Capacity Analysis (2025): Bedroom Distribution
Distribution of Listings by Number of Bedrooms
Room Capacity Insights for Puntarenas
- The dominant room capacity in Puntarenas is 1 bedroom listings, making up 32.3% of the market. This suggests a strong demand for properties suitable for couples or solo travelers.
- Together, 1 bedroom and 2 bedrooms properties represent 61.3% of the active Airbnb listings in Puntarenas, indicating a high concentration in these sizes.
- A significant 32.3% of listings offer 3+ bedrooms, catering to larger groups and families seeking more space in Puntarenas.
Puntarenas Vacation Rental Guest Capacity Trends (2025)
Distribution of Listings by Guest Capacity
Guest Capacity Insights for Puntarenas
- The most common guest capacity trend in Puntarenas vacation rentals is listings accommodating 2 guests (22.6%). This suggests the primary traveler segment is likely couples or solo travelers.
- Properties designed for 2 guests and 4 guests dominate the Puntarenas STR market, accounting for 45.2% of listings.
- 32.3% of properties accommodate 6+ guests, serving the market segment for larger families or group travel in Puntarenas.
- On average, properties in Puntarenas are equipped to host 4.0 guests.
Puntarenas Airbnb Booking Patterns (2025): Available vs. Booked Days
Available Days Distribution
Booked Days Distribution
Booking Pattern Insights for Puntarenas
- The most common availability pattern in Puntarenas falls within the 271-366 days range, representing 90.3% of listings. This suggests many properties have significant open periods on their calendars.
- Approximately 100.0% of listings show high availability (181+ days open annually), indicating potential for increased bookings or specific owner usage patterns.
- For booked days, the 1-30 days range is most frequent in Puntarenas (48.4%), reflecting common guest stay durations or potential owner blocking patterns.
Puntarenas Airbnb Minimum Stay Requirements Analysis
Distribution of Listings by Minimum Night Requirement
1 Night
12 listings
38.7% of total
2 Nights
8 listings
25.8% of total
3 Nights
1 listings
3.2% of total
30+ Nights
10 listings
32.3% of total
Key Insights
- The most prevalent minimum stay requirement in Puntarenas is 1 Night, adopted by 38.7% of listings. This highlights the market's preference for shorter, flexible bookings.
- A strong majority (64.5%) of the Puntarenas Airbnb data shows acceptance of very short stays (1-2 nights), indicating a dynamic, high-turnover market.
- A significant segment (32.3%) caters to monthly stays (30+ nights) in Puntarenas, pointing to opportunities in the extended-stay market.
Recommendations
- Align with the market by considering a 1 Night minimum stay, as 38.7% of Puntarenas hosts use this setting.
- Explore offering discounts for stays of 30+ nights to attract the 32.3% of the market seeking extended stays.
- Adjust minimum nights based on seasonality – potentially shorter during low season and longer during peak demand periods in Puntarenas.
Puntarenas Airbnb Cancellation Policy Trends Analysis (2025)
Flexible
7 listings
22.6% of total
Moderate
9 listings
29% of total
Firm
12 listings
38.7% of total
Strict
3 listings
9.7% of total
Cancellation Policy Insights for Puntarenas
- The prevailing Airbnb cancellation policy trend in Puntarenas is Firm, used by 38.7% of listings.
- There's a relatively balanced mix between guest-friendly (51.6%) and stricter (48.4%) policies, offering choices for different guest needs.
- Strict cancellation policies are quite rare (9.7%), potentially making listings with this policy less competitive unless justified by high demand or property type.
Recommendations for Hosts
- Consider adopting a Firm policy to align with the 38.7% market standard in Puntarenas.
- Using a Strict policy might deter some guests, as only 9.7% of listings use it. Evaluate if potential revenue protection outweighs possible lower booking rates.
- Regularly review your cancellation policy against competitors and market demand shifts in Puntarenas.
Puntarenas STR Booking Lead Time Analysis (2025)
Average Booking Lead Time by Month
Booking Lead Time Insights for Puntarenas
- The overall average booking lead time for vacation rentals in Puntarenas is 19 days.
- Guests book furthest in advance for stays during November (average 43 days), likely coinciding with peak travel demand or local events.
- The shortest booking windows occur for stays in December (average 0 days), indicating more last-minute travel plans during this time.
- Seasonally, Fall (26 days avg.) sees the longest lead times, while Winter (0 days avg.) has the shortest, reflecting typical travel planning cycles.
Recommendations for Hosts
- Use the overall average lead time (19 days) as a baseline for your pricing and availability strategy in Puntarenas.
- For November stays, consider implementing length-of-stay discounts or slightly higher rates for bookings made less than 43 days out to capitalize on advance planning.
- During December, focus on last-minute booking availability and promotions, as guests book with very short notice (0 days avg.).
- Target marketing efforts for the Fall season well in advance (at least 26 days) to capture early planners.
- Monitor your own booking lead times against these Puntarenas averages to identify opportunities for dynamic pricing adjustments.
Popular & Essential Airbnb Amenities in Puntarenas (2025)
Amenity Prevalence
Amenity Insights for Puntarenas
- Essential amenities in Puntarenas that guests expect include: Kitchen, Wifi, Air conditioning. Lacking these (any) could significantly impact bookings.
- Popular amenities like Free parking on premises, Cooking basics, TV are common but not universal. Offering these can provide a competitive edge.
Recommendations for Hosts
- Ensure your listing includes all essential amenities for Puntarenas: Kitchen, Wifi, Air conditioning.
- Prioritize adding missing essentials: Air conditioning.
- Consider adding popular differentiators like Free parking on premises or Cooking basics to increase appeal.
- Highlight unique or less common amenities you offer (e.g., hot tub, dedicated workspace, EV charger) in your listing description and photos.
- Regularly check competitor amenities in Puntarenas to stay competitive.
Puntarenas Airbnb Guest Demographics & Profile Analysis (2025)
Guest Profile Summary for Puntarenas
- The typical guest profile for Airbnb in Puntarenas consists of a mix of domestic (48%) and international guests, with top international origins including United States, typically belonging to the Post-2000s (Gen Z/Alpha) group (50%), primarily speaking English or Spanish.
- Domestic travelers account for 47.9% of guests.
- Key international markets include Costa Rica (47.9%) and United States (20.1%).
- Top languages spoken are English (38.6%) followed by Spanish (34.6%).
- A significant demographic segment is the Post-2000s (Gen Z/Alpha) group, representing 50% of guests.
Recommendations for Hosts
- Balance marketing efforts between domestic and international channels based on the guest mix.
- Tailor amenities and listing descriptions to appeal to the dominant Post-2000s (Gen Z/Alpha) demographic (e.g., highlight fast WiFi, smart home features, local guides).
- Highlight unique local experiences or amenities relevant to the primary guest profile.
- Consider seasonal promotions aligned with peak travel times for key origin markets.
Nearby Short-Term Rental Market Comparison
How does the Puntarenas Airbnb market stack up against its neighbors? Compare key performance metrics like average monthly revenue, ADR, and occupancy rates in surrounding areas to understand the broader regional STR landscape.
| Market | Active Properties | Monthly Revenue | Daily Rate | Avg. Occupancy |
|---|---|---|---|---|
| Nacascolo | 32 | $7,056 | $1160.91 | 36% |
| Pinilla | 88 | $5,413 | $595.40 | 35% |
| Playa Tamarindo | 23 | $5,141 | $395.26 | 46% |
| Playa Langosta | 166 | $4,757 | $483.73 | 42% |
| Punta Islita | 28 | $4,728 | $542.10 | 36% |
| Tamarindo | 1,272 | $4,434 | $397.73 | 43% |
| Cabo Velas | 935 | $3,741 | $392.69 | 41% |
| Nosara | 872 | $3,626 | $424.49 | 42% |
| Tempate | 686 | $3,363 | $390.48 | 38% |
| Quepos | 1,165 | $2,785 | $249.25 | 40% |