Ángeles Airbnb Market Analysis 2026: Short Term Rental Data & Vacation Rental Statistics in Heredia Province, Costa Rica
Is Airbnb profitable in Ángeles in 2026? Explore comprehensive Airbnb analytics for Ángeles, Heredia Province, Costa Rica to uncover income potential. This 2026 STR market report for Ángeles, based on AirROI data from February 2025 to January 2026, reveals key trends in the niche market of 23 active listings.
Whether you're considering an Airbnb investment in Ángeles, optimizing your existing vacation rental, or exploring rental arbitrage opportunities, understanding the Ángeles Airbnb data is crucial. Leveraging the low regulation environment is key to maximizing your short term rental income potential. Let's dive into the specifics.
Key Ángeles Airbnb Performance Metrics Overview
Monthly Airbnb Revenue Variations & Income Potential in Ángeles (2026)
Understanding the monthly revenue variations for Airbnb listings in Ángeles is key to maximizing your short term rental income potential. Seasonality significantly impacts earnings. Our analysis, based on data from the past 12 months, shows that the peak revenue month for STRs in Ángeles is typically December, while July often presents the lowest earnings, highlighting opportunities for strategic pricing adjustments during shoulder and low seasons. Explore the typical Airbnb income in Ángeles across different performance tiers:
- Best-in-class properties (Top 10%) achieve $1,618+ monthly, often utilizing dynamic pricing and superior guest experiences.
- Strong performing properties (Top 25%) earn $1,066 or more, indicating effective management and desirable locations/amenities.
- Typical properties (Median) generate around $634 per month, representing the average market performance.
- Entry-level properties (Bottom 25%) see earnings around $338, often with potential for optimization.
Average Monthly Airbnb Earnings Trend in Ángeles
Ángeles Airbnb Occupancy Rate Trends (2026)
Maximize your bookings by understanding the Ángeles STR occupancy trends. Seasonal demand shifts significantly influence how often properties are booked. Typically, Decembersees the highest demand (peak season occupancy), while April experiences the lowest (low season). Effective strategies, like adjusting minimum stays or offering promotions, can boost occupancy during slower periods. Here's how different property tiers perform in Ángeles:
- Best-in-class properties (Top 10%) achieve 42%+ occupancy, indicating high desirability and potentially optimized availability.
- Strong performing properties (Top 25%) maintain 31% or higher occupancy, suggesting good market fit and guest satisfaction.
- Typical properties (Median) have an occupancy rate around 19%.
- Entry-level properties (Bottom 25%) average 8% occupancy, potentially facing higher vacancy.
Average Monthly Occupancy Rate Trend in Ángeles
Average Daily Rate (ADR) Airbnb Trends in Ángeles (2026)
Effective short term rental pricing strategy in Ángeles involves understanding monthly ADR fluctuations. The Average Daily Rate (ADR) for Airbnb in Ángeles typically peaks in January and dips lowest during March. Leveraging Airbnb dynamic pricing tools or strategies based on this seasonality can significantly boost revenue. Here's a look at the typical nightly rates achieved:
- Best-in-class properties (Top 10%) command rates of $266+ per night, often due to premium features or locations.
- Strong performing properties (Top 25%) achieve nightly rates of $168 or more.
- Typical properties (Median) charge around $100 per night.
- Entry-level properties (Bottom 25%) earn around $61 per night.
Average Daily Rate (ADR) Trend by Month in Ángeles
Get Live Ángeles Market Intelligence 👇

Explore Real-time Analytics
Airbnb Seasonality Analysis & Trends in Ángeles (2026)
Peak Season (December, February, January)
- Revenue averages $1,340 per month
- Occupancy rates average 26.8%
- Daily rates average $164
Shoulder Season
- Revenue averages $734 per month
- Occupancy maintains around 21.1%
- Daily rates hold near $150
Low Season (July, August, September)
- Revenue drops to average $592 per month
- Occupancy decreases to average 19.8%
- Daily rates adjust to average $150
Seasonality Insights for Ángeles
- The Airbnb seasonality in Ángeles shows highly seasonal trends requiring careful strategy. While the sections above show seasonal averages, it's also insightful to look at the extremes:
- During the high season, the absolute peak month showcases Ángeles's highest earning potential, with monthly revenues capable of climbing to $1,871, occupancy reaching a high of 33.1%, and ADRs peaking at $173.
- Conversely, the slowest single month of the year, typically falling within the low season, marks the market's lowest point. In this month, revenue might dip to $556, occupancy could drop to 18.3%, and ADRs may adjust down to $141.
- Understanding both the seasonal averages and these monthly peaks and troughs in revenue, occupancy, and ADR is crucial for maximizing your Airbnb profit potential in Ángeles.
Seasonal Strategies for Maximizing Profit
- Peak Season: Maximize revenue through premium pricing and potentially longer minimum stays. Ensure high availability.
- Low Season: Offer competitive pricing, special promotions (e.g., extended stay discounts), and flexible cancellation policies. Target off-season travelers like remote workers or budget-conscious guests.
- Shoulder Seasons: Implement dynamic pricing that balances peak and low rates. Target weekend travelers or specific events. Offer slightly more flexible terms than peak season.
- Regularly analyze your own performance against these Ángeles seasonality benchmarks and adjust your pricing and availability strategy accordingly.
Best Areas for Airbnb Investment in Ángeles (2026)
Exploring the top neighborhoods for short-term rentals in Ángeles? This section highlights key areas, outlining why they are attractive for hosts and guests, along with notable local attractions. Consider these locations based on your target guest profile and investment strategy.
| Neighborhood / Area | Why Host Here? (Target Guests & Appeal) | Key Attractions & Landmarks |
|---|---|---|
| Santa Barbara | A charming town known for its coffee plantations and scenic views, attracting tourists looking for an authentic Costa Rican experience. | Coffee tours, Café Britt, Iglesia de Santa Barbara, Mirador de Santa Barbara, Local markets |
| San Pedro | A vibrant neighborhood near universities and tech hubs, popular with young travelers and digital nomads due to its rich culture and nightlife. | Universidad de Costa Rica, Cultural Center of Spain, Local bars and clubs, Museo de Arte y Diseño Contemporáneo, Shopping at Multiplaza |
| Barva | Known for its lush nature and traditional villages, Barva offers a serene environment for nature lovers and those looking to escape city life. | Barva Volcano, Catarata La Paz, Local farms, Nature trails, Boruca indigenous culture |
| Heredia City | The capital of Heredia Province, known for its colonial architecture and rich cultural heritage, attracting visitors interested in history and local culture. | Heredia Central Park, Iglesia de la Inmaculada Concepción, Museo de Historia de Heredia, Local festivals and events |
| Turrialba | A small town known for adventure tourism, including white water rafting and hikes, attracting thrill-seekers and nature enthusiasts. | Turrialba Volcano, Pacuare River rafting, Local cheese farms, National Park |
| Poás | Home to one of the largest active volcanoes in Costa Rica, Poás attracts tourists interested in geothermal wonders and beautiful scenery. | Poás Volcano National Park, Laguna Botos, Coffee tours, Hiking trails |
| San Joaquín | A quiet residential area close to the city, popular with expats and families looking for a peaceful environment yet near urban facilities. | Parks and recreational areas, Local restaurants, Cultural events, Proximity to Heredia city |
| Sarapiquí | Famous for its rich biodiversity and eco-tourism, Sarapiquí is perfect for those who love nature and wildlife observation. | Sarapiquí River, La Selva Biological Station, Tropical Rainforest experiences, Wildlife tours, La Tirimbina Rainforest Center |
Understanding Airbnb License Requirements & STR Laws in Ángeles (2026)
While Ángeles, Heredia Province, Costa Rica currently shows low STR regulations, specific Airbnb license requirements might still exist or change. Always verify the latest short term rental regulations and Airbnb license requirements directly with local government authorities for Ángeles to ensure full compliance before hosting.
(Source: AirROI data, 2026, finding no licensed listings among those analyzed)
Top Performing Airbnb Properties in Ángeles (2026)
Benchmark your potential! Explore examples of top-performing Airbnb properties in Ángelesbased on Trailing Twelve Month (TTM) revenue. Analyze their characteristics, revenue, occupancy rate, and ADR to understand what drives success in this market.
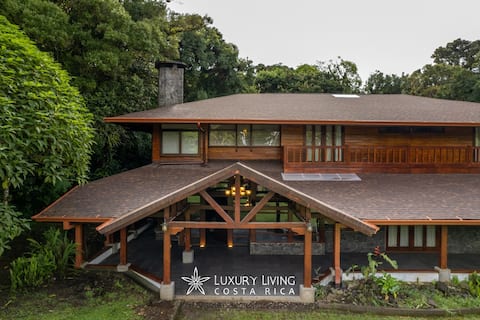
Luxurious mansion in the mountains.
Entire Place • 5 bedrooms
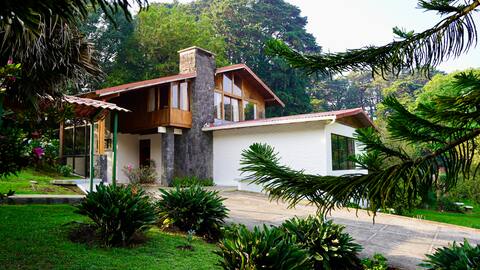
La Auxiliadora - Classic Mountain Chalet Escape
Entire Place • 4 bedrooms

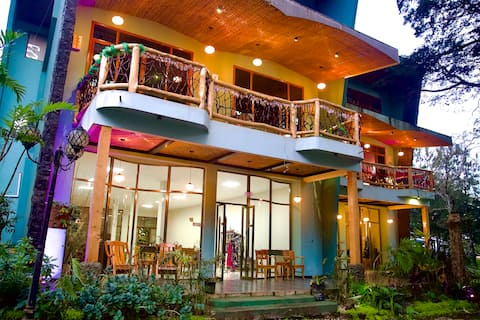
Santuario del Monte Vacation Home
Entire Place • 4 bedrooms

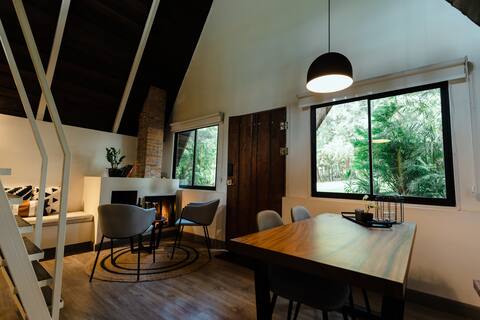
Boutique Chalet #1 - EyB Chalets
Entire Place • 1 bedroom
Casa Santuario del Monte (Mount Shrine House)
Entire Place • 4 bedrooms
Boutique Mountain Cabin #2 - EyB Chalets
Entire Place • 1 bedroom
Note: Performance varies based on location, size, amenities, seasonality, and management quality. Data reflects the past 12 months.
Top Performing Airbnb Hosts in Ángeles (2026)
Learn from the best! This table showcases top-performing Airbnb hosts in Ángeles based on the number of properties managed and estimated total revenue over the past year. Analyze their scale and performance metrics.
| Host Name | Properties | Grossing Revenue | Stay Reviews | Avg Rating |
|---|---|---|---|---|
| María Gabriela | 7 | $41,959 | 36 | 4.00/5.0 |
| Eddie | 3 | $35,302 | 278 | 4.79/5.0 |
| Travel Partner | 1 | $19,968 | 64 | 4.52/5.0 |
| Sylvia | 1 | $18,525 | 26 | 5.00/5.0 |
| Allan | 2 | $13,473 | 15 | 4.13/5.0 |
| Jose Carlos | 2 | $9,113 | 43 | 4.81/5.0 |
| Adam | 1 | $7,834 | 37 | 4.95/5.0 |
| Jessica | 1 | $7,818 | 40 | 5.00/5.0 |
| Eugenia | 1 | $7,724 | 141 | 4.85/5.0 |
| Nancy | 1 | $4,618 | 36 | 4.92/5.0 |
Analyzing the strategies of top hosts, such as their property selection, pricing, and guest communication, can offer valuable lessons for optimizing your own Airbnb operations in Ángeles.
Dive Deeper: Advanced Ángeles STR Market Data (2026)
Ready to unlock more insights? AirROI provides access to advanced metrics and comprehensive Airbnb data for Ángeles. Explore detailed analytics beyond this report to refine your investment strategy, optimize pricing, and maximize your vacation rental profits.
Explore Advanced MetricsÁngeles Short-Term Rental Market Composition (2026): Property & Room Types
Room Type Distribution
Property Type Distribution
Market Composition Insights for Ángeles
- The Ángeles Airbnb market composition is heavily skewed towards Entire Home/Apt listings, which make up 65.2% of the 23 active rentals. This indicates strong guest preference for privacy and space.
- However, a notable 34.8% share for Private Rooms suggests opportunities for budget-conscious travelers or hosts renting out spare rooms.
- Looking at the property type distribution in Ángeles, House properties are the most common (30.4%), reflecting the local real estate landscape.
- Houses represent a significant 30.4% portion, catering likely to families or larger groups.
- The presence of 30.4% Hotel/Boutique listings indicates integration with traditional hospitality.
Ángeles Airbnb Room Capacity Analysis (2026): Bedroom Distribution
Distribution of Listings by Number of Bedrooms
Room Capacity Insights for Ángeles
- The dominant room capacity in Ángeles is 1 bedroom listings, making up 47.8% of the market. This suggests a strong demand for properties suitable for couples or solo travelers.
- Together, 1 bedroom and 2 bedrooms properties represent 65.2% of the active Airbnb listings in Ángeles, indicating a high concentration in these sizes.
- A significant 26.0% of listings offer 3+ bedrooms, catering to larger groups and families seeking more space in Ángeles.
Ángeles Vacation Rental Guest Capacity Trends (2026)
Distribution of Listings by Guest Capacity
Guest Capacity Insights for Ángeles
- The most common guest capacity trend in Ángeles vacation rentals is listings accommodating 4 guests (30.4%). This suggests the primary traveler segment is likely small families or groups.
- Properties designed for 4 guests and 2 guests dominate the Ángeles STR market, accounting for 47.8% of listings.
- 26.0% of properties accommodate 6+ guests, serving the market segment for larger families or group travel in Ángeles.
- On average, properties in Ángeles are equipped to host 3.9 guests.
Ángeles Airbnb Booking Patterns (2026): Available vs. Booked Days
Available Days Distribution
Booked Days Distribution
Booking Pattern Insights for Ángeles
- The most common availability pattern in Ángeles falls within the 271-366 days range, representing 65.2% of listings. This suggests many properties have significant open periods on their calendars.
- Approximately 95.6% of listings show high availability (181+ days open annually), indicating potential for increased bookings or specific owner usage patterns.
- For booked days, the 1-30 days range is most frequent in Ángeles (39.1%), reflecting common guest stay durations or potential owner blocking patterns.
- A notable 4.3% of properties secure long booking periods (181+ days booked per year), highlighting successful long-term rental strategies or significant owner usage.
Ángeles Airbnb Minimum Stay Requirements Analysis
Distribution of Listings by Minimum Night Requirement
1 Night
19 listings
82.6% of total
2 Nights
2 listings
8.7% of total
30+ Nights
2 listings
8.7% of total
Key Insights
- The most prevalent minimum stay requirement in Ángeles is 1 Night, adopted by 82.6% of listings. This highlights the market's preference for shorter, flexible bookings.
- A strong majority (91.3%) of the Ángeles Airbnb data shows acceptance of very short stays (1-2 nights), indicating a dynamic, high-turnover market.
Recommendations
- Align with the market by considering a 1 Night minimum stay, as 82.6% of Ángeles hosts use this setting.
- Explore offering discounts for stays of 30+ nights to attract the 8.7% of the market seeking extended stays.
- Adjust minimum nights based on seasonality – potentially shorter during low season and longer during peak demand periods in Ángeles.
Ángeles Airbnb Cancellation Policy Trends Analysis (2026)
Flexible
8 listings
34.8% of total
Moderate
4 listings
17.4% of total
Firm
9 listings
39.1% of total
Strict
2 listings
8.7% of total
Cancellation Policy Insights for Ángeles
- The prevailing Airbnb cancellation policy trend in Ángeles is Firm, used by 39.1% of listings.
- There's a relatively balanced mix between guest-friendly (52.2%) and stricter (47.8%) policies, offering choices for different guest needs.
- Strict cancellation policies are quite rare (8.7%), potentially making listings with this policy less competitive unless justified by high demand or property type.
Recommendations for Hosts
- Consider adopting a Firm policy to align with the 39.1% market standard in Ángeles.
- Using a Strict policy might deter some guests, as only 8.7% of listings use it. Evaluate if potential revenue protection outweighs possible lower booking rates.
- Regularly review your cancellation policy against competitors and market demand shifts in Ángeles.
Ángeles STR Booking Lead Time Analysis (2026)
Average Booking Lead Time by Month
Booking Lead Time Insights for Ángeles
- The overall average booking lead time for vacation rentals in Ángeles is 34 days.
- Guests book furthest in advance for stays during December (average 78 days), likely coinciding with peak travel demand or local events.
- The shortest booking windows occur for stays in April (average 22 days), indicating more last-minute travel plans during this time.
- Seasonally, Winter (52 days avg.) sees the longest lead times, while Spring (23 days avg.) has the shortest, reflecting typical travel planning cycles.
Recommendations for Hosts
- Use the overall average lead time (34 days) as a baseline for your pricing and availability strategy in Ángeles.
- For December stays, consider implementing length-of-stay discounts or slightly higher rates for bookings made less than 78 days out to capitalize on advance planning.
- Target marketing efforts for the Winter season well in advance (at least 52 days) to capture early planners.
- Monitor your own booking lead times against these Ángeles averages to identify opportunities for dynamic pricing adjustments.
Popular & Essential Airbnb Amenities in Ángeles (2026)
Amenity Prevalence
Amenity Insights for Ángeles
- Essential amenities in Ángeles that guests expect include: Free parking on premises, Wifi. Lacking these (any) could significantly impact bookings.
- Popular amenities like Kitchen, Dedicated workspace, Hot water are common but not universal. Offering these can provide a competitive edge.
Recommendations for Hosts
- Ensure your listing includes all essential amenities for Ángeles: Free parking on premises, Wifi.
- Prioritize adding missing essentials: Wifi.
- Consider adding popular differentiators like Kitchen or Dedicated workspace to increase appeal.
- Highlight unique or less common amenities you offer (e.g., hot tub, dedicated workspace, EV charger) in your listing description and photos.
- Regularly check competitor amenities in Ángeles to stay competitive.
Ángeles Airbnb Guest Demographics & Profile Analysis (2026)
Guest Profile Summary for Ángeles
- The typical guest profile for Airbnb in Ángeles consists of primarily domestic travelers (80%), often arriving from nearby Heredia, typically belonging to the Post-2000s (Gen Z/Alpha) group (50%), primarily speaking Spanish or English.
- Domestic travelers account for 80.2% of guests.
- Key international markets include Costa Rica (80.2%) and United States (11.5%).
- Top languages spoken are Spanish (46.5%) followed by English (40.6%).
- A significant demographic segment is the Post-2000s (Gen Z/Alpha) group, representing 50% of guests.
Recommendations for Hosts
- Target domestic marketing efforts towards travelers from Heredia and San José.
- Tailor amenities and listing descriptions to appeal to the dominant Post-2000s (Gen Z/Alpha) demographic (e.g., highlight fast WiFi, smart home features, local guides).
- Highlight unique local experiences or amenities relevant to the primary guest profile.
- Consider seasonal promotions aligned with peak travel times for key origin markets.
Nearby Short-Term Rental Market Comparison
How does the Ángeles Airbnb market stack up against its neighbors? Compare key performance metrics like average monthly revenue, ADR, and occupancy rates in surrounding areas to understand the broader regional STR landscape.
| Market | Active Properties | Monthly Revenue | Daily Rate | Avg. Occupancy |
|---|---|---|---|---|
| Nacascolo | 32 | $6,132 | $1145.14 | 33% |
| Pinilla | 91 | $4,982 | $544.03 | 35% |
| Playa Tamarindo | 21 | $4,869 | $404.48 | 44% |
| Playa Langosta | 163 | $4,380 | $474.00 | 39% |
| Punta Islita | 27 | $4,193 | $518.64 | 36% |
| Tamarindo | 1,302 | $3,897 | $386.82 | 41% |
| Osa | 10 | $3,418 | $586.45 | 32% |
| Cabo Velas | 922 | $3,316 | $381.01 | 38% |
| Playa Grande | 33 | $3,195 | $397.35 | 40% |
| Nosara | 873 | $3,169 | $421.13 | 39% |