San José de la Montaña Airbnb Market Analysis 2026: Short Term Rental Data & Vacation Rental Statistics in Heredia Province, Costa Rica
Is Airbnb profitable in San José de la Montaña in 2026? Explore comprehensive Airbnb analytics for San José de la Montaña, Heredia Province, Costa Rica to uncover income potential. This 2026 STR market report for San José de la Montaña, based on AirROI data from February 2025 to January 2026, reveals key trends in the niche market of 22 active listings.
Whether you're considering an Airbnb investment in San José de la Montaña, optimizing your existing vacation rental, or exploring rental arbitrage opportunities, understanding the San José de la Montaña Airbnb data is crucial. Leveraging the low regulation environment is key to maximizing your short term rental income potential. Let's dive into the specifics.
Key San José de la Montaña Airbnb Performance Metrics Overview
Monthly Airbnb Revenue Variations & Income Potential in San José de la Montaña (2026)
Understanding the monthly revenue variations for Airbnb listings in San José de la Montaña is key to maximizing your short term rental income potential. Seasonality significantly impacts earnings. Our analysis, based on data from the past 12 months, shows that the peak revenue month for STRs in San José de la Montaña is typically December, while October often presents the lowest earnings, highlighting opportunities for strategic pricing adjustments during shoulder and low seasons. Explore the typical Airbnb income in San José de la Montaña across different performance tiers:
- Best-in-class properties (Top 10%) achieve $3,188+ monthly, often utilizing dynamic pricing and superior guest experiences.
- Strong performing properties (Top 25%) earn $1,953 or more, indicating effective management and desirable locations/amenities.
- Typical properties (Median) generate around $1,137 per month, representing the average market performance.
- Entry-level properties (Bottom 25%) see earnings around $522, often with potential for optimization.
Average Monthly Airbnb Earnings Trend in San José de la Montaña
San José de la Montaña Airbnb Occupancy Rate Trends (2026)
Maximize your bookings by understanding the San José de la Montaña STR occupancy trends. Seasonal demand shifts significantly influence how often properties are booked. Typically, Decembersees the highest demand (peak season occupancy), while September experiences the lowest (low season). Effective strategies, like adjusting minimum stays or offering promotions, can boost occupancy during slower periods. Here's how different property tiers perform in San José de la Montaña:
- Best-in-class properties (Top 10%) achieve 59%+ occupancy, indicating high desirability and potentially optimized availability.
- Strong performing properties (Top 25%) maintain 41% or higher occupancy, suggesting good market fit and guest satisfaction.
- Typical properties (Median) have an occupancy rate around 25%.
- Entry-level properties (Bottom 25%) average 14% occupancy, potentially facing higher vacancy.
Average Monthly Occupancy Rate Trend in San José de la Montaña
Average Daily Rate (ADR) Airbnb Trends in San José de la Montaña (2026)
Effective short term rental pricing strategy in San José de la Montaña involves understanding monthly ADR fluctuations. The Average Daily Rate (ADR) for Airbnb in San José de la Montaña typically peaks in June and dips lowest during April. Leveraging Airbnb dynamic pricing tools or strategies based on this seasonality can significantly boost revenue. Here's a look at the typical nightly rates achieved:
- Best-in-class properties (Top 10%) command rates of $292+ per night, often due to premium features or locations.
- Strong performing properties (Top 25%) achieve nightly rates of $201 or more.
- Typical properties (Median) charge around $128 per night.
- Entry-level properties (Bottom 25%) earn around $86 per night.
Average Daily Rate (ADR) Trend by Month in San José de la Montaña
Get Live San José de la Montaña Market Intelligence 👇

Explore Real-time Analytics
Airbnb Seasonality Analysis & Trends in San José de la Montaña (2026)
Peak Season (December, April, March)
- Revenue averages $1,883 per month
- Occupancy rates average 37.9%
- Daily rates average $161
Shoulder Season
- Revenue averages $1,429 per month
- Occupancy maintains around 29.7%
- Daily rates hold near $162
Low Season (June, September, October)
- Revenue drops to average $1,087 per month
- Occupancy decreases to average 23.5%
- Daily rates adjust to average $163
Seasonality Insights for San José de la Montaña
- The Airbnb seasonality in San José de la Montaña shows moderate seasonality with distinct peak and low periods. While the sections above show seasonal averages, it's also insightful to look at the extremes:
- During the high season, the absolute peak month showcases San José de la Montaña's highest earning potential, with monthly revenues capable of climbing to $2,085, occupancy reaching a high of 39.2%, and ADRs peaking at $166.
- Conversely, the slowest single month of the year, typically falling within the low season, marks the market's lowest point. In this month, revenue might dip to $1,069, occupancy could drop to 23.1%, and ADRs may adjust down to $159.
- Understanding both the seasonal averages and these monthly peaks and troughs in revenue, occupancy, and ADR is crucial for maximizing your Airbnb profit potential in San José de la Montaña.
Seasonal Strategies for Maximizing Profit
- Peak Season: Maximize revenue through premium pricing and potentially longer minimum stays. Ensure high availability.
- Low Season: Offer competitive pricing, special promotions (e.g., extended stay discounts), and flexible cancellation policies. Target off-season travelers like remote workers or budget-conscious guests.
- Shoulder Seasons: Implement dynamic pricing that balances peak and low rates. Target weekend travelers or specific events. Offer slightly more flexible terms than peak season.
- Regularly analyze your own performance against these San José de la Montaña seasonality benchmarks and adjust your pricing and availability strategy accordingly.
Best Areas for Airbnb Investment in San José de la Montaña (2026)
Exploring the top neighborhoods for short-term rentals in San José de la Montaña? This section highlights key areas, outlining why they are attractive for hosts and guests, along with notable local attractions. Consider these locations based on your target guest profile and investment strategy.
| Neighborhood / Area | Why Host Here? (Target Guests & Appeal) | Key Attractions & Landmarks |
|---|---|---|
| Ojo de Agua | A serene area surrounded by nature, popular for its beautiful landscapes and quiet environment. Ideal for guests seeking relaxation and a break from city life. | Costa Rica Coffee Tour, Local Nature Trails, Cerro de la Muerte viewpoint, Bird Watching, Nature Reserves |
| San José de la Montaña | A charming community close to the capital with easy access to urban amenities and nature. Its quaint atmosphere attracts both tourists and business travelers. | Local Markets, Cultural Festivals, Hiking Trails, Coffee Plantations, Historical Buildings |
| Santa Rosa | Known for its agricultural beauty, this area offers a glimpse into Costa Rican rural life, making it attractive for travelers looking for authenticity and local culture. | Local Farms, Coffee Tours, Nature Parks, Cultural Heritage Sites |
| La Garita | A peaceful area with scenic views, great for families and travelers looking for spacious accommodations and outdoor activities. | La Garita Wildlife Refuge, Aquatic Activities, Rural Tourism |
| Barva | Rich in history and natural beauty, Barva is a great spot for eco-tourism and cultural experiences, drawing adventurers and nature lovers alike. | Barva Volcano, Historical Ruins, Local Artisans, Nature Trails |
| Santo Domingo | A more urban area with access to shopping and entertainment, making it appealing for both short-term and long-term guests. | Central Plaza, Cafés and Restaurants, Cultural Centers |
| Heredia City Center | The heart of Heredia, this bustling area is perfect for guests who want to explore local attractions, dining, and cultural experiences. | Heredia Central Park, University of Costa Rica, Theater and Concert Venues |
| Ferrería | A quaint area known for its stunning countryside, offering a peaceful experience for guests looking to enjoy nature and some of the best views in the region. | Scenic Landscapes, Outdoor Activities, Local Cuisine Experiences |
Understanding Airbnb License Requirements & STR Laws in San José de la Montaña (2026)
While San José de la Montaña, Heredia Province, Costa Rica currently shows low STR regulations, specific Airbnb license requirements might still exist or change. Always verify the latest short term rental regulations and Airbnb license requirements directly with local government authorities for San José de la Montaña to ensure full compliance before hosting.
(Source: AirROI data, 2026, finding no licensed listings among those analyzed)
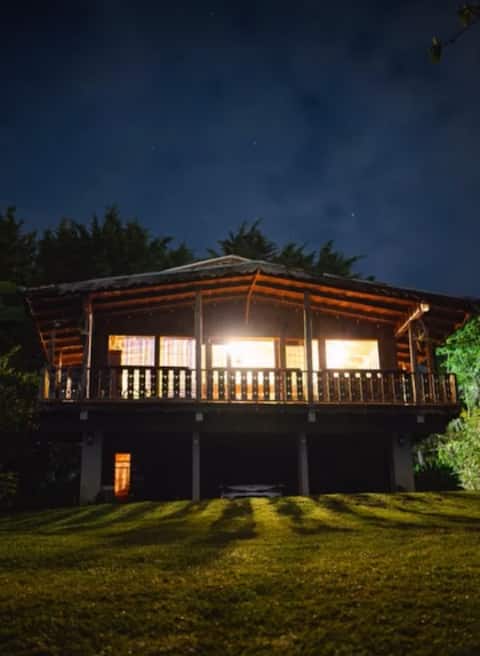
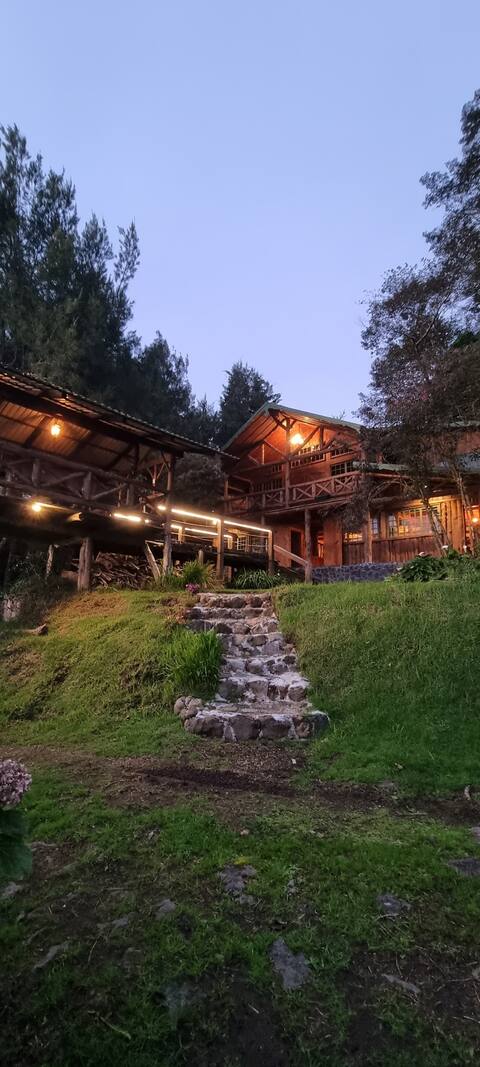
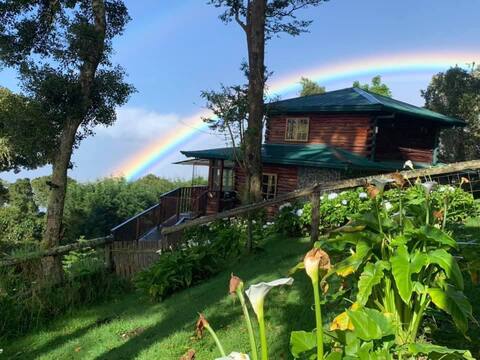
Top Performing Airbnb Properties in San José de la Montaña (2026)
Benchmark your potential! Explore examples of top-performing Airbnb properties in San José de la Montañabased on Trailing Twelve Month (TTM) revenue. Analyze their characteristics, revenue, occupancy rate, and ADR to understand what drives success in this market.

Family retreat near nature - María Bonita
Entire Place • 4 bedrooms
Fox Hole Family-friendly and quiet
Entire Place • 3 bedrooms
Kauva cabin, valley view near of Barva volcano
Entire Place • 4 bedrooms
Casa Cielo Rico - Mountain Magic
Entire Place • 3 bedrooms

La Perla
Entire Place • 2 bedrooms

Log Cabin in Birri - Heredia
Entire Place • 5 bedrooms
Note: Performance varies based on location, size, amenities, seasonality, and management quality. Data reflects the past 12 months.
Top Performing Airbnb Hosts in San José de la Montaña (2026)
Learn from the best! This table showcases top-performing Airbnb hosts in San José de la Montaña based on the number of properties managed and estimated total revenue over the past year. Analyze their scale and performance metrics.
| Host Name | Properties | Grossing Revenue | Stay Reviews | Avg Rating |
|---|---|---|---|---|
| Lauren | 1 | $43,741 | 116 | 4.97/5.0 |
| Jose Mario | 1 | $39,962 | 236 | 4.88/5.0 |
| Erika | 4 | $36,723 | 62 | 4.96/5.0 |
| Kevin | 1 | $28,942 | 95 | 4.97/5.0 |
| Jorge | 1 | $23,942 | 71 | 4.99/5.0 |
| Fabio | 1 | $21,597 | 69 | 4.96/5.0 |
| DMZ Digital | 1 | $20,649 | 44 | 4.98/5.0 |
| Amy | 1 | $19,139 | 312 | 4.71/5.0 |
| Kevin Crawford | 1 | $17,307 | 164 | 4.95/5.0 |
| Saphire | 1 | $13,445 | 7 | 4.71/5.0 |
Analyzing the strategies of top hosts, such as their property selection, pricing, and guest communication, can offer valuable lessons for optimizing your own Airbnb operations in San José de la Montaña.
Dive Deeper: Advanced San José de la Montaña STR Market Data (2026)
Ready to unlock more insights? AirROI provides access to advanced metrics and comprehensive Airbnb data for San José de la Montaña. Explore detailed analytics beyond this report to refine your investment strategy, optimize pricing, and maximize your vacation rental profits.
Explore Advanced MetricsSan José de la Montaña Short-Term Rental Market Composition (2026): Property & Room Types
Room Type Distribution
Property Type Distribution
Market Composition Insights for San José de la Montaña
- The San José de la Montaña Airbnb market composition is heavily skewed towards Entire Home/Apt listings, which make up 100% of the 22 active rentals. This indicates strong guest preference for privacy and space.
- Looking at the property type distribution in San José de la Montaña, Outdoor/Unique properties are the most common (59.1%), reflecting the local real estate landscape.
- Houses represent a significant 27.3% portion, catering likely to families or larger groups.
- Smaller segments like hotel/boutique (combined 4.5%) offer potential for unique stay experiences.
San José de la Montaña Airbnb Room Capacity Analysis (2026): Bedroom Distribution
Distribution of Listings by Number of Bedrooms
Room Capacity Insights for San José de la Montaña
- The dominant room capacity in San José de la Montaña is 1 bedroom listings, making up 40.9% of the market. This suggests a strong demand for properties suitable for couples or solo travelers.
- Together, 1 bedroom and 2 bedrooms properties represent 59.1% of the active Airbnb listings in San José de la Montaña, indicating a high concentration in these sizes.
- A significant 40.9% of listings offer 3+ bedrooms, catering to larger groups and families seeking more space in San José de la Montaña.
San José de la Montaña Vacation Rental Guest Capacity Trends (2026)
Distribution of Listings by Guest Capacity
Guest Capacity Insights for San José de la Montaña
- The most common guest capacity trend in San José de la Montaña vacation rentals is listings accommodating 8+ guests (45.5%). This suggests the primary traveler segment is likely larger groups.
- Properties designed for 8+ guests and 4 guests dominate the San José de la Monta�ña STR market, accounting for 72.8% of listings.
- 54.5% of properties accommodate 6+ guests, serving the market segment for larger families or group travel in San José de la Montaña.
- On average, properties in San José de la Montaña are equipped to host 5.9 guests.
San José de la Montaña Airbnb Booking Patterns (2026): Available vs. Booked Days
Available Days Distribution
Booked Days Distribution
Booking Pattern Insights for San José de la Montaña
- The most common availability pattern in San José de la Montaña falls within the 271-366 days range, representing 63.6% of listings. This suggests many properties have significant open periods on their calendars.
- Approximately 90.9% of listings show high availability (181+ days open annually), indicating potential for increased bookings or specific owner usage patterns.
- For booked days, the 31-90 days range is most frequent in San José de la Montaña (40.9%), reflecting common guest stay durations or potential owner blocking patterns.
- A notable 9.0% of properties secure long booking periods (181+ days booked per year), highlighting successful long-term rental strategies or significant owner usage.
San José de la Montaña Airbnb Minimum Stay Requirements Analysis
Distribution of Listings by Minimum Night Requirement
1 Night
10 listings
45.5% of total
2 Nights
10 listings
45.5% of total
30+ Nights
2 listings
9.1% of total
Key Insights
- The most prevalent minimum stay requirement in San José de la Montaña is 1 Night, adopted by 45.5% of listings. This highlights the market's preference for shorter, flexible bookings.
- A strong majority (91.0%) of the San José de la Montaña Airbnb data shows acceptance of very short stays (1-2 nights), indicating a dynamic, high-turnover market.
Recommendations
- Align with the market by considering a 1 Night minimum stay, as 45.5% of San José de la Montaña hosts use this setting.
- Explore offering discounts for stays of 30+ nights to attract the 9.1% of the market seeking extended stays.
- Adjust minimum nights based on seasonality – potentially shorter during low season and longer during peak demand periods in San José de la Montaña.
San José de la Montaña Airbnb Cancellation Policy Trends Analysis (2026)
Limited
1 listings
4.5% of total
Flexible
5 listings
22.7% of total
Moderate
11 listings
50% of total
Firm
4 listings
18.2% of total
Strict
1 listings
4.5% of total
Cancellation Policy Insights for San José de la Montaña
- The prevailing Airbnb cancellation policy trend in San José de la Montaña is Moderate, used by 50% of listings.
- The market strongly favors guest-friendly terms, with 72.7% of listings offering Flexible or Moderate policies. This suggests guests in San José de la Montaña may expect booking flexibility.
- Strict cancellation policies are quite rare (4.5%), potentially making listings with this policy less competitive unless justified by high demand or property type.
Recommendations for Hosts
- Consider adopting a Moderate policy to align with the 50% market standard in San José de la Montaña.
- Using a Strict policy might deter some guests, as only 4.5% of listings use it. Evaluate if potential revenue protection outweighs possible lower booking rates.
- Regularly review your cancellation policy against competitors and market demand shifts in San José de la Montaña.
San José de la Montaña STR Booking Lead Time Analysis (2026)
Average Booking Lead Time by Month
Booking Lead Time Insights for San José de la Montaña
- The overall average booking lead time for vacation rentals in San José de la Montaña is 31 days.
- Guests book furthest in advance for stays during August (average 46 days), likely coinciding with peak travel demand or local events.
- The shortest booking windows occur for stays in March (average 20 days), indicating more last-minute travel plans during this time.
- Seasonally, Summer (36 days avg.) sees the longest lead times, while Spring (25 days avg.) has the shortest, reflecting typical travel planning cycles.
Recommendations for Hosts
- Use the overall average lead time (31 days) as a baseline for your pricing and availability strategy in San José de la Montaña.
- For August stays, consider implementing length-of-stay discounts or slightly higher rates for bookings made less than 46 days out to capitalize on advance planning.
- Target marketing efforts for the Summer season well in advance (at least 36 days) to capture early planners.
- Monitor your own booking lead times against these San José de la Montaña averages to identify opportunities for dynamic pricing adjustments.
Popular & Essential Airbnb Amenities in San José de la Montaña (2026)
Amenity Prevalence
Amenity Insights for San Jos�é de la Montaña
- Essential amenities in San José de la Montaña that guests expect include: Free parking on premises, Wifi, Dishes and silverware, Microwave. Lacking these (any) could significantly impact bookings.
- Popular amenities like Cooking basics, TV, Refrigerator are common but not universal. Offering these can provide a competitive edge.
Recommendations for Hosts
- Ensure your listing includes all essential amenities for San José de la Montaña: Free parking on premises, Wifi, Dishes and silverware, Microwave.
- Prioritize adding missing essentials: Wifi, Dishes and silverware, Microwave.
- Consider adding popular differentiators like Cooking basics or TV to increase appeal.
- Highlight unique or less common amenities you offer (e.g., hot tub, dedicated workspace, EV charger) in your listing description and photos.
- Regularly check competitor amenities in San José de la Montaña to stay competitive.
San José de la Montaña Airbnb Guest Demographics & Profile Analysis (2026)
Guest Profile Summary for San José de la Montaña
- The typical guest profile for Airbnb in San José de la Montaña consists of primarily domestic travelers (73%), often arriving from nearby Heredia, typically belonging to the Post-2000s (Gen Z/Alpha) group (50%), primarily speaking Spanish or English.
- Domestic travelers account for 73.3% of guests.
- Key international markets include Costa Rica (73.3%) and United States (18.6%).
- Top languages spoken are Spanish (43.4%) followed by English (40.3%).
- A significant demographic segment is the Post-2000s (Gen Z/Alpha) group, representing 50% of guests.
Recommendations for Hosts
- Target domestic marketing efforts towards travelers from Heredia and San José.
- Tailor amenities and listing descriptions to appeal to the dominant Post-2000s (Gen Z/Alpha) demographic (e.g., highlight fast WiFi, smart home features, local guides).
- Highlight unique local experiences or amenities relevant to the primary guest profile.
- Consider seasonal promotions aligned with peak travel times for key origin markets.
Nearby Short-Term Rental Market Comparison
How does the San José de la Montaña Airbnb market stack up against its neighbors? Compare key performance metrics like average monthly revenue, ADR, and occupancy rates in surrounding areas to understand the broader regional STR landscape.
| Market | Active Properties | Monthly Revenue | Daily Rate | Avg. Occupancy |
|---|---|---|---|---|
| Nacascolo | 32 | $6,132 | $1145.14 | 33% |
| Pinilla | 91 | $4,982 | $544.03 | 35% |
| Playa Tamarindo | 21 | $4,869 | $404.48 | 44% |
| Playa Langosta | 163 | $4,380 | $474.00 | 39% |
| Punta Islita | 27 | $4,193 | $518.64 | 36% |
| Tamarindo | 1,302 | $3,897 | $386.82 | 41% |
| Osa | 10 | $3,418 | $586.45 | 32% |
| Cabo Velas | 922 | $3,316 | $381.01 | 38% |
| Playa Grande | 33 | $3,195 | $397.35 | 40% |
| Nosara | 873 | $3,169 | $421.13 | 39% |