Turrialba Airbnb Market Analysis 2026: Short Term Rental Data & Vacation Rental Statistics in Cartago Province, Costa Rica
Is Airbnb profitable in Turrialba in 2026? Explore comprehensive Airbnb analytics for Turrialba, Cartago Province, Costa Rica to uncover income potential. This 2026 STR market report for Turrialba, based on AirROI data from February 2025 to January 2026, reveals key trends in the niche market of 38 active listings.
Whether you're considering an Airbnb investment in Turrialba, optimizing your existing vacation rental, or exploring rental arbitrage opportunities, understanding the Turrialba Airbnb data is crucial. Leveraging the low regulation environment is key to maximizing your short term rental income potential. Let's dive into the specifics.
Key Turrialba Airbnb Performance Metrics Overview
Monthly Airbnb Revenue Variations & Income Potential in Turrialba (2026)
Understanding the monthly revenue variations for Airbnb listings in Turrialba is key to maximizing your short term rental income potential. Seasonality significantly impacts earnings. Our analysis, based on data from the past 12 months, shows that the peak revenue month for STRs in Turrialba is typically May, while September often presents the lowest earnings, highlighting opportunities for strategic pricing adjustments during shoulder and low seasons. Explore the typical Airbnb income in Turrialba across different performance tiers:
- Best-in-class properties (Top 10%) achieve $1,674+ monthly, often utilizing dynamic pricing and superior guest experiences.
- Strong performing properties (Top 25%) earn $1,009 or more, indicating effective management and desirable locations/amenities.
- Typical properties (Median) generate around $535 per month, representing the average market performance.
- Entry-level properties (Bottom 25%) see earnings around $252, often with potential for optimization.
Average Monthly Airbnb Earnings Trend in Turrialba
Turrialba Airbnb Occupancy Rate Trends (2026)
Maximize your bookings by understanding the Turrialba STR occupancy trends. Seasonal demand shifts significantly influence how often properties are booked. Typically, Aprilsees the highest demand (peak season occupancy), while August experiences the lowest (low season). Effective strategies, like adjusting minimum stays or offering promotions, can boost occupancy during slower periods. Here's how different property tiers perform in Turrialba:
- Best-in-class properties (Top 10%) achieve 56%+ occupancy, indicating high desirability and potentially optimized availability.
- Strong performing properties (Top 25%) maintain 40% or higher occupancy, suggesting good market fit and guest satisfaction.
- Typical properties (Median) have an occupancy rate around 23%.
- Entry-level properties (Bottom 25%) average 12% occupancy, potentially facing higher vacancy.
Average Monthly Occupancy Rate Trend in Turrialba
Average Daily Rate (ADR) Airbnb Trends in Turrialba (2026)
Effective short term rental pricing strategy in Turrialba involves understanding monthly ADR fluctuations. The Average Daily Rate (ADR) for Airbnb in Turrialba typically peaks in December and dips lowest during March. Leveraging Airbnb dynamic pricing tools or strategies based on this seasonality can significantly boost revenue. Here's a look at the typical nightly rates achieved:
- Best-in-class properties (Top 10%) command rates of $126+ per night, often due to premium features or locations.
- Strong performing properties (Top 25%) achieve nightly rates of $96 or more.
- Typical properties (Median) charge around $67 per night.
- Entry-level properties (Bottom 25%) earn around $48 per night.
Average Daily Rate (ADR) Trend by Month in Turrialba
Get Live Turrialba Market Intelligence 👇

Explore Real-time Analytics
Airbnb Seasonality Analysis & Trends in Turrialba (2026)
Peak Season (May, April, March)
- Revenue averages $921 per month
- Occupancy rates average 32.5%
- Daily rates average $77
Shoulder Season
- Revenue averages $774 per month
- Occupancy maintains around 28.8%
- Daily rates hold near $81
Low Season (June, August, September)
- Revenue drops to average $502 per month
- Occupancy decreases to average 22.6%
- Daily rates adjust to average $78
Seasonality Insights for Turrialba
- The Airbnb seasonality in Turrialba shows moderate seasonality with distinct peak and low periods. While the sections above show seasonal averages, it's also insightful to look at the extremes:
- During the high season, the absolute peak month showcases Turrialba's highest earning potential, with monthly revenues capable of climbing to $944, occupancy reaching a high of 39.1%, and ADRs peaking at $84.
- Conversely, the slowest single month of the year, typically falling within the low season, marks the market's lowest point. In this month, revenue might dip to $446, occupancy could drop to 21.7%, and ADRs may adjust down to $76.
- Understanding both the seasonal averages and these monthly peaks and troughs in revenue, occupancy, and ADR is crucial for maximizing your Airbnb profit potential in Turrialba.
Seasonal Strategies for Maximizing Profit
- Peak Season: Maximize revenue through premium pricing and potentially longer minimum stays. Ensure high availability.
- Low Season: Offer competitive pricing, special promotions (e.g., extended stay discounts), and flexible cancellation policies. Target off-season travelers like remote workers or budget-conscious guests.
- Shoulder Seasons: Implement dynamic pricing that balances peak and low rates. Target weekend travelers or specific events. Offer slightly more flexible terms than peak season.
- Regularly analyze your own performance against these Turrialba seasonality benchmarks and adjust your pricing and availability strategy accordingly.
Best Areas for Airbnb Investment in Turrialba (2026)
Exploring the top neighborhoods for short-term rentals in Turrialba? This section highlights key areas, outlining why they are attractive for hosts and guests, along with notable local attractions. Consider these locations based on your target guest profile and investment strategy.
| Neighborhood / Area | Why Host Here? (Target Guests & Appeal) | Key Attractions & Landmarks |
|---|---|---|
| Turrialba Town Center | The vibrant heart of Turrialba with local shops, restaurants, and markets. Ideal for guests wanting to experience the local culture and community. | Cathedral of Turrialba, Turrialba Market, Museo Guatuso, Casa de la Cultura, Parque Central de Turrialba |
| Turrialba Volcano National Park | A beautiful natural reserve with stunning views and outdoor activities like hiking and bird watching. Attracts nature lovers and adventure seekers. | Turrialba Volcano, Hiking trails, Scenic viewpoints, Wildlife watching, Mountain biking |
| Casa del Icano | A cozy and picturesque area ideal for solar energy projects and Airbnb hosting. Combining comfort with eco-friendliness. | Scenic hills, Coffee plantation tours, Eco-lodges |
| Rio Pacuare | Globally renowned for its rafting and adventure tourism. Perfect for thrill-seekers and outdoor enthusiasts looking for unique experiences. | White-water rafting, Kayaking, Nature tours, Camping by the river |
| Orosi Valley | Known for its lush landscapes and coffee plantations, it offers tranquility and scenic beauty, attracting tourists looking for relaxation away from the urban hustle. | Orosi River, Coffee tours, Historic churches, Hiking and nature trails |
| Guayabo National Monument | Home to the remains of a pre-Columbian city, it attracts history buffs and those interested in ancient cultures of Costa Rica. | Archaeological ruins, Nature trails, Visitor center |
| Pueblo Nuevo | A quiet residential area close to the countryside, perfect for an authentic rural Costa Rican experience and connection with locals. | Food markets, Local festivals, Agricultural tours |
| La Suiza | A hidden gem known for its cool climate and stunning landscapes, appealing to tourists looking for peace and adventure in nature. | Nature reserves, Biking trails, Local wildlife |
Understanding Airbnb License Requirements & STR Laws in Turrialba (2026)
While Turrialba, Cartago Province, Costa Rica currently shows low STR regulations, specific Airbnb license requirements might still exist or change. Always verify the latest short term rental regulations and Airbnb license requirements directly with local government authorities for Turrialba to ensure full compliance before hosting.
(Source: AirROI data, 2026, finding no licensed listings among those analyzed)
Top Performing Airbnb Properties in Turrialba (2026)
Benchmark your potential! Explore examples of top-performing Airbnb properties in Turrialbabased on Trailing Twelve Month (TTM) revenue. Analyze their characteristics, revenue, occupancy rate, and ADR to understand what drives success in this market.
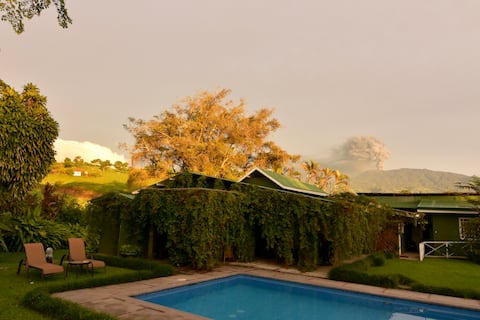
Spacious Farmhouse with Pool & Exotic Gardens
Entire Place • 3 bedrooms

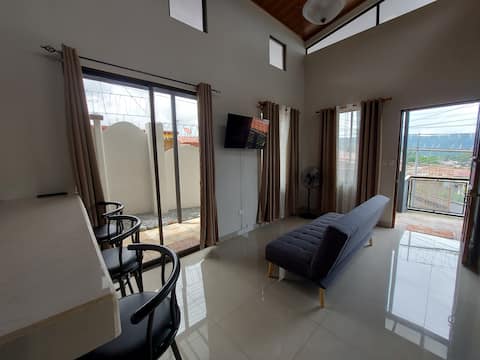
Top floor. Modern apartment, excellent location
Entire Place • 3 bedrooms
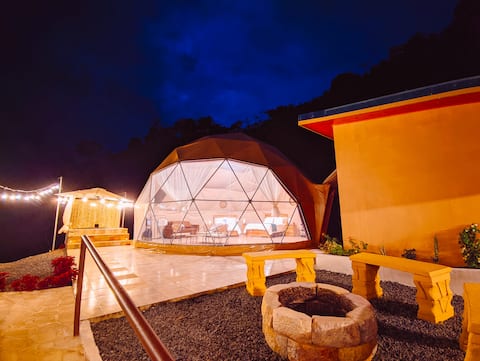
Las Colinas Glamping (Dome #3)
Entire Place • 1 bedroom

Casa Boutique Kiv Turrialba
Entire Place • 2 bedrooms

Rustic Chic Cabin with Pool & Exotic Gardens
Entire Place • 1 bedroom
Centrally located accommodation Mami's house
Entire Place • 2 bedrooms
Note: Performance varies based on location, size, amenities, seasonality, and management quality. Data reflects the past 12 months.
Top Performing Airbnb Hosts in Turrialba (2026)
Learn from the best! This table showcases top-performing Airbnb hosts in Turrialba based on the number of properties managed and estimated total revenue over the past year. Analyze their scale and performance metrics.
| Host Name | Properties | Grossing Revenue | Stay Reviews | Avg Rating |
|---|---|---|---|---|
| Adela | 2 | $41,027 | 134 | 4.99/5.0 |
| Hector | 6 | $30,400 | 132 | 4.76/5.0 |
| Carolina | 6 | $30,253 | 143 | 4.88/5.0 |
| Juanka | 2 | $24,525 | 81 | 4.83/5.0 |
| Andrés | 1 | $17,789 | 9 | 5.00/5.0 |
| José Manuel | 1 | $12,226 | 44 | 4.95/5.0 |
| Jennifer | 1 | $10,321 | 5 | 5.00/5.0 |
| Antonio | 1 | $10,120 | 76 | 4.89/5.0 |
| Jaim | 1 | $6,231 | 186 | 4.91/5.0 |
| Jacqueline | 1 | $6,031 | 85 | 4.85/5.0 |
Analyzing the strategies of top hosts, such as their property selection, pricing, and guest communication, can offer valuable lessons for optimizing your own Airbnb operations in Turrialba.
Dive Deeper: Advanced Turrialba STR Market Data (2026)
Ready to unlock more insights? AirROI provides access to advanced metrics and comprehensive Airbnb data for Turrialba. Explore detailed analytics beyond this report to refine your investment strategy, optimize pricing, and maximize your vacation rental profits.
Explore Advanced MetricsTurrialba Short-Term Rental Market Composition (2026): Property & Room Types
Room Type Distribution
Property Type Distribution
Market Composition Insights for Turrialba
- The Turrialba Airbnb market composition is heavily skewed towards Entire Home/Apt listings, which make up 65.8% of the 38 active rentals. This indicates strong guest preference for privacy and space.
- However, a notable 34.2% share for Private Rooms suggests opportunities for budget-conscious travelers or hosts renting out spare rooms.
- Looking at the property type distribution in Turrialba, House properties are the most common (36.8%), reflecting the local real estate landscape.
- Houses represent a significant 36.8% portion, catering likely to families or larger groups.
- The presence of 26.3% Hotel/Boutique listings indicates integration with traditional hospitality.
Turrialba Airbnb Room Capacity Analysis (2026): Bedroom Distribution
Distribution of Listings by Number of Bedrooms
Room Capacity Insights for Turrialba
- The dominant room capacity in Turrialba is 1 bedroom listings, making up 47.4% of the market. This suggests a strong demand for properties suitable for couples or solo travelers.
- Together, 1 bedroom and 3 bedrooms properties represent 68.5% of the active Airbnb listings in Turrialba, indicating a high concentration in these sizes.
- A significant 23.7% of listings offer 3+ bedrooms, catering to larger groups and families seeking more space in Turrialba.
Turrialba Vacation Rental Guest Capacity Trends (2026)
Distribution of Listings by Guest Capacity
Guest Capacity Insights for Turrialba
- The most common guest capacity trend in Turrialba vacation rentals is listings accommodating 6 guests (21.1%). This suggests the primary traveler segment is likely larger groups.
- Properties designed for 6 guests and 4 guests dominate the Turrialba STR market, accounting for 39.5% of listings.
- 29.0% of properties accommodate 6+ guests, serving the market segment for larger families or group travel in Turrialba.
- On average, properties in Turrialba are equipped to host 3.9 guests.
Turrialba Airbnb Booking Patterns (2026): Available vs. Booked Days
Available Days Distribution
Booked Days Distribution
Booking Pattern Insights for Turrialba
- The most common availability pattern in Turrialba falls within the 271-366 days range, representing 71.1% of listings. This suggests many properties have significant open periods on their calendars.
- Approximately 97.4% of listings show high availability (181+ days open annually), indicating potential for increased bookings or specific owner usage patterns.
- For booked days, the 1-30 days range is most frequent in Turrialba (34.2%), reflecting common guest stay durations or potential owner blocking patterns.
- A notable 2.6% of properties secure long booking periods (181+ days booked per year), highlighting successful long-term rental strategies or significant owner usage.
Turrialba Airbnb Minimum Stay Requirements Analysis
Distribution of Listings by Minimum Night Requirement
1 Night
32 listings
84.2% of total
2 Nights
5 listings
13.2% of total
30+ Nights
1 listings
2.6% of total
Key Insights
- The most prevalent minimum stay requirement in Turrialba is 1 Night, adopted by 84.2% of listings. This highlights the market's preference for shorter, flexible bookings.
- A strong majority (97.4%) of the Turrialba Airbnb data shows acceptance of very short stays (1-2 nights), indicating a dynamic, high-turnover market.
- Dedicated monthly rentals (30+ nights) represent a small niche (2.6%), possibly an untapped area for hosts.
Recommendations
- Align with the market by considering a 1 Night minimum stay, as 84.2% of Turrialba hosts use this setting.
- Adjust minimum nights based on seasonality – potentially shorter during low season and longer during peak demand periods in Turrialba.
Turrialba Airbnb Cancellation Policy Trends Analysis (2026)
Flexible
16 listings
42.1% of total
Moderate
11 listings
28.9% of total
Firm
9 listings
23.7% of total
Strict
2 listings
5.3% of total
Cancellation Policy Insights for Turrialba
- The prevailing Airbnb cancellation policy trend in Turrialba is Flexible, used by 42.1% of listings.
- The market strongly favors guest-friendly terms, with 71.0% of listings offering Flexible or Moderate policies. This suggests guests in Turrialba may expect booking flexibility.
- Strict cancellation policies are quite rare (5.3%), potentially making listings with this policy less competitive unless justified by high demand or property type.
Recommendations for Hosts
- Consider adopting a Flexible policy to align with the 42.1% market standard in Turrialba.
- Using a Strict policy might deter some guests, as only 5.3% of listings use it. Evaluate if potential revenue protection outweighs possible lower booking rates.
- Regularly review your cancellation policy against competitors and market demand shifts in Turrialba.
Turrialba STR Booking Lead Time Analysis (2026)
Average Booking Lead Time by Month
Booking Lead Time Insights for Turrialba
- The overall average booking lead time for vacation rentals in Turrialba is 40 days.
- Guests book furthest in advance for stays during November (average 58 days), likely coinciding with peak travel demand or local events.
- The shortest booking windows occur for stays in October (average 27 days), indicating more last-minute travel plans during this time.
- Seasonally, Fall (47 days avg.) sees the longest lead times, while Summer (37 days avg.) has the shortest, reflecting typical travel planning cycles.
Recommendations for Hosts
- Use the overall average lead time (40 days) as a baseline for your pricing and availability strategy in Turrialba.
- For November stays, consider implementing length-of-stay discounts or slightly higher rates for bookings made less than 58 days out to capitalize on advance planning.
- Target marketing efforts for the Fall season well in advance (at least 47 days) to capture early planners.
- Monitor your own booking lead times against these Turrialba averages to identify opportunities for dynamic pricing adjustments.
Popular & Essential Airbnb Amenities in Turrialba (2026)
Amenity Prevalence
Amenity Insights for Turrialba
- Essential amenities in Turrialba that guests expect include: Wifi. Lacking these (this) could significantly impact bookings.
- Popular amenities like Free parking on premises, Kitchen, TV are common but not universal. Offering these can provide a competitive edge.
Recommendations for Hosts
- Ensure your listing includes all essential amenities for Turrialba: Wifi.
- Consider adding popular differentiators like Free parking on premises or Kitchen to increase appeal.
- Highlight unique or less common amenities you offer (e.g., hot tub, dedicated workspace, EV charger) in your listing description and photos.
- Regularly check competitor amenities in Turrialba to stay competitive.
Turrialba Airbnb Guest Demographics & Profile Analysis (2026)
Guest Profile Summary for Turrialba
- The typical guest profile for Airbnb in Turrialba consists of predominantly international visitors (67%), with top international origins including United States, typically belonging to the Post-2000s (Gen Z/Alpha) group (50%), primarily speaking English or Spanish.
- Domestic travelers account for 33.1% of guests.
- Key international markets include Costa Rica (33.1%) and United States (25.2%).
- Top languages spoken are English (39.2%) followed by Spanish (31.8%).
- A significant demographic segment is the Post-2000s (Gen Z/Alpha) group, representing 50% of guests.
Recommendations for Hosts
- Focus marketing internationally, particularly towards travelers from United States.
- Tailor amenities and listing descriptions to appeal to the dominant Post-2000s (Gen Z/Alpha) demographic (e.g., highlight fast WiFi, smart home features, local guides).
- Highlight unique local experiences or amenities relevant to the primary guest profile.
- Consider seasonal promotions aligned with peak travel times for key origin markets.
Nearby Short-Term Rental Market Comparison
How does the Turrialba Airbnb market stack up against its neighbors? Compare key performance metrics like average monthly revenue, ADR, and occupancy rates in surrounding areas to understand the broader regional STR landscape.
| Market | Active Properties | Monthly Revenue | Daily Rate | Avg. Occupancy |
|---|---|---|---|---|
| Osa | 10 | $3,418 | $586.45 | 32% |
| Savegre de Aguirre | 15 | $2,740 | $372.47 | 36% |
| Quepos | 1,172 | $2,594 | $246.50 | 39% |
| Cabeceras | 33 | $2,508 | $190.48 | 44% |
| Caldera | 36 | $2,490 | $270.58 | 33% |
| Venado | 10 | $2,404 | $200.91 | 41% |
| Jacó | 2,135 | $2,188 | $296.12 | 33% |
| Savegre | 186 | $2,150 | $256.31 | 34% |
| Bahía Ballena | 1,282 | $2,099 | $237.59 | 37% |
| Tárcoles | 294 | $1,978 | $253.51 | 30% |