San José Airbnb Market Analysis 2025: Short Term Rental Data & Vacation Rental Statistics in Alajuela Province, Costa Rica
Is Airbnb profitable in San José in 2025? Explore comprehensive Airbnb analytics for San José, Alajuela Province, Costa Rica to uncover income potential. This 2025 STR market report for San José, based on AirROI data from November 2024 to October 2025, reveals key trends in the niche market of 60 active listings.
Whether you're considering an Airbnb investment in San José, optimizing your existing vacation rental, or exploring rental arbitrage opportunities, understanding the San José Airbnb data is crucial. Leveraging the low regulation environment is key to maximizing your short term rental income potential. Let's dive into the specifics.
Key San José Airbnb Performance Metrics Overview
Monthly Airbnb Revenue Variations & Income Potential in San José (2025)
Understanding the monthly revenue variations for Airbnb listings in San José is key to maximizing your short term rental income potential. Seasonality significantly impacts earnings. Our analysis, based on data from the past 12 months, shows that the peak revenue month for STRs in San José is typically December, while September often presents the lowest earnings, highlighting opportunities for strategic pricing adjustments during shoulder and low seasons. Explore the typical Airbnb income in San José across different performance tiers:
- Best-in-class properties (Top 10%) achieve $1,894+ monthly, often utilizing dynamic pricing and superior guest experiences.
- Strong performing properties (Top 25%) earn $864 or more, indicating effective management and desirable locations/amenities.
- Typical properties (Median) generate around $472 per month, representing the average market performance.
- Entry-level properties (Bottom 25%) see earnings around $186, often with potential for optimization.
Average Monthly Airbnb Earnings Trend in San José
San José Airbnb Occupancy Rate Trends (2025)
Maximize your bookings by understanding the San José STR occupancy trends. Seasonal demand shifts significantly influence how often properties are booked. Typically, Julysees the highest demand (peak season occupancy), while September experiences the lowest (low season). Effective strategies, like adjusting minimum stays or offering promotions, can boost occupancy during slower periods. Here's how different property tiers perform in San José:
- Best-in-class properties (Top 10%) achieve 73%+ occupancy, indicating high desirability and potentially optimized availability.
- Strong performing properties (Top 25%) maintain 44% or higher occupancy, suggesting good market fit and guest satisfaction.
- Typical properties (Median) have an occupancy rate around 22%.
- Entry-level properties (Bottom 25%) average 9% occupancy, potentially facing higher vacancy.
Average Monthly Occupancy Rate Trend in San José
Average Daily Rate (ADR) Airbnb Trends in San José (2025)
Effective short term rental pricing strategy in San José involves understanding monthly ADR fluctuations. The Average Daily Rate (ADR) for Airbnb in San José typically peaks in June and dips lowest during November. Leveraging Airbnb dynamic pricing tools or strategies based on this seasonality can significantly boost revenue. Here's a look at the typical nightly rates achieved:
- Best-in-class properties (Top 10%) command rates of $161+ per night, often due to premium features or locations.
- Strong performing properties (Top 25%) achieve nightly rates of $97 or more.
- Typical properties (Median) charge around $67 per night.
- Entry-level properties (Bottom 25%) earn around $43 per night.
Average Daily Rate (ADR) Trend by Month in San José
Get Live San José Market Intelligence 👇

Explore Real-time Analytics
Airbnb Seasonality Analysis & Trends in San José (2025)
Peak Season (December, July, November)
- Revenue averages $1,017 per month
- Occupancy rates average 36.0%
- Daily rates average $85
Shoulder Season
- Revenue averages $808 per month
- Occupancy maintains around 30.7%
- Daily rates hold near $86
Low Season (May, August, September)
- Revenue drops to average $564 per month
- Occupancy decreases to average 23.0%
- Daily rates adjust to average $86
Seasonality Insights for San José
- The Airbnb seasonality in San José shows highly seasonal trends requiring careful strategy. While the sections above show seasonal averages, it's also insightful to look at the extremes:
- During the high season, the absolute peak month showcases San José's highest earning potential, with monthly revenues capable of climbing to $1,106, occupancy reaching a high of 38.6%, and ADRs peaking at $88.
- Conversely, the slowest single month of the year, typically falling within the low season, marks the market's lowest point. In this month, revenue might dip to $498, occupancy could drop to 21.2%, and ADRs may adjust down to $84.
- Understanding both the seasonal averages and these monthly peaks and troughs in revenue, occupancy, and ADR is crucial for maximizing your Airbnb profit potential in San José.
Seasonal Strategies for Maximizing Profit
- Peak Season: Maximize revenue through premium pricing and potentially longer minimum stays. Ensure high availability.
- Low Season: Offer competitive pricing, special promotions (e.g., extended stay discounts), and flexible cancellation policies. Target off-season travelers like remote workers or budget-conscious guests.
- Shoulder Seasons: Implement dynamic pricing that balances peak and low rates. Target weekend travelers or specific events. Offer slightly more flexible terms than peak season.
- Regularly analyze your own performance against these San José seasonality benchmarks and adjust your pricing and availability strategy accordingly.
Best Areas for Airbnb Investment in San José (2025)
Exploring the top neighborhoods for short-term rentals in San José? This section highlights key areas, outlining why they are attractive for hosts and guests, along with notable local attractions. Consider these locations based on your target guest profile and investment strategy.
| Neighborhood / Area | Why Host Here? (Target Guests & Appeal) | Key Attractions & Landmarks |
|---|---|---|
| Escazú | A suburban area close to San José known for its upscale living and amenities. Perfect for those wanting a blend of luxury and convenience, popular among expats and tourists. | Multiplaza Escazú, Britt Coffee Tour, Parque Nacional Quebrada González, restaurants and cafes, La Casa del Café |
| Santa Ana | Another upscale suburb of San José, known for its modern developments and dining options. A great choice for visitors looking for a relaxed atmosphere close to city amenities. | City Place, Parque de Santa Ana, Apia Mall, restaurants and nightlife, Cultural Center |
| Downtown San José | The vibrant heart of Costa Rica's capital, filled with historical architecture and cultural sites. Ideal for travelers interested in history and urban experiences. | National Theatre of Costa Rica, Museo del Oro Precolombino, Plaza de la Cultura, Central Market, Metropolitan Cathedral |
| La Sabana | A park-filled area known for its sports and cultural facilities. It attracts both locals and tourists who enjoy outdoor activities and art. | La Sabana Park, Museo de Arte Costarricense, Central de Autobuses, Casa del Cuño, Café Café |
| Heredia | Known as the 'City of Flowers', it's a lovely area close to San José, featuring charming colonial architecture and a cooler climate. | Las Golden Hills, Hacienda Palmares, Parque Nacional Braulio Carrillo, Central Park, Historical Center of Heredia |
| Alajuela | The capital of Alajuela Province, offering a taste of local life along with access to natural attractions like the Arenal Volcano. | Juan Santamaría International Airport, Central Market, Cathedral of Alajuela, Zoo Ave, Coffee plantations |
| Turrialba | Famous for its coffee and the Turrialba Volcano, this area is great for ecotourism and adventure travelers. | Turrialba Volcano, Guayabo National Monument, River rafting on Pacuare, Coffee plantations, Ecotourism Activities |
| Cartago | Historical city that was once the capital of Costa Rica, rich in cultural sites and beautiful scenery, attracting history and nature lovers alike. | Basilica de Los Ángeles, Ruins of Ujarrás, Lankester Botanical Garden, Tapantí National Park, Orosí Valley |
Understanding Airbnb License Requirements & STR Laws in San José (2025)
While San José, Alajuela Province, Costa Rica currently shows low STR regulations, specific Airbnb license requirements might still exist or change. Always verify the latest short term rental regulations and Airbnb license requirements directly with local government authorities for San José to ensure full compliance before hosting.
(Source: AirROI data, 2025, based on 2% licensed listings)
Top Performing Airbnb Properties in San José (2025)
Benchmark your potential! Explore examples of top-performing Airbnb properties in San Josébased on Trailing Twelve Month (TTM) revenue. Analyze their characteristics, revenue, occupancy rate, and ADR to understand what drives success in this market.
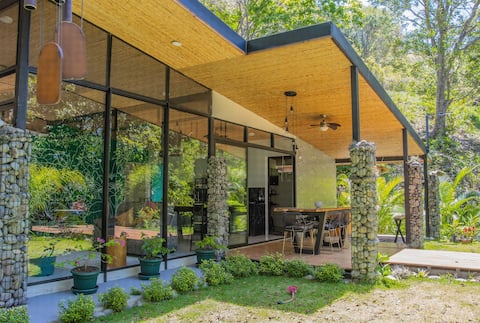
Finca Totoro, Trails and Nature
Entire Place • 2 bedrooms

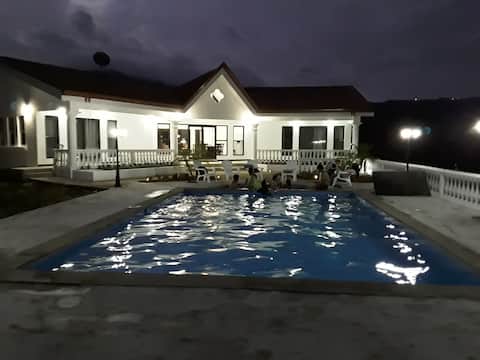
Casa Güitite (10 min from airport)
Entire Place • 5 bedrooms

Casa Gaudi🦚Near SJO🦚Private Pool & King BD
Entire Place • 4 bedrooms
Morazan Hills Villa
Entire Place • 3 bedrooms
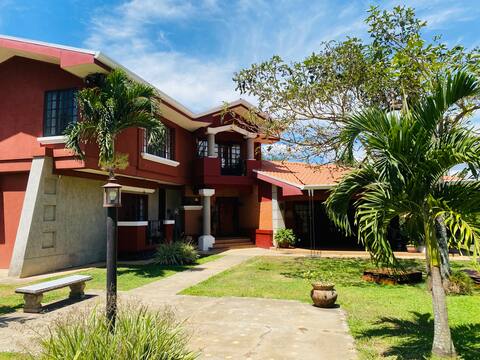
The Red Castle
Entire Place • 3 bedrooms

Big and luxury urban house
Entire Place • 3 bedrooms
Note: Performance varies based on location, size, amenities, seasonality, and management quality. Data reflects the past 12 months.
Top Performing Airbnb Hosts in San José (2025)
Learn from the best! This table showcases top-performing Airbnb hosts in San José based on the number of properties managed and estimated total revenue over the past year. Analyze their scale and performance metrics.
| Host Name | Properties | Grossing Revenue | Stay Reviews | Avg Rating |
|---|---|---|---|---|
| Marlen | 1 | $46,983 | 189 | 4.89/5.0 |
| Maria Jose | 1 | $42,017 | 127 | 4.95/5.0 |
| Ursula | 1 | $26,978 | 119 | 4.90/5.0 |
| Sergio | 2 | $17,501 | 82 | 4.84/5.0 |
| Gloriana | 2 | $16,865 | 874 | 4.91/5.0 |
| Len And Barbara | 1 | $16,823 | 11 | 4.55/5.0 |
| Cristina | 2 | $14,915 | 32 | 4.98/5.0 |
| Posada Las Palmas | 2 | $13,421 | 921 | 4.94/5.0 |
| Christian | 3 | $12,723 | 66 | 4.83/5.0 |
| Andrea | 1 | $12,217 | 12 | 5.00/5.0 |
Analyzing the strategies of top hosts, such as their property selection, pricing, and guest communication, can offer valuable lessons for optimizing your own Airbnb operations in San José.
Dive Deeper: Advanced San José STR Market Data (2025)
Ready to unlock more insights? AirROI provides access to advanced metrics and comprehensive Airbnb data for San José. Explore detailed analytics beyond this report to refine your investment strategy, optimize pricing, and maximize your vacation rental profits.
Explore Advanced MetricsSan José Short-Term Rental Market Composition (2025): Property & Room Types
Room Type Distribution
Property Type Distribution
Market Composition Insights for San José
- The San José Airbnb market composition is heavily skewed towards Entire Home/Apt listings, which make up 81.7% of the 60 active rentals. This indicates strong guest preference for privacy and space.
- Looking at the property type distribution in San José, House properties are the most common (43.3%), reflecting the local real estate landscape.
- Houses represent a significant 43.3% portion, catering likely to families or larger groups.
- The presence of 11.7% Hotel/Boutique listings indicates integration with traditional hospitality.
San José Airbnb Room Capacity Analysis (2025): Bedroom Distribution
Distribution of Listings by Number of Bedrooms
Room Capacity Insights for San José
- The dominant room capacity in San José is 1 bedroom listings, making up 43.3% of the market. This suggests a strong demand for properties suitable for couples or solo travelers.
- Together, 1 bedroom and 2 bedrooms properties represent 61.6% of the active Airbnb listings in San José, indicating a high concentration in these sizes.
- A significant 26.7% of listings offer 3+ bedrooms, catering to larger groups and families seeking more space in San José.
San José Vacation Rental Guest Capacity Trends (2025)
Distribution of Listings by Guest Capacity
Guest Capacity Insights for San José
- The most common guest capacity trend in San José vacation rentals is listings accommodating 2 guests (26.7%). This suggests the primary traveler segment is likely couples or solo travelers.
- Properties designed for 2 guests and 4 guests dominate the San José STR market, accounting for 46.7% of listings.
- 25.0% of properties accommodate 6+ guests, serving the market segment for larger families or group travel in San José.
- On average, properties in San José are equipped to host 3.6 guests.
San José Airbnb Booking Patterns (2025): Available vs. Booked Days
Available Days Distribution
Booked Days Distribution
Booking Pattern Insights for San José
- The most common availability pattern in San José falls within the 271-366 days range, representing 85% of listings. This suggests many properties have significant open periods on their calendars.
- Approximately 91.7% of listings show high availability (181+ days open annually), indicating potential for increased bookings or specific owner usage patterns.
- For booked days, the 31-90 days range is most frequent in San José (48.3%), reflecting common guest stay durations or potential owner blocking patterns.
- A notable 8.4% of properties secure long booking periods (181+ days booked per year), highlighting successful long-term rental strategies or significant owner usage.
San José Airbnb Minimum Stay Requirements Analysis
Distribution of Listings by Minimum Night Requirement
1 Night
47 listings
78.3% of total
2 Nights
7 listings
11.7% of total
3 Nights
1 listings
1.7% of total
4-6 Nights
1 listings
1.7% of total
30+ Nights
4 listings
6.7% of total
Key Insights
- The most prevalent minimum stay requirement in San José is 1 Night, adopted by 78.3% of listings. This highlights the market's preference for shorter, flexible bookings.
- A strong majority (90.0%) of the San José Airbnb data shows acceptance of very short stays (1-2 nights), indicating a dynamic, high-turnover market.
Recommendations
- Align with the market by considering a 1 Night minimum stay, as 78.3% of San José hosts use this setting.
- Explore offering discounts for stays of 30+ nights to attract the 6.7% of the market seeking extended stays.
- Adjust minimum nights based on seasonality – potentially shorter during low season and longer during peak demand periods in San José.
San José Airbnb Cancellation Policy Trends Analysis (2025)
Flexible
33 listings
55.9% of total
Moderate
13 listings
22% of total
Firm
12 listings
20.3% of total
Strict
1 listings
1.7% of total
Cancellation Policy Insights for San José
- The prevailing Airbnb cancellation policy trend in San José is Flexible, used by 55.9% of listings.
- The market strongly favors guest-friendly terms, with 77.9% of listings offering Flexible or Moderate policies. This suggests guests in San José may expect booking flexibility.
- Strict cancellation policies are quite rare (1.7%), potentially making listings with this policy less competitive unless justified by high demand or property type.
Recommendations for Hosts
- Consider adopting a Flexible policy to align with the 55.9% market standard in San José.
- Given the high prevalence of Flexible policies (55.9%), offering this can enhance booking appeal, especially during shoulder seasons.
- Using a Strict policy might deter some guests, as only 1.7% of listings use it. Evaluate if potential revenue protection outweighs possible lower booking rates.
- Regularly review your cancellation policy against competitors and market demand shifts in San José.
San José STR Booking Lead Time Analysis (2025)
Average Booking Lead Time by Month
Booking Lead Time Insights for San José
- The overall average booking lead time for vacation rentals in San José is 27 days.
- Guests book furthest in advance for stays during December (average 45 days), likely coinciding with peak travel demand or local events.
- The shortest booking windows occur for stays in April (average 24 days), indicating more last-minute travel plans during this time.
- Seasonally, Summer (39 days avg.) sees the longest lead times, while Spring (29 days avg.) has the shortest, reflecting typical travel planning cycles.
Recommendations for Hosts
- Use the overall average lead time (27 days) as a baseline for your pricing and availability strategy in San José.
- For December stays, consider implementing length-of-stay discounts or slightly higher rates for bookings made less than 45 days out to capitalize on advance planning.
- Target marketing efforts for the Summer season well in advance (at least 39 days) to capture early planners.
- Monitor your own booking lead times against these San José averages to identify opportunities for dynamic pricing adjustments.
Popular & Essential Airbnb Amenities in San José (2025)
Amenity Prevalence
Amenity Insights for San José
- Essential amenities in San José that guests expect include: Wifi. Lacking these (this) could significantly impact bookings.
- Popular amenities like TV, Free parking on premises, Hot water are common but not universal. Offering these can provide a competitive edge.
Recommendations for Hosts
- Ensure your listing includes all essential amenities for San José: Wifi.
- Prioritize adding missing essentials: Wifi.
- Consider adding popular differentiators like TV or Free parking on premises to increase appeal.
- Highlight unique or less common amenities you offer (e.g., hot tub, dedicated workspace, EV charger) in your listing description and photos.
- Regularly check competitor amenities in San José to stay competitive.
San José Airbnb Guest Demographics & Profile Analysis (2025)
Guest Profile Summary for San José
- The typical guest profile for Airbnb in San José consists of predominantly international visitors (75%), with top international origins including Costa Rica, typically belonging to the Post-2000s (Gen Z/Alpha) group (50%), primarily speaking English or Spanish.
- Domestic travelers account for 25.2% of guests.
- Key international markets include United States (40.3%) and Costa Rica (25.2%).
- Top languages spoken are English (43.8%) followed by Spanish (34.3%).
- A significant demographic segment is the Post-2000s (Gen Z/Alpha) group, representing 50% of guests.
Recommendations for Hosts
- Focus marketing internationally, particularly towards travelers from Costa Rica.
- Tailor amenities and listing descriptions to appeal to the dominant Post-2000s (Gen Z/Alpha) demographic (e.g., highlight fast WiFi, smart home features, local guides).
- Highlight unique local experiences or amenities relevant to the primary guest profile.
- Consider seasonal promotions aligned with peak travel times for key origin markets.
Nearby Short-Term Rental Market Comparison
How does the San José Airbnb market stack up against its neighbors? Compare key performance metrics like average monthly revenue, ADR, and occupancy rates in surrounding areas to understand the broader regional STR landscape.
| Market | Active Properties | Monthly Revenue | Daily Rate | Avg. Occupancy |
|---|---|---|---|---|
| Nacascolo | 32 | $7,159 | $1165.34 | 35% |
| Pinilla | 74 | $5,903 | $615.77 | 37% |
| Playa Tamarindo | 21 | $5,694 | $409.60 | 48% |
| Playa Langosta | 164 | $4,968 | $497.33 | 42% |
| Punta Islita | 28 | $4,963 | $551.73 | 37% |
| Tamarindo | 1,232 | $4,671 | $411.22 | 44% |
| Cabo Velas | 944 | $3,808 | $400.71 | 40% |
| Nosara | 864 | $3,759 | $433.44 | 42% |
| Tempate | 698 | $3,352 | $398.13 | 38% |
| Quepos | 1,125 | $2,927 | $258.22 | 41% |