La Palmera Airbnb Market Analysis 2026: Short Term Rental Data & Vacation Rental Statistics in Alajuela Province, Costa Rica
Is Airbnb profitable in La Palmera in 2026? Explore comprehensive Airbnb analytics for La Palmera, Alajuela Province, Costa Rica to uncover income potential. This 2026 STR market report for La Palmera, based on AirROI data from February 2025 to January 2026, reveals key trends in the niche market of 23 active listings.
Whether you're considering an Airbnb investment in La Palmera, optimizing your existing vacation rental, or exploring rental arbitrage opportunities, understanding the La Palmera Airbnb data is crucial. Leveraging the low regulation environment is key to maximizing your short term rental income potential. Let's dive into the specifics.
Key La Palmera Airbnb Performance Metrics Overview
Monthly Airbnb Revenue Variations & Income Potential in La Palmera (2026)
Understanding the monthly revenue variations for Airbnb listings in La Palmera is key to maximizing your short term rental income potential. Seasonality significantly impacts earnings. Our analysis, based on data from the past 12 months, shows that the peak revenue month for STRs in La Palmera is typically February, while October often presents the lowest earnings, highlighting opportunities for strategic pricing adjustments during shoulder and low seasons. Explore the typical Airbnb income in La Palmera across different performance tiers:
- Best-in-class properties (Top 10%) achieve $2,271+ monthly, often utilizing dynamic pricing and superior guest experiences.
- Strong performing properties (Top 25%) earn $1,628 or more, indicating effective management and desirable locations/amenities.
- Typical properties (Median) generate around $742 per month, representing the average market performance.
- Entry-level properties (Bottom 25%) see earnings around $326, often with potential for optimization.
Average Monthly Airbnb Earnings Trend in La Palmera
La Palmera Airbnb Occupancy Rate Trends (2026)
Maximize your bookings by understanding the La Palmera STR occupancy trends. Seasonal demand shifts significantly influence how often properties are booked. Typically, Februarysees the highest demand (peak season occupancy), while October experiences the lowest (low season). Effective strategies, like adjusting minimum stays or offering promotions, can boost occupancy during slower periods. Here's how different property tiers perform in La Palmera:
- Best-in-class properties (Top 10%) achieve 62%+ occupancy, indicating high desirability and potentially optimized availability.
- Strong performing properties (Top 25%) maintain 46% or higher occupancy, suggesting good market fit and guest satisfaction.
- Typical properties (Median) have an occupancy rate around 26%.
- Entry-level properties (Bottom 25%) average 12% occupancy, potentially facing higher vacancy.
Average Monthly Occupancy Rate Trend in La Palmera
Average Daily Rate (ADR) Airbnb Trends in La Palmera (2026)
Effective short term rental pricing strategy in La Palmera involves understanding monthly ADR fluctuations. The Average Daily Rate (ADR) for Airbnb in La Palmera typically peaks in December and dips lowest during March. Leveraging Airbnb dynamic pricing tools or strategies based on this seasonality can significantly boost revenue. Here's a look at the typical nightly rates achieved:
- Best-in-class properties (Top 10%) command rates of $146+ per night, often due to premium features or locations.
- Strong performing properties (Top 25%) achieve nightly rates of $116 or more.
- Typical properties (Median) charge around $91 per night.
- Entry-level properties (Bottom 25%) earn around $65 per night.
Average Daily Rate (ADR) Trend by Month in La Palmera
Get Live La Palmera Market Intelligence 👇

Explore Real-time Analytics
Airbnb Seasonality Analysis & Trends in La Palmera (2026)
Peak Season (February, March, April)
- Revenue averages $1,296 per month
- Occupancy rates average 38.8%
- Daily rates average $100
Shoulder Season
- Revenue averages $1,116 per month
- Occupancy maintains around 32.1%
- Daily rates hold near $111
Low Season (May, September, October)
- Revenue drops to average $636 per month
- Occupancy decreases to average 20.5%
- Daily rates adjust to average $109
Seasonality Insights for La Palmera
- The Airbnb seasonality in La Palmera shows highly seasonal trends requiring careful strategy. While the sections above show seasonal averages, it's also insightful to look at the extremes:
- During the high season, the absolute peak month showcases La Palmera's highest earning potential, with monthly revenues capable of climbing to $1,346, occupancy reaching a high of 41.1%, and ADRs peaking at $117.
- Conversely, the slowest single month of the year, typically falling within the low season, marks the market's lowest point. In this month, revenue might dip to $573, occupancy could drop to 18.6%, and ADRs may adjust down to $99.
- Understanding both the seasonal averages and these monthly peaks and troughs in revenue, occupancy, and ADR is crucial for maximizing your Airbnb profit potential in La Palmera.
Seasonal Strategies for Maximizing Profit
- Peak Season: Maximize revenue through premium pricing and potentially longer minimum stays. Ensure high availability.
- Low Season: Offer competitive pricing, special promotions (e.g., extended stay discounts), and flexible cancellation policies. Target off-season travelers like remote workers or budget-conscious guests.
- Shoulder Seasons: Implement dynamic pricing that balances peak and low rates. Target weekend travelers or specific events. Offer slightly more flexible terms than peak season.
- Regularly analyze your own performance against these La Palmera seasonality benchmarks and adjust your pricing and availability strategy accordingly.
Best Areas for Airbnb Investment in La Palmera (2026)
Exploring the top neighborhoods for short-term rentals in La Palmera? This section highlights key areas, outlining why they are attractive for hosts and guests, along with notable local attractions. Consider these locations based on your target guest profile and investment strategy.
| Neighborhood / Area | Why Host Here? (Target Guests & Appeal) | Key Attractions & Landmarks |
|---|---|---|
| La Fortuna | Famous for the Arenal Volcano and hot springs, La Fortuna is a top destination for nature lovers and adventure seekers. Visitors enjoy activities like hiking, waterfall tours, and zip-lining. | Arenal Volcano National Park, La Fortuna Waterfall, Tabacon Hot Springs, Arenal Lake, Mistico Arenal Hanging Bridges Park |
| Monteverde | Known for its lush cloud forests and biodiversity, Monteverde attracts eco-tourists and bird watchers. The unique climate and landscape offer a range of outdoor activities. | Monteverde Cloud Forest Reserve, Sky Adventures Park, Monteverde Butterfly Gardens, Suspension Bridges, Santa Elena Cloud Forest |
| Tamarindo | A vibrant beach town with a lively atmosphere, Tamarindo is popular for surfing and nightlife. It offers a laid-back vibe along with plenty of dining and entertainment options. | Tamarindo Beach, Playa Grande, Las Baulas National Marine Park, Surfing Classes, Nightlife and Bars |
| Jaco | Known for its surfing beaches and nightlife, Jaco is a favorite among beach-goers and those looking for an active vacation. It has a variety of restaurants and entertainment options. | Jaco Beach, Rainforest Adventures, Carara National Park, Jaco Walk, Surf Lessons |
| _Cahuita_ | A laid-back Caribbean coastal town famous for its national park and coral reefs. It’s great for snorkeling, hiking, and enjoying local Afro-Caribbean culture. | Cahuita National Park, Cahuita Beach, Snorkeling Tours, Local Restaurants, Wildlife Spotting |
| _Puerto Viejo_ | A popular tourist destination known for its beautiful beaches, vibrant culture, and nightlife. It attracts surfers, backpackers, and those looking to relax. | Puerto Viejo Beach, Cocles Beach, Gandoca-Manzanillo National Wildlife Refuge, Nightlife, Local Markets |
| _San José_ | The capital city of Costa Rica, offering cultural attractions, museums, and a vibrant urban scene. A great base for exploring the wider country. | National Museum of Costa Rica, Pre-Columbian Gold Museum, Teatro Nacional, Central Market, Barrio Escalante |
| _Guancaste_ | Famous for its beautiful beaches and national parks, Guanacaste is a great destination for those looking for relaxation and adventure in nature. | Rincón de la Vieja National Park, Playa Conchal, Playa Flamingo, Santa Rosa National Park, Wildlife Viewing |
Understanding Airbnb License Requirements & STR Laws in La Palmera (2026)
While La Palmera, Alajuela Province, Costa Rica currently shows low STR regulations, specific Airbnb license requirements might still exist or change. Always verify the latest short term rental regulations and Airbnb license requirements directly with local government authorities for La Palmera to ensure full compliance before hosting.
(Source: AirROI data, 2026, finding no licensed listings among those analyzed)
Top Performing Airbnb Properties in La Palmera (2026)
Benchmark your potential! Explore examples of top-performing Airbnb properties in La Palmerabased on Trailing Twelve Month (TTM) revenue. Analyze their characteristics, revenue, occupancy rate, and ADR to understand what drives success in this market.
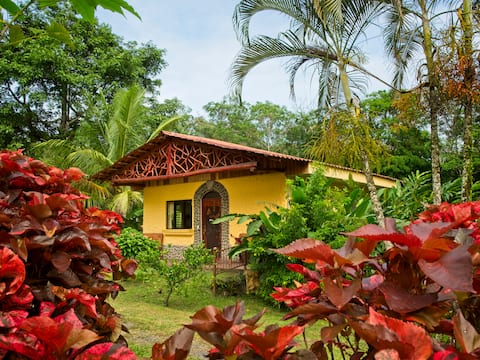
Colibri Rainforest Casita with Hot Springs
Entire Place • 2 bedrooms

Rainforest Tree House with Hot Springs.
Entire Place • 2 bedrooms
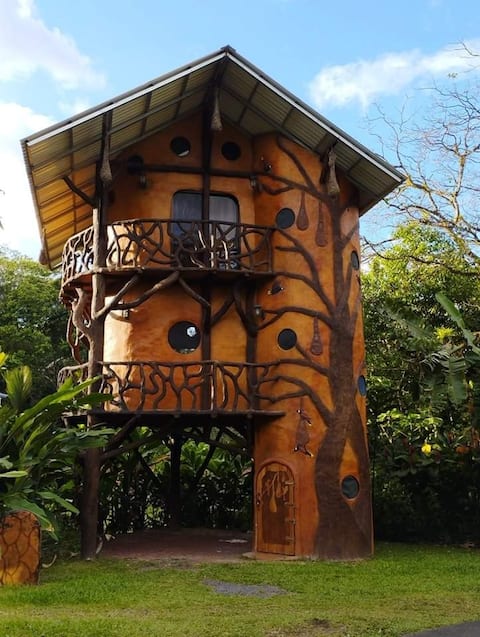
Tree House Oropendula with Hotsprings
Entire Place • 1 bedroom
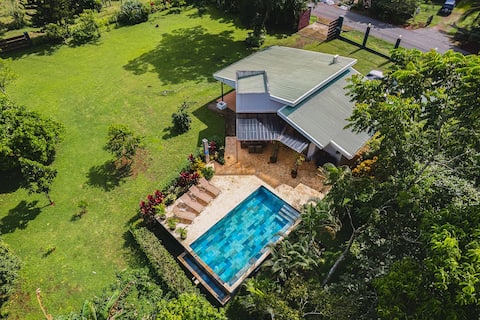
Casa Anajade
Entire Place • 3 bedrooms
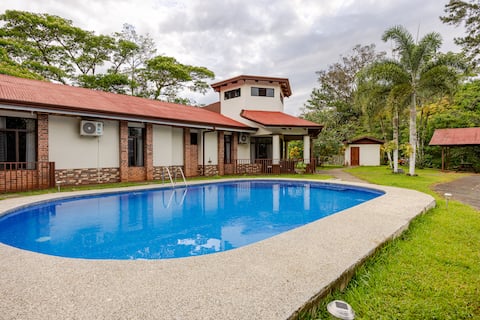
Casa Mia Muelle de San Carlos
Entire Place • 5 bedrooms

Magical Jungle Tree House with Hot Springs.
Entire Place • 1 bedroom
Note: Performance varies based on location, size, amenities, seasonality, and management quality. Data reflects the past 12 months.
Top Performing Airbnb Hosts in La Palmera (2026)
Learn from the best! This table showcases top-performing Airbnb hosts in La Palmera based on the number of properties managed and estimated total revenue over the past year. Analyze their scale and performance metrics.
| Host Name | Properties | Grossing Revenue | Stay Reviews | Avg Rating |
|---|---|---|---|---|
| Kathy & Bernie | 6 | $121,613 | 2245 | 4.87/5.0 |
| Jason | 1 | $21,979 | 60 | 4.88/5.0 |
| Marvin | 1 | $18,583 | 19 | 4.84/5.0 |
| Jorge Eduardo | 1 | $10,012 | 58 | 4.81/5.0 |
| Michael | 1 | $8,825 | 29 | 4.97/5.0 |
| Judith Vanessa | 1 | $4,955 | 54 | 4.89/5.0 |
| Mari | 1 | $4,917 | 2 | Not Rated |
| Alejandro | 1 | $4,312 | 79 | 4.91/5.0 |
| Maria Fernanda | 1 | $4,014 | 20 | 4.95/5.0 |
| Nela | 2 | $3,993 | 12 | 5.00/5.0 |
Analyzing the strategies of top hosts, such as their property selection, pricing, and guest communication, can offer valuable lessons for optimizing your own Airbnb operations in La Palmera.
Dive Deeper: Advanced La Palmera STR Market Data (2026)
Ready to unlock more insights? AirROI provides access to advanced metrics and comprehensive Airbnb data for La Palmera. Explore detailed analytics beyond this report to refine your investment strategy, optimize pricing, and maximize your vacation rental profits.
Explore Advanced MetricsLa Palmera Short-Term Rental Market Composition (2026): Property & Room Types
Room Type Distribution
Property Type Distribution
Market Composition Insights for La Palmera
- The La Palmera Airbnb market composition is heavily skewed towards Entire Home/Apt listings, which make up 100% of the 23 active rentals. This indicates strong guest preference for privacy and space.
- Looking at the property type distribution in La Palmera, House properties are the most common (47.8%), reflecting the local real estate landscape.
- Houses represent a significant 47.8% portion, catering likely to families or larger groups.
- Smaller segments like apartment/condo (combined 4.3%) offer potential for unique stay experiences.
La Palmera Airbnb Room Capacity Analysis (2026): Bedroom Distribution
Distribution of Listings by Number of Bedrooms
Room Capacity Insights for La Palmera
- The dominant room capacity in La Palmera is 1 bedroom listings, making up 39.1% of the market. This suggests a strong demand for properties suitable for couples or solo travelers.
- Together, 1 bedroom and 2 bedrooms properties represent 73.9% of the active Airbnb listings in La Palmera, indicating a high concentration in these sizes.
- A significant 26.0% of listings offer 3+ bedrooms, catering to larger groups and families seeking more space in La Palmera.
La Palmera Vacation Rental Guest Capacity Trends (2026)
Distribution of Listings by Guest Capacity
Guest Capacity Insights for La Palmera
- The most common guest capacity trend in La Palmera vacation rentals is listings accommodating 8+ guests (26.1%). This suggests the primary traveler segment is likely larger groups.
- Properties designed for 8+ guests and 5 guests dominate the La Palmera STR market, accounting for 47.8% of listings.
- 39.1% of properties accommodate 6+ guests, serving the market segment for larger families or group travel in La Palmera.
- On average, properties in La Palmera are equipped to host 5.3 guests.
La Palmera Airbnb Booking Patterns (2026): Available vs. Booked Days
Available Days Distribution
Booked Days Distribution
Booking Pattern Insights for La Palmera
- The most common availability pattern in La Palmera falls within the 271-366 days range, representing 69.6% of listings. This suggests many properties have significant open periods on their calendars.
- Approximately 87.0% of listings show high availability (181+ days open annually), indicating potential for increased bookings or specific owner usage patterns.
- For booked days, the 31-90 days range is most frequent in La Palmera (47.8%), reflecting common guest stay durations or potential owner blocking patterns.
- A notable 13.0% of properties secure long booking periods (181+ days booked per year), highlighting successful long-term rental strategies or significant owner usage.
La Palmera Airbnb Minimum Stay Requirements Analysis
Distribution of Listings by Minimum Night Requirement
1 Night
13 listings
56.5% of total
2 Nights
9 listings
39.1% of total
30+ Nights
1 listings
4.3% of total
Key Insights
- The most prevalent minimum stay requirement in La Palmera is 1 Night, adopted by 56.5% of listings. This highlights the market's preference for shorter, flexible bookings.
- A strong majority (95.6%) of the La Palmera Airbnb data shows acceptance of very short stays (1-2 nights), indicating a dynamic, high-turnover market.
Recommendations
- Align with the market by considering a 1 Night minimum stay, as 56.5% of La Palmera hosts use this setting.
- Adjust minimum nights based on seasonality – potentially shorter during low season and longer during peak demand periods in La Palmera.
La Palmera Airbnb Cancellation Policy Trends Analysis (2026)
Limited
1 listings
4.3% of total
Flexible
6 listings
26.1% of total
Moderate
7 listings
30.4% of total
Firm
2 listings
8.7% of total
Strict
7 listings
30.4% of total
Cancellation Policy Insights for La Palmera
- The prevailing Airbnb cancellation policy trend in La Palmera is Moderate, used by 30.4% of listings.
- There's a relatively balanced mix between guest-friendly (56.5%) and stricter (39.1%) policies, offering choices for different guest needs.
Recommendations for Hosts
- Consider adopting a Moderate policy to align with the 30.4% market standard in La Palmera.
- With 30.4% using Strict terms, this is a viable option in La Palmera, particularly for high-value properties or during peak demand periods.
- Regularly review your cancellation policy against competitors and market demand shifts in La Palmera.
La Palmera STR Booking Lead Time Analysis (2026)
Average Booking Lead Time by Month
Booking Lead Time Insights for La Palmera
- The overall average booking lead time for vacation rentals in La Palmera is 28 days.
- Guests book furthest in advance for stays during December (average 56 days), likely coinciding with peak travel demand or local events.
- The shortest booking windows occur for stays in October (average 15 days), indicating more last-minute travel plans during this time.
- Seasonally, Winter (46 days avg.) sees the longest lead times, while Fall (23 days avg.) has the shortest, reflecting typical travel planning cycles.
Recommendations for Hosts
- Use the overall average lead time (28 days) as a baseline for your pricing and availability strategy in La Palmera.
- For December stays, consider implementing length-of-stay discounts or slightly higher rates for bookings made less than 56 days out to capitalize on advance planning.
- Target marketing efforts for the Winter season well in advance (at least 46 days) to capture early planners.
- Monitor your own booking lead times against these La Palmera averages to identify opportunities for dynamic pricing adjustments.
Popular & Essential Airbnb Amenities in La Palmera (2026)
Amenity Prevalence
Amenity Insights for La Palmera
- Essential amenities in La Palmera that guests expect include: Free parking on premises, Wifi. Lacking these (any) could significantly impact bookings.
- Popular amenities like Dishes and silverware, Cooking basics, Hot water are common but not universal. Offering these can provide a competitive edge.
Recommendations for Hosts
- Ensure your listing includes all essential amenities for La Palmera: Free parking on premises, Wifi.
- Consider adding popular differentiators like Dishes and silverware or Cooking basics to increase appeal.
- Highlight unique or less common amenities you offer (e.g., hot tub, dedicated workspace, EV charger) in your listing description and photos.
- Regularly check competitor amenities in La Palmera to stay competitive.
La Palmera Airbnb Guest Demographics & Profile Analysis (2026)
Guest Profile Summary for La Palmera
- The typical guest profile for Airbnb in La Palmera consists of predominantly international visitors (70%), with top international origins including Costa Rica, typically belonging to the Post-2000s (Gen Z/Alpha) group (50%), primarily speaking English or Spanish.
- Domestic travelers account for 30.3% of guests.
- Key international markets include United States (46.7%) and Costa Rica (30.3%).
- Top languages spoken are English (47.4%) followed by Spanish (29.2%).
- A significant demographic segment is the Post-2000s (Gen Z/Alpha) group, representing 50% of guests.
Recommendations for Hosts
- Focus marketing internationally, particularly towards travelers from Costa Rica.
- Tailor amenities and listing descriptions to appeal to the dominant Post-2000s (Gen Z/Alpha) demographic (e.g., highlight fast WiFi, smart home features, local guides).
- Highlight unique local experiences or amenities relevant to the primary guest profile.
- Consider seasonal promotions aligned with peak travel times for key origin markets.
Nearby Short-Term Rental Market Comparison
How does the La Palmera Airbnb market stack up against its neighbors? Compare key performance metrics like average monthly revenue, ADR, and occupancy rates in surrounding areas to understand the broader regional STR landscape.
| Market | Active Properties | Monthly Revenue | Daily Rate | Avg. Occupancy |
|---|---|---|---|---|
| Nacascolo | 32 | $6,132 | $1145.14 | 33% |
| Pinilla | 91 | $4,982 | $544.03 | 35% |
| Playa Tamarindo | 21 | $4,869 | $404.48 | 44% |
| Playa Langosta | 163 | $4,380 | $474.00 | 39% |
| Punta Islita | 27 | $4,193 | $518.64 | 36% |
| Tamarindo | 1,302 | $3,897 | $386.82 | 41% |
| Osa | 10 | $3,418 | $586.45 | 32% |
| Cabo Velas | 922 | $3,316 | $381.01 | 38% |
| Playa Grande | 33 | $3,195 | $397.35 | 40% |
| Nosara | 873 | $3,169 | $421.13 | 39% |