Sai Kung District Airbnb Market Analysis 2026: Short Term Rental Data & Vacation Rental Statistics in Hong Kong, China
Is Airbnb profitable in Sai Kung District in 2026? Explore comprehensive Airbnb analytics for Sai Kung District, Hong Kong, China to uncover income potential. This 2026 STR market report for Sai Kung District, based on AirROI data from February 2025 to January 2026, reveals key trends in the niche market of 29 active listings.
Whether you're considering an Airbnb investment in Sai Kung District, optimizing your existing vacation rental, or exploring rental arbitrage opportunities, understanding the Sai Kung District Airbnb data is crucial. Understanding the local regulations is key to maximizing your short term rental income potential. Let's dive into the specifics.
Key Sai Kung District Airbnb Performance Metrics Overview
Monthly Airbnb Revenue Variations & Income Potential in Sai Kung District (2026)
Understanding the monthly revenue variations for Airbnb listings in Sai Kung District is key to maximizing your short term rental income potential. Seasonality significantly impacts earnings. Our analysis, based on data from the past 12 months, shows that the peak revenue month for STRs in Sai Kung District is typically November, while July often presents the lowest earnings, highlighting opportunities for strategic pricing adjustments during shoulder and low seasons. Explore the typical Airbnb income in Sai Kung District across different performance tiers:
- Best-in-class properties (Top 10%) achieve $4,589+ monthly, often utilizing dynamic pricing and superior guest experiences.
- Strong performing properties (Top 25%) earn $2,313 or more, indicating effective management and desirable locations/amenities.
- Typical properties (Median) generate around $900 per month, representing the average market performance.
- Entry-level properties (Bottom 25%) see earnings around $593, often with potential for optimization.
Average Monthly Airbnb Earnings Trend in Sai Kung District
Sai Kung District Airbnb Occupancy Rate Trends (2026)
Maximize your bookings by understanding the Sai Kung District STR occupancy trends. Seasonal demand shifts significantly influence how often properties are booked. Typically, Novembersees the highest demand (peak season occupancy), while September experiences the lowest (low season). Effective strategies, like adjusting minimum stays or offering promotions, can boost occupancy during slower periods. Here's how different property tiers perform in Sai Kung District:
- Best-in-class properties (Top 10%) achieve 75%+ occupancy, indicating high desirability and potentially optimized availability.
- Strong performing properties (Top 25%) maintain 44% or higher occupancy, suggesting good market fit and guest satisfaction.
- Typical properties (Median) have an occupancy rate around 25%.
- Entry-level properties (Bottom 25%) average 14% occupancy, potentially facing higher vacancy.
Average Monthly Occupancy Rate Trend in Sai Kung District
Average Daily Rate (ADR) Airbnb Trends in Sai Kung District (2026)
Effective short term rental pricing strategy in Sai Kung District involves understanding monthly ADR fluctuations. The Average Daily Rate (ADR) for Airbnb in Sai Kung District typically peaks in October and dips lowest during April. Leveraging Airbnb dynamic pricing tools or strategies based on this seasonality can significantly boost revenue. Here's a look at the typical nightly rates achieved:
- Best-in-class properties (Top 10%) command rates of $317+ per night, often due to premium features or locations.
- Strong performing properties (Top 25%) achieve nightly rates of $216 or more.
- Typical properties (Median) charge around $111 per night.
- Entry-level properties (Bottom 25%) earn around $54 per night.
Average Daily Rate (ADR) Trend by Month in Sai Kung District
Get Live Sai Kung District Market Intelligence 👇
Explore Real-time Analytics
Airbnb Seasonality Analysis & Trends in Sai Kung District (2026)
Peak Season (November, January, April)
- Revenue averages $3,053 per month
- Occupancy rates average 43.5%
- Daily rates average $174
Shoulder Season
- Revenue averages $1,444 per month
- Occupancy maintains around 33.5%
- Daily rates hold near $165
Low Season (July, September, October)
- Revenue drops to average $547 per month
- Occupancy decreases to average 12.1%
- Daily rates adjust to average $173
Seasonality Insights for Sai Kung District
- The Airbnb seasonality in Sai Kung District shows highly seasonal trends requiring careful strategy. While the sections above show seasonal averages, it's also insightful to look at the extremes:
- During the high season, the absolute peak month showcases Sai Kung District's highest earning potential, with monthly revenues capable of climbing to $4,720, occupancy reaching a high of 53.4%, and ADRs peaking at $182.
- Conversely, the slowest single month of the year, typically falling within the low season, marks the market's lowest point. In this month, revenue might dip to $0, occupancy could drop to 0.0%, and ADRs may adjust down to $159.
- Understanding both the seasonal averages and these monthly peaks and troughs in revenue, occupancy, and ADR is crucial for maximizing your Airbnb profit potential in Sai Kung District.
Seasonal Strategies for Maximizing Profit
- Peak Season: Maximize revenue through premium pricing and potentially longer minimum stays. Ensure high availability.
- Low Season: Offer competitive pricing, special promotions (e.g., extended stay discounts), and flexible cancellation policies. Target off-season travelers like remote workers or budget-conscious guests.
- Shoulder Seasons: Implement dynamic pricing that balances peak and low rates. Target weekend travelers or specific events. Offer slightly more flexible terms than peak season.
- Regularly analyze your own performance against these Sai Kung District seasonality benchmarks and adjust your pricing and availability strategy accordingly.
Best Areas for Airbnb Investment in Sai Kung District (2026)
Exploring the top neighborhoods for short-term rentals in Sai Kung District? This section highlights key areas, outlining why they are attractive for hosts and guests, along with notable local attractions. Consider these locations based on your target guest profile and investment strategy.
| Neighborhood / Area | Why Host Here? (Target Guests & Appeal) | Key Attractions & Landmarks |
|---|---|---|
| Sai Kung Town | Vibrant town known for its bustling markets, waterfront dining, and beautiful beaches. A popular spot for both locals and tourists looking to explore nature and enjoy water sports. | Sai Kung Promenade, Sai Kung Seafood Market, High Island Reservoir, Tai Long Wan, Sharp Island |
| Clear Water Bay | A serene coastal area with lovely beaches and scenic views. Ideal for those seeking a relaxing getaway close to nature while being within reach of Hong Kong's bustling city life. | Clear Water Bay Beach, Clear Water Bay Country Park, Lantau Trail, Hiking Trails, Local Seafood Restaurants |
| Sai Kung East Country Park | Famous for its natural beauty and hiking trails, this area attracts outdoor enthusiasts and nature lovers. It's excellent for eco-tourism and offers stunning coastal scenery. | Hiking Trails, Secluded Beaches, Geopark, Scenic Views, Kayaking Opportunities |
| Tai Long Wan | A beautiful bay known for its stunning beaches and hiking routes. Perfect for attracting beach lovers and hikers looking for adventure in nature. | Tai Long Wan Beach, Hiking Trails, Scenic Lookouts, Relaxation Spots, Camping Opportunities |
| Yung Shue O | A quaint fishing village known for its peaceful environment and proximity to hiking trails. Attracts those looking for an authentic Hong Kong experience. | Fishing Village, Tranquil Beaches, Hiking Trails, Local Seafood, Cultural Heritage Sites |
| Kau Sai Chau | An island renowned for golfing and hiking, providing stunning views and a tranquil setting. This is an attractive getaway for those who enjoy outdoor activities and exclusivity. | Kau Sai Chau Golf Course, Hiking Trails, Beach Access, Nature Viewing, Marine Life |
| Tap Mun | A less crowded island that offers tranquility and natural beauty. Great for those seeking a peaceful retreat or a connection with nature away from the hustle of the city. | Quiet Beaches, Hiking Paths, Picnic Spots, Fishing, Scenic Views |
| Pak Sha Wan | A charming area with a traditional fishing village vibe. It’s an inviting spot for visitors interested in local culture, seafood, and waterfront activities. | Fishing Boat Views, Local Seafood Restaurants, Cultural Experiences, Walking Trails, Beautiful Harbor |
Understanding Airbnb License Requirements & STR Laws in Sai Kung District (2026)
With 17% of listings showing registration in 2026, understanding potential Airbnb license requirements is crucial in Sai Kung District. Always verify the latest short term rental regulations and Airbnb license requirements directly with local government authorities for Sai Kung District to ensure full compliance before hosting.
(Source: AirROI data, 2026, based on 17% licensed listings)
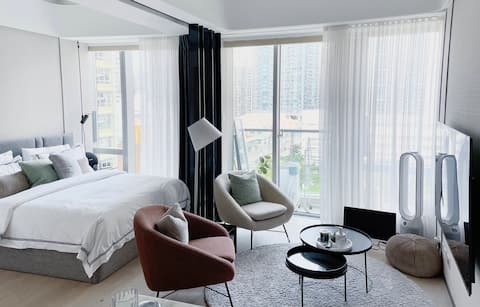
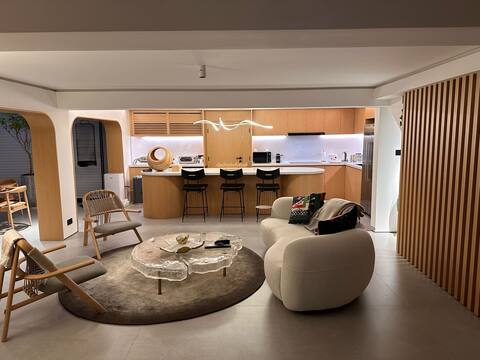
Top Performing Airbnb Properties in Sai Kung District (2026)
Benchmark your potential! Explore examples of top-performing Airbnb properties in Sai Kung Districtbased on Trailing Twelve Month (TTM) revenue. Analyze their characteristics, revenue, occupancy rate, and ADR to understand what drives success in this market.

Lake House with stunning sea view in Sai Kung
Entire Place • 3 bedrooms

Cottage-style flat in Sai Kung
Entire Place • 2 bedrooms
Amazing Garden View Suite
Entire Place • N/A

Beautiful private apartment
Entire Place • 4 bedrooms
Beach-Front Sai Kung Castle
Entire Place • 3 bedrooms

Sailing Yacht Serendipity
Entire Place • 2 bedrooms
Note: Performance varies based on location, size, amenities, seasonality, and management quality. Data reflects the past 12 months.
Top Performing Airbnb Hosts in Sai Kung District (2026)
Learn from the best! This table showcases top-performing Airbnb hosts in Sai Kung District based on the number of properties managed and estimated total revenue over the past year. Analyze their scale and performance metrics.
| Host Name | Properties | Grossing Revenue | Stay Reviews | Avg Rating |
|---|---|---|---|---|
| Jean-Pierre | 1 | $32,501 | 30 | 4.83/5.0 |
| Rebekka | 1 | $22,468 | 287 | 4.68/5.0 |
| Alan | 1 | $19,437 | 14 | 4.86/5.0 |
| Haleema Wadood | 2 | $19,388 | 22 | 3.75/5.0 |
| Host #450750524 | 2 | $14,288 | 0 | Not Rated |
| Host #458625122 | 1 | $12,259 | 0 | Not Rated |
| Rye | 2 | $10,191 | 55 | 5.00/5.0 |
| Nina | 1 | $7,389 | 15 | 5.00/5.0 |
| Host #514494953 | 1 | $6,543 | 10 | Not Rated |
| Host #16943365 | 1 | $5,507 | 0 | Not Rated |
Analyzing the strategies of top hosts, such as their property selection, pricing, and guest communication, can offer valuable lessons for optimizing your own Airbnb operations in Sai Kung District.
Dive Deeper: Advanced Sai Kung District STR Market Data (2026)
Ready to unlock more insights? AirROI provides access to advanced metrics and comprehensive Airbnb data for Sai Kung District. Explore detailed analytics beyond this report to refine your investment strategy, optimize pricing, and maximize your vacation rental profits.
Explore Advanced MetricsSai Kung District Short-Term Rental Market Composition (2026): Property & Room Types
Room Type Distribution
Property Type Distribution
Market Composition Insights for Sai Kung District
- The Sai Kung District Airbnb market composition is heavily skewed towards Entire Home/Apt listings, which make up 62.1% of the 29 active rentals. This indicates strong guest preference for privacy and space.
- However, a notable 37.9% share for Private Rooms suggests opportunities for budget-conscious travelers or hosts renting out spare rooms.
- Looking at the property type distribution in Sai Kung District, Apartment/Condo properties are the most common (75.9%), reflecting the local real estate landscape.
- Houses represent a significant 17.2% portion, catering likely to families or larger groups.
- Smaller segments like outdoor/unique, hotel/boutique (combined 6.8%) offer potential for unique stay experiences.
Sai Kung District Airbnb Room Capacity Analysis (2026): Bedroom Distribution
Distribution of Listings by Number of Bedrooms
Room Capacity Insights for Sai Kung District
- The dominant room capacity in Sai Kung District is 2 bedrooms listings, making up 27.6% of the market. This suggests a strong demand for properties suitable for couples or solo travelers.
- Together, 2 bedrooms and 1 bedroom properties represent 51.7% of the active Airbnb listings in Sai Kung District, indicating a high concentration in these sizes.
- A significant 24.1% of listings offer 3+ bedrooms, catering to larger groups and families seeking more space in Sai Kung District.
Sai Kung District Vacation Rental Guest Capacity Trends (2026)
Distribution of Listings by Guest Capacity
Guest Capacity Insights for Sai Kung District
- The most common guest capacity trend in Sai Kung District vacation rentals is listings accommodating 4 guests (17.2%). This suggests the primary traveler segment is likely small families or groups.
- Properties designed for 4 guests and 5 guests dominate the Sai Kung District STR market, accounting for 31.0% of listings.
- 17.2% of properties accommodate 6+ guests, serving the market segment for larger families or group travel in Sai Kung District.
- On average, properties in Sai Kung District are equipped to host 3.2 guests.
Sai Kung District Airbnb Booking Patterns (2026): Available vs. Booked Days
Available Days Distribution
Booked Days Distribution
Booking Pattern Insights for Sai Kung District
- The most common availability pattern in Sai Kung District falls within the 271-366 days range, representing 82.8% of listings. This suggests many properties have significant open periods on their calendars.
- Approximately 100.0% of listings show high availability (181+ days open annually), indicating potential for increased bookings or specific owner usage patterns.
- For booked days, the 1-30 days range is most frequent in Sai Kung District (44.8%), reflecting common guest stay durations or potential owner blocking patterns.
Sai Kung District Airbnb Minimum Stay Requirements Analysis
Distribution of Listings by Minimum Night Requirement
1 Night
8 listings
27.6% of total
2 Nights
7 listings
24.1% of total
3 Nights
1 listings
3.4% of total
4-6 Nights
1 listings
3.4% of total
7-29 Nights
9 listings
31% of total
30+ Nights
3 listings
10.3% of total
Key Insights
- The most prevalent minimum stay requirement in Sai Kung District is 7-29 Nights, adopted by 31% of listings. This highlights the market's preference for shorter, flexible bookings.
- A significant segment (10.3%) caters to monthly stays (30+ nights) in Sai Kung District, pointing to opportunities in the extended-stay market.
Recommendations
- Align with the market by considering a 7-29 Nights minimum stay, as 31% of Sai Kung District hosts use this setting.
- If feasible, allowing 1-night stays, especially midweek or during low season, could capture last-minute bookings, as only 27.6% currently do.
- Explore offering discounts for stays of 30+ nights to attract the 10.3% of the market seeking extended stays.
- Adjust minimum nights based on seasonality – potentially shorter during low season and longer during peak demand periods in Sai Kung District.
Sai Kung District Airbnb Cancellation Policy Trends Analysis (2026)
Flexible
4 listings
17.4% of total
Moderate
3 listings
13% of total
Firm
14 listings
60.9% of total
Strict
2 listings
8.7% of total
Cancellation Policy Insights for Sai Kung District
- The prevailing Airbnb cancellation policy trend in Sai Kung District is Firm, used by 60.9% of listings.
- A majority (69.6%) of hosts in Sai Kung District utilize Firm or Strict policies, indicating a market where hosts prioritize booking security.
- Strict cancellation policies are quite rare (8.7%), potentially making listings with this policy less competitive unless justified by high demand or property type.
Recommendations for Hosts
- Consider adopting a Firm policy to align with the 60.9% market standard in Sai Kung District.
- Using a Strict policy might deter some guests, as only 8.7% of listings use it. Evaluate if potential revenue protection outweighs possible lower booking rates.
- Regularly review your cancellation policy against competitors and market demand shifts in Sai Kung District.
Sai Kung District STR Booking Lead Time Analysis (2026)
Average Booking Lead Time by Month
Booking Lead Time Insights for Sai Kung District
- The overall average booking lead time for vacation rentals in Sai Kung District is 30 days.
- Guests book furthest in advance for stays during November (average 292 days), likely coinciding with peak travel demand or local events.
- The shortest booking windows occur for stays in October (average 0 days), indicating more last-minute travel plans during this time.
- Seasonally, Fall (147 days avg.) sees the longest lead times, while Winter (16 days avg.) has the shortest, reflecting typical travel planning cycles.
Recommendations for Hosts
- Use the overall average lead time (30 days) as a baseline for your pricing and availability strategy in Sai Kung District.
- For November stays, consider implementing length-of-stay discounts or slightly higher rates for bookings made less than 292 days out to capitalize on advance planning.
- During October, focus on last-minute booking availability and promotions, as guests book with very short notice (0 days avg.).
- Target marketing efforts for the Fall season well in advance (at least 147 days) to capture early planners.
- Monitor your own booking lead times against these Sai Kung District averages to identify opportunities for dynamic pricing adjustments.
Popular & Essential Airbnb Amenities in Sai Kung District (2026)
Amenity Prevalence
Amenity Insights for Sai Kung District
- Essential amenities in Sai Kung District that guests expect include: Washer, Kitchen, Air conditioning, Wifi. Lacking these (any) could significantly impact bookings.
- Popular amenities like Essentials, Hot water, Dishes and silverware are common but not universal. Offering these can provide a competitive edge.
Recommendations for Hosts
- Ensure your listing includes all essential amenities for Sai Kung District: Washer, Kitchen, Air conditioning, Wifi.
- Prioritize adding missing essentials: Wifi.
- Consider adding popular differentiators like Essentials or Hot water to increase appeal.
- Highlight unique or less common amenities you offer (e.g., hot tub, dedicated workspace, EV charger) in your listing description and photos.
- Regularly check competitor amenities in Sai Kung District to stay competitive.
Sai Kung District Airbnb Guest Demographics & Profile Analysis (2026)
Guest Profile Summary for Sai Kung District
- The typical guest profile for Airbnb in Sai Kung District consists of predominantly international visitors (73%), with top international origins including Hong Kong, typically belonging to the Post-2000s (Gen Z/Alpha) group (50%), primarily speaking English or Chinese.
- Domestic travelers account for 26.8% of guests.
- Key international markets include China (26.8%) and Hong Kong (17.1%).
- Top languages spoken are English (46.7%) followed by Chinese (20%).
- A significant demographic segment is the Post-2000s (Gen Z/Alpha) group, representing 50% of guests.
Recommendations for Hosts
- Focus marketing internationally, particularly towards travelers from Hong Kong.
- Tailor amenities and listing descriptions to appeal to the dominant Post-2000s (Gen Z/Alpha) demographic (e.g., highlight fast WiFi, smart home features, local guides).
- Highlight unique local experiences or amenities relevant to the primary guest profile.
- Consider seasonal promotions aligned with peak travel times for key origin markets.
Nearby Short-Term Rental Market Comparison
How does the Sai Kung District Airbnb market stack up against its neighbors? Compare key performance metrics like average monthly revenue, ADR, and occupancy rates in surrounding areas to understand the broader regional STR landscape.
| Market | Active Properties | Monthly Revenue | Daily Rate | Avg. Occupancy |
|---|---|---|---|---|
| Hong Kong Island | 574 | $829 | $124.13 | 39% |
| Islands District | 105 | $769 | $146.85 | 32% |
| Kowloon | 926 | $714 | $98.51 | 37% |
| Tai Po District | 10 | $493 | $70.86 | 53% |