Chillán Airbnb Market Analysis 2026: Short Term Rental Data & Vacation Rental Statistics in Nuble Region, Chile
Is Airbnb profitable in Chillán in 2026? Explore comprehensive Airbnb analytics for Chillán, Nuble Region, Chile to uncover income potential. This 2026 STR market report for Chillán, based on AirROI data from February 2025 to January 2026, reveals key trends in the market of 208 active listings.
Whether you're considering an Airbnb investment in Chillán, optimizing your existing vacation rental, or exploring rental arbitrage opportunities, understanding the Chillán Airbnb data is crucial. Leveraging the low regulation environment is key to maximizing your short term rental income potential. Let's dive into the specifics.
Key Chillán Airbnb Performance Metrics Overview
Monthly Airbnb Revenue Variations & Income Potential in Chillán (2026)
Understanding the monthly revenue variations for Airbnb listings in Chillán is key to maximizing your short term rental income potential. Seasonality significantly impacts earnings. Our analysis, based on data from the past 12 months, shows that the peak revenue month for STRs in Chillán is typically February, while November often presents the lowest earnings, highlighting opportunities for strategic pricing adjustments during shoulder and low seasons. Explore the typical Airbnb income in Chillán across different performance tiers:
- Best-in-class properties (Top 10%) achieve $1,165+ monthly, often utilizing dynamic pricing and superior guest experiences.
- Strong performing properties (Top 25%) earn $764 or more, indicating effective management and desirable locations/amenities.
- Typical properties (Median) generate around $452 per month, representing the average market performance.
- Entry-level properties (Bottom 25%) see earnings around $217, often with potential for optimization.
Average Monthly Airbnb Earnings Trend in Chillán
Chillán Airbnb Occupancy Rate Trends (2026)
Maximize your bookings by understanding the Chillán STR occupancy trends. Seasonal demand shifts significantly influence how often properties are booked. Typically, Februarysees the highest demand (peak season occupancy), while May experiences the lowest (low season). Effective strategies, like adjusting minimum stays or offering promotions, can boost occupancy during slower periods. Here's how different property tiers perform in Chillán:
- Best-in-class properties (Top 10%) achieve 63%+ occupancy, indicating high desirability and potentially optimized availability.
- Strong performing properties (Top 25%) maintain 45% or higher occupancy, suggesting good market fit and guest satisfaction.
- Typical properties (Median) have an occupancy rate around 27%.
- Entry-level properties (Bottom 25%) average 13% occupancy, potentially facing higher vacancy.
Average Monthly Occupancy Rate Trend in Chillán
Average Daily Rate (ADR) Airbnb Trends in Chillán (2026)
Effective short term rental pricing strategy in Chillán involves understanding monthly ADR fluctuations. The Average Daily Rate (ADR) for Airbnb in Chillán typically peaks in July and dips lowest during February. Leveraging Airbnb dynamic pricing tools or strategies based on this seasonality can significantly boost revenue. Here's a look at the typical nightly rates achieved:
- Best-in-class properties (Top 10%) command rates of $110+ per night, often due to premium features or locations.
- Strong performing properties (Top 25%) achieve nightly rates of $65 or more.
- Typical properties (Median) charge around $51 per night.
- Entry-level properties (Bottom 25%) earn around $41 per night.
Average Daily Rate (ADR) Trend by Month in Chillán
Get Live Chillán Market Intelligence 👇

Explore Real-time Analytics
Airbnb Seasonality Analysis & Trends in Chillán (2026)
Peak Season (February, July, August)
- Revenue averages $665 per month
- Occupancy rates average 36.6%
- Daily rates average $66
Shoulder Season
- Revenue averages $560 per month
- Occupancy maintains around 31.1%
- Daily rates hold near $65
Low Season (May, November, December)
- Revenue drops to average $470 per month
- Occupancy decreases to average 26.8%
- Daily rates adjust to average $65
Seasonality Insights for Chillán
- The Airbnb seasonality in Chillán shows moderate seasonality with distinct peak and low periods. While the sections above show seasonal averages, it's also insightful to look at the extremes:
- During the high season, the absolute peak month showcases Chillán's highest earning potential, with monthly revenues capable of climbing to $746, occupancy reaching a high of 45.2%, and ADRs peaking at $68.
- Conversely, the slowest single month of the year, typically falling within the low season, marks the market's lowest point. In this month, revenue might dip to $450, occupancy could drop to 26.0%, and ADRs may adjust down to $63.
- Understanding both the seasonal averages and these monthly peaks and troughs in revenue, occupancy, and ADR is crucial for maximizing your Airbnb profit potential in Chillán.
Seasonal Strategies for Maximizing Profit
- Peak Season: Maximize revenue through premium pricing and potentially longer minimum stays. Ensure high availability.
- Low Season: Offer competitive pricing, special promotions (e.g., extended stay discounts), and flexible cancellation policies. Target off-season travelers like remote workers or budget-conscious guests.
- Shoulder Seasons: Implement dynamic pricing that balances peak and low rates. Target weekend travelers or specific events. Offer slightly more flexible terms than peak season.
- Regularly analyze your own performance against these Chillán seasonality benchmarks and adjust your pricing and availability strategy accordingly.
Best Areas for Airbnb Investment in Chillán (2026)
Exploring the top neighborhoods for short-term rentals in Chillán? This section highlights key areas, outlining why they are attractive for hosts and guests, along with notable local attractions. Consider these locations based on your target guest profile and investment strategy.
| Neighborhood / Area | Why Host Here? (Target Guests & Appeal) | Key Attractions & Landmarks |
|---|---|---|
| Centro Chillán | The heart of the city, offering easy access to shopping, restaurants, and parks. A great spot for those looking to experience local culture and city life. | Plaza de Armas, Chillán Cathedral, Mercado de Chillán, Museo Claudio Arrau, Teatro Municipal de Chillán |
| Termas de Chillán | Famous for its hot springs and skiing opportunities, this area attracts tourists year-round seeking relaxation and adventure. | Termas de Chillán, Nevados de Chillán ski resort, Natural hot springs, Hiking trails, Mountain biking |
| Las Trancas | A picturesque area located near the Andes, popular for its beautiful landscapes and outdoor activities. Ideal for nature lovers and those looking for a retreat. | Cerro Los Fósiles, Laguna del Laja National Park, Hiking and trekking trails, Mountain view |
| Quinchamalí | Known for its traditional pottery and crafts, this area attracts visitors interested in cultural experiences and local artisan products. | Quinchamalí Pottery, Craft shops, Cultural festivals, Local markets, Artisan workshops |
| Pinto | A small town close to Chillán, offering a rural escape with beautiful landscapes and traditional Chilean culture. A good option for those seeking a quieter environment. | Local farms, Traditional Chilean cuisine, Hiking areas, Natural landscapes |
| Recreo | A charming neighborhood with a blend of residential and touristic features, offering local comforts within reach of Chillán's key attractions. | Plaza Recreo, Local eateries, Parks, Community events |
| Valle Las Trancas | An outdoor enthusiast's paradise, ideal for skiing in the winter and hiking in the summer, popular with adventure seekers. | Ski slopes, Hiking trails, Beautiful valleys, Wildlife |
| Los Ñadis | Known for its tranquility and scenic beauty, this area offers a peaceful escape for tourists looking to relax in nature. | Stunning views, Nature reserves, Birdwatching, Hiking opportunities |
Understanding Airbnb License Requirements & STR Laws in Chillán (2026)
While Chillán, Nuble Region, Chile currently shows low STR regulations, specific Airbnb license requirements might still exist or change. Always verify the latest short term rental regulations and Airbnb license requirements directly with local government authorities for Chillán to ensure full compliance before hosting.
(Source: AirROI data, 2026, based on 0% licensed listings)
Top Performing Airbnb Properties in Chillán (2026)
Benchmark your potential! Explore examples of top-performing Airbnb properties in Chillánbased on Trailing Twelve Month (TTM) revenue. Analyze their characteristics, revenue, occupancy rate, and ADR to understand what drives success in this market.
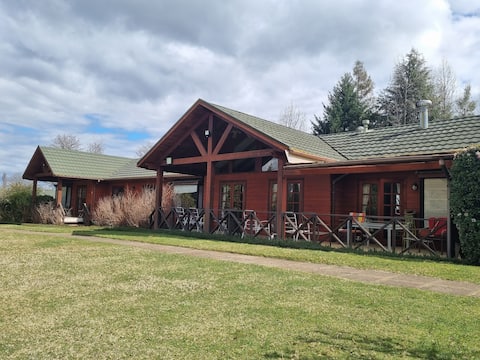
Beautiful Country House on a Plot. Chillán.
Entire Place • 5 bedrooms

Cabin with a private pool for 14 people
Entire Place • 4 bedrooms
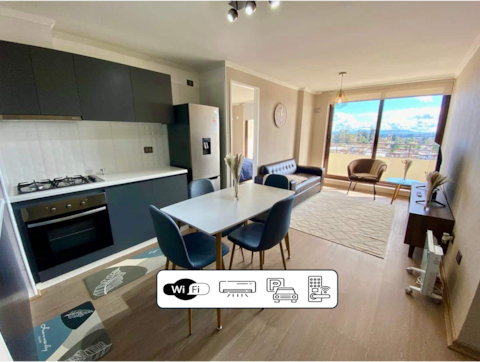
Family apartment with “Wi-Fi+ A/C+ Parking”
Entire Place • 2 bedrooms

2 bedroom apartment with parking
Entire Place • 2 bedrooms
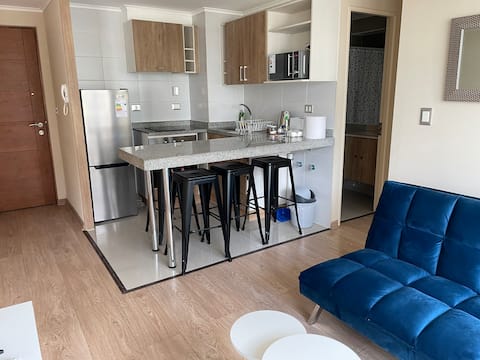
Spacious, comfortable, centrally located with parking
Entire Place • 2 bedrooms

Aparthotel - Monte Piedra - Central - Invoice
Entire Place • 7 bedrooms
Note: Performance varies based on location, size, amenities, seasonality, and management quality. Data reflects the past 12 months.
Top Performing Airbnb Hosts in Chillán (2026)
Learn from the best! This table showcases top-performing Airbnb hosts in Chillán based on the number of properties managed and estimated total revenue over the past year. Analyze their scale and performance metrics.
| Host Name | Properties | Grossing Revenue | Stay Reviews | Avg Rating |
|---|---|---|---|---|
| Alberto | 10 | $56,475 | 612 | 4.80/5.0 |
| Antonio | 5 | $49,039 | 627 | 4.95/5.0 |
| Mauricio | 7 | $45,964 | 565 | 4.80/5.0 |
| Carolina | 8 | $39,107 | 270 | 4.57/5.0 |
| Paz | 5 | $26,561 | 557 | 4.85/5.0 |
| Alicia | 2 | $23,080 | 33 | 4.78/5.0 |
| Gabriela | 2 | $22,380 | 193 | 4.90/5.0 |
| Alf | 9 | $22,212 | 309 | 4.59/5.0 |
| Claudio | 2 | $21,042 | 169 | 4.92/5.0 |
| Roberto Fernando | 1 | $19,292 | 32 | 4.94/5.0 |
Analyzing the strategies of top hosts, such as their property selection, pricing, and guest communication, can offer valuable lessons for optimizing your own Airbnb operations in Chillán.
Dive Deeper: Advanced Chillán STR Market Data (2026)
Ready to unlock more insights? AirROI provides access to advanced metrics and comprehensive Airbnb data for Chillán. Explore detailed analytics beyond this report to refine your investment strategy, optimize pricing, and maximize your vacation rental profits.
Explore Advanced MetricsChillán Short-Term Rental Market Composition (2026): Property & Room Types
Room Type Distribution
Property Type Distribution
Market Composition Insights for Chillán
- The Chillán Airbnb market composition is heavily skewed towards Entire Home/Apt listings, which make up 85.1% of the 208 active rentals. This indicates strong guest preference for privacy and space.
- Looking at the property type distribution in Chillán, Apartment/Condo properties are the most common (61.5%), reflecting the local real estate landscape.
- Houses represent a significant 22.1% portion, catering likely to families or larger groups.
- Smaller segments like hotel/boutique, unique stays, others (combined 6.2%) offer potential for unique stay experiences.
Chillán Airbnb Room Capacity Analysis (2026): Bedroom Distribution
Distribution of Listings by Number of Bedrooms
Room Capacity Insights for Chillán
- The dominant room capacity in Chillán is 1 bedroom listings, making up 35.6% of the market. This suggests a strong demand for properties suitable for couples or solo travelers.
- Together, 1 bedroom and 2 bedrooms properties represent 62.0% of the active Airbnb listings in Chillán, indicating a high concentration in these sizes.
- A significant 26.5% of listings offer 3+ bedrooms, catering to larger groups and families seeking more space in Chillán.
Chillán Vacation Rental Guest Capacity Trends (2026)
Distribution of Listings by Guest Capacity
Guest Capacity Insights for Chillán
- The most common guest capacity trend in Chillán vacation rentals is listings accommodating 2 guests (27.4%). This suggests the primary traveler segment is likely couples or solo travelers.
- Properties designed for 2 guests and 4 guests dominate the Chillán STR market, accounting for 51.9% of listings.
- 19.3% of properties accommodate 6+ guests, serving the market segment for larger families or group travel in Chillán.
- On average, properties in Chillán are equipped to host 3.4 guests.
Chillán Airbnb Booking Patterns (2026): Available vs. Booked Days
Available Days Distribution
Booked Days Distribution
Booking Pattern Insights for Chillán
- The most common availability pattern in Chillán falls within the 271-366 days range, representing 67.3% of listings. This suggests many properties have significant open periods on their calendars.
- Approximately 93.7% of listings show high availability (181+ days open annually), indicating potential for increased bookings or specific owner usage patterns.
- For booked days, the 31-90 days range is most frequent in Chillán (35.6%), reflecting common guest stay durations or potential owner blocking patterns.
- A notable 7.2% of properties secure long booking periods (181+ days booked per year), highlighting successful long-term rental strategies or significant owner usage.
Chillán Airbnb Minimum Stay Requirements Analysis
Distribution of Listings by Minimum Night Requirement
1 Night
147 listings
70.7% of total
2 Nights
42 listings
20.2% of total
3 Nights
3 listings
1.4% of total
4-6 Nights
1 listings
0.5% of total
7-29 Nights
2 listings
1% of total
30+ Nights
13 listings
6.3% of total
Key Insights
- The most prevalent minimum stay requirement in Chillán is 1 Night, adopted by 70.7% of listings. This highlights the market's preference for shorter, flexible bookings.
- A strong majority (90.9%) of the Chillán Airbnb data shows acceptance of very short stays (1-2 nights), indicating a dynamic, high-turnover market.
Recommendations
- Align with the market by considering a 1 Night minimum stay, as 70.7% of Chillán hosts use this setting.
- Explore offering discounts for stays of 30+ nights to attract the 6.3% of the market seeking extended stays.
- Adjust minimum nights based on seasonality – potentially shorter during low season and longer during peak demand periods in Chillán.
Chillán Airbnb Cancellation Policy Trends Analysis (2026)
Limited
4 listings
1.9% of total
Flexible
146 listings
70.5% of total
Moderate
38 listings
18.4% of total
Firm
16 listings
7.7% of total
Strict
3 listings
1.4% of total
Cancellation Policy Insights for Chillán
- The prevailing Airbnb cancellation policy trend in Chillán is Flexible, used by 70.5% of listings.
- The market strongly favors guest-friendly terms, with 88.9% of listings offering Flexible or Moderate policies. This suggests guests in Chillán may expect booking flexibility.
- Strict cancellation policies are quite rare (1.4%), potentially making listings with this policy less competitive unless justified by high demand or property type.
Recommendations for Hosts
- Consider adopting a Flexible policy to align with the 70.5% market standard in Chillán.
- Given the high prevalence of Flexible policies (70.5%), offering this can enhance booking appeal, especially during shoulder seasons.
- Using a Strict policy might deter some guests, as only 1.4% of listings use it. Evaluate if potential revenue protection outweighs possible lower booking rates.
- Regularly review your cancellation policy against competitors and market demand shifts in Chillán.
Chillán STR Booking Lead Time Analysis (2026)
Average Booking Lead Time by Month
Booking Lead Time Insights for Chillán
- The overall average booking lead time for vacation rentals in Chillán is 16 days.
- Guests book furthest in advance for stays during December (average 22 days), likely coinciding with peak travel demand or local events.
- The shortest booking windows occur for stays in May (average 8 days), indicating more last-minute travel plans during this time.
- Seasonally, Fall (20 days avg.) sees the longest lead times, while Spring (12 days avg.) has the shortest, reflecting typical travel planning cycles.
Recommendations for Hosts
- Use the overall average lead time (16 days) as a baseline for your pricing and availability strategy in Chillán.
- During May, focus on last-minute booking availability and promotions, as guests book with very short notice (8 days avg.).
- Target marketing efforts for the Fall season well in advance (at least 20 days) to capture early planners.
- Monitor your own booking lead times against these Chillán averages to identify opportunities for dynamic pricing adjustments.
Popular & Essential Airbnb Amenities in Chillán (2026)
Amenity Prevalence
Amenity Insights for Chillán
- Popular amenities like TV, Kitchen, Wifi are common but not universal. Offering these can provide a competitive edge.
- Warning: Wifi is not universally provided but is considered essential globally. Ensure reliable Wifi is offered.
Recommendations for Hosts
- Consider adding popular differentiators like TV or Kitchen to increase appeal.
- Highlight unique or less common amenities you offer (e.g., hot tub, dedicated workspace, EV charger) in your listing description and photos.
- Regularly check competitor amenities in Chillán to stay competitive.
Chillán Airbnb Guest Demographics & Profile Analysis (2026)
Guest Profile Summary for Chillán
- The typical guest profile for Airbnb in Chillán consists of primarily domestic travelers (85%), often arriving from nearby Santiago, typically belonging to the Post-2000s (Gen Z/Alpha) group (50%), primarily speaking Spanish or English.
- Domestic travelers account for 84.5% of guests.
- Key international markets include Chile (84.5%) and Brazil (4.5%).
- Top languages spoken are Spanish (51.3%) followed by English (29.5%).
- A significant demographic segment is the Post-2000s (Gen Z/Alpha) group, representing 50% of guests.
Recommendations for Hosts
- Target domestic marketing efforts towards travelers from Santiago and Concepción.
- Tailor amenities and listing descriptions to appeal to the dominant Post-2000s (Gen Z/Alpha) demographic (e.g., highlight fast WiFi, smart home features, local guides).
- Highlight unique local experiences or amenities relevant to the primary guest profile.
- Consider seasonal promotions aligned with peak travel times for key origin markets.
Nearby Short-Term Rental Market Comparison
How does the Chillán Airbnb market stack up against its neighbors? Compare key performance metrics like average monthly revenue, ADR, and occupancy rates in surrounding areas to understand the broader regional STR landscape.
| Market | Active Properties | Monthly Revenue | Daily Rate | Avg. Occupancy |
|---|---|---|---|---|
| Pinto | 424 | $816 | $145.46 | 28% |
| Las Trancas | 18 | $816 | $159.21 | 34% |
| Municipio de Caviahue - Copahue | 23 | $557 | $114.00 | 24% |
| San Clemente | 87 | $529 | $90.44 | 29% |
| Santa Bárbara | 24 | $509 | $102.67 | 29% |
| Cabrero | 19 | $498 | $73.98 | 31% |
| Tomé | 211 | $496 | $100.25 | 28% |
| Colbún | 94 | $473 | $103.72 | 25% |
| Talcahuano | 57 | $458 | $54.78 | 39% |
| Concepcion | 611 | $421 | $52.55 | 35% |