Pelluhue Airbnb Market Analysis 2026: Short Term Rental Data & Vacation Rental Statistics in Maule Region, Chile
Is Airbnb profitable in Pelluhue in 2026? Explore comprehensive Airbnb analytics for Pelluhue, Maule Region, Chile to uncover income potential. This 2026 STR market report for Pelluhue, based on AirROI data from February 2025 to January 2026, reveals key trends in the niche market of 173 active listings.
Whether you're considering an Airbnb investment in Pelluhue, optimizing your existing vacation rental, or exploring rental arbitrage opportunities, understanding the Pelluhue Airbnb data is crucial. Leveraging the low regulation environment is key to maximizing your short term rental income potential. Let's dive into the specifics.
Key Pelluhue Airbnb Performance Metrics Overview
Monthly Airbnb Revenue Variations & Income Potential in Pelluhue (2026)
Understanding the monthly revenue variations for Airbnb listings in Pelluhue is key to maximizing your short term rental income potential. Seasonality significantly impacts earnings. Our analysis, based on data from the past 12 months, shows that the peak revenue month for STRs in Pelluhue is typically February, while November often presents the lowest earnings, highlighting opportunities for strategic pricing adjustments during shoulder and low seasons. Explore the typical Airbnb income in Pelluhue across different performance tiers:
- Best-in-class properties (Top 10%) achieve $1,355+ monthly, often utilizing dynamic pricing and superior guest experiences.
- Strong performing properties (Top 25%) earn $781 or more, indicating effective management and desirable locations/amenities.
- Typical properties (Median) generate around $403 per month, representing the average market performance.
- Entry-level properties (Bottom 25%) see earnings around $193, often with potential for optimization.
Average Monthly Airbnb Earnings Trend in Pelluhue
Pelluhue Airbnb Occupancy Rate Trends (2026)
Maximize your bookings by understanding the Pelluhue STR occupancy trends. Seasonal demand shifts significantly influence how often properties are booked. Typically, Februarysees the highest demand (peak season occupancy), while November experiences the lowest (low season). Effective strategies, like adjusting minimum stays or offering promotions, can boost occupancy during slower periods. Here's how different property tiers perform in Pelluhue:
- Best-in-class properties (Top 10%) achieve 47%+ occupancy, indicating high desirability and potentially optimized availability.
- Strong performing properties (Top 25%) maintain 32% or higher occupancy, suggesting good market fit and guest satisfaction.
- Typical properties (Median) have an occupancy rate around 18%.
- Entry-level properties (Bottom 25%) average 9% occupancy, potentially facing higher vacancy.
Average Monthly Occupancy Rate Trend in Pelluhue
Average Daily Rate (ADR) Airbnb Trends in Pelluhue (2026)
Effective short term rental pricing strategy in Pelluhue involves understanding monthly ADR fluctuations. The Average Daily Rate (ADR) for Airbnb in Pelluhue typically peaks in January and dips lowest during March. Leveraging Airbnb dynamic pricing tools or strategies based on this seasonality can significantly boost revenue. Here's a look at the typical nightly rates achieved:
- Best-in-class properties (Top 10%) command rates of $132+ per night, often due to premium features or locations.
- Strong performing properties (Top 25%) achieve nightly rates of $98 or more.
- Typical properties (Median) charge around $76 per night.
- Entry-level properties (Bottom 25%) earn around $56 per night.
Average Daily Rate (ADR) Trend by Month in Pelluhue
Get Live Pelluhue Market Intelligence 👇

Explore Real-time Analytics
Airbnb Seasonality Analysis & Trends in Pelluhue (2026)
Peak Season (February, January, March)
- Revenue averages $912 per month
- Occupancy rates average 36.4%
- Daily rates average $83
Shoulder Season
- Revenue averages $551 per month
- Occupancy maintains around 19.8%
- Daily rates hold near $85
Low Season (August, October, November)
- Revenue drops to average $405 per month
- Occupancy decreases to average 14.1%
- Daily rates adjust to average $85
Seasonality Insights for Pelluhue
- The Airbnb seasonality in Pelluhue shows highly seasonal trends requiring careful strategy. While the sections above show seasonal averages, it's also insightful to look at the extremes:
- During the high season, the absolute peak month showcases Pelluhue's highest earning potential, with monthly revenues capable of climbing to $1,389, occupancy reaching a high of 56.8%, and ADRs peaking at $87.
- Conversely, the slowest single month of the year, typically falling within the low season, marks the market's lowest point. In this month, revenue might dip to $341, occupancy could drop to 12.8%, and ADRs may adjust down to $81.
- Understanding both the seasonal averages and these monthly peaks and troughs in revenue, occupancy, and ADR is crucial for maximizing your Airbnb profit potential in Pelluhue.
Seasonal Strategies for Maximizing Profit
- Peak Season: Maximize revenue through premium pricing and potentially longer minimum stays. Ensure high availability.
- Low Season: Offer competitive pricing, special promotions (e.g., extended stay discounts), and flexible cancellation policies. Target off-season travelers like remote workers or budget-conscious guests.
- Shoulder Seasons: Implement dynamic pricing that balances peak and low rates. Target weekend travelers or specific events. Offer slightly more flexible terms than peak season.
- Regularly analyze your own performance against these Pelluhue seasonality benchmarks and adjust your pricing and availability strategy accordingly.
Best Areas for Airbnb Investment in Pelluhue (2026)
Exploring the top neighborhoods for short-term rentals in Pelluhue? This section highlights key areas, outlining why they are attractive for hosts and guests, along with notable local attractions. Consider these locations based on your target guest profile and investment strategy.
| Neighborhood / Area | Why Host Here? (Target Guests & Appeal) | Key Attractions & Landmarks |
|---|---|---|
| Pelluhue Beach | A beautiful coastal area known for its sandy beaches and scenic views. Ideal for tourists looking for a relaxing getaway by the ocean. | Pelluhue Beach, Calle Larga, Playa Los Robles, Laguna El Laja, Cabo El Condor |
| Los Pinos | A tranquil locality surrounded by nature, perfect for those who want to escape the hustle and bustle and enjoy a peaceful environment. | Parque Nacional Laguna del Laja, Cerro Los Pinos, hiking trails, scenic viewpoints, local wildlife |
| Punta de Pelluhue | A picturesque point offering breathtaking ocean views and excellent opportunities for water sports, attracting adventurous travelers. | Surfing spots, Fishing opportunities, Scenic coastal pathways, Viewpoints over the ocean, Local seafood restaurants |
| Pueblo de Pelluhue | The charming town center, rich in local culture and history, appealing to tourists interested in authentic Chilean experiences. | Church of Pelluhue, Local markets, Traditional Chilean cuisine, Cultural festivals, Craft shops |
| Cabo Blanco | A stunning area known for its natural beauty and biodiversity, appealing to eco-tourists and nature lovers. | Cabo Blanco Natural Reserve, Wildlife watching, Nature trails, Unspoiled beaches, Scenic picnic areas |
| Playa Colmo | A hidden gem for beach lovers seeking less crowded yet beautiful surroundings, perfect for relaxing and sunbathing. | Beach activities, Sunbathing, Local seafood shacks, Sunset views, Calm waters for swimming |
| Río Pelluhue | The region around the river offers opportunities for kayaking and exploring the lush landscape, appealing to adventurers and nature enthusiasts. | Kayaking on the river, Fishing spots, Picnic areas, Wildflower trails, Bird watching |
| Olas de Pelluhue | A lively area with vibrant local life and a variety of accommodations, suitable for tourists looking for social interaction. | Local bars and cafes, Beach volleyball, Community events, Waterfront restaurants, Cultural gatherings |
Understanding Airbnb License Requirements & STR Laws in Pelluhue (2026)
While Pelluhue, Maule Region, Chile currently shows low STR regulations, specific Airbnb license requirements might still exist or change. Always verify the latest short term rental regulations and Airbnb license requirements directly with local government authorities for Pelluhue to ensure full compliance before hosting.
(Source: AirROI data, 2026, based on 2% licensed listings)
Top Performing Airbnb Properties in Pelluhue (2026)
Benchmark your potential! Explore examples of top-performing Airbnb properties in Pelluhuebased on Trailing Twelve Month (TTM) revenue. Analyze their characteristics, revenue, occupancy rate, and ADR to understand what drives success in this market.
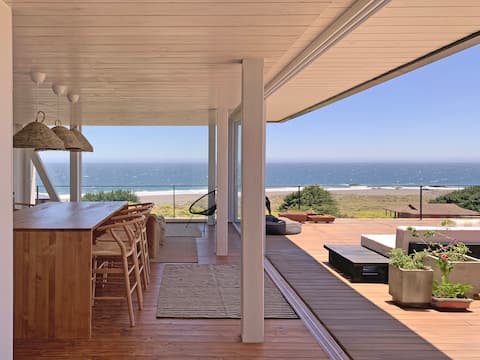
Spectacular beachfront house
Entire Place • 3 bedrooms

Cardonal Coastal Shelter
Entire Place • 3 bedrooms
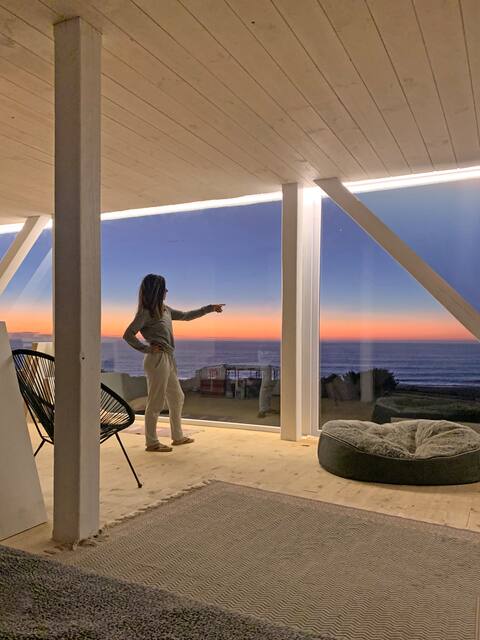
Spectacular Loft, steps away from the sea
Entire Place • 1 bedroom
Casa Mirador Komutun Casa "Camellia"
Entire Place • 6 bedrooms

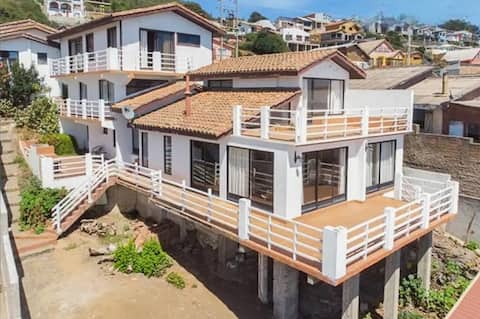
Family House in Pelluhue | Countryside, Sea and Pool
Entire Place • 3 bedrooms

Cozy beachfront house
Entire Place • 2 bedrooms
Note: Performance varies based on location, size, amenities, seasonality, and management quality. Data reflects the past 12 months.
Top Performing Airbnb Hosts in Pelluhue (2026)
Learn from the best! This table showcases top-performing Airbnb hosts in Pelluhue based on the number of properties managed and estimated total revenue over the past year. Analyze their scale and performance metrics.
| Host Name | Properties | Grossing Revenue | Stay Reviews | Avg Rating |
|---|---|---|---|---|
| Bárbara | 4 | $37,476 | 160 | 4.84/5.0 |
| Claudia | 3 | $29,738 | 42 | 4.96/5.0 |
| Jorge | 1 | $26,288 | 10 | 4.90/5.0 |
| Isamar | 3 | $24,362 | 105 | 4.68/5.0 |
| Alto Curanipe | 2 | $23,794 | 13 | 4.79/5.0 |
| Sandra | 1 | $22,512 | 64 | 4.97/5.0 |
| Ximena | 1 | $22,510 | 69 | 4.97/5.0 |
| Lacaze | 3 | $21,392 | 282 | 4.85/5.0 |
| Andrey | 2 | $20,673 | 14 | 5.00/5.0 |
| Jorge | 2 | $19,796 | 31 | 4.83/5.0 |
Analyzing the strategies of top hosts, such as their property selection, pricing, and guest communication, can offer valuable lessons for optimizing your own Airbnb operations in Pelluhue.
Dive Deeper: Advanced Pelluhue STR Market Data (2026)
Ready to unlock more insights? AirROI provides access to advanced metrics and comprehensive Airbnb data for Pelluhue. Explore detailed analytics beyond this report to refine your investment strategy, optimize pricing, and maximize your vacation rental profits.
Explore Advanced MetricsPelluhue Short-Term Rental Market Composition (2026): Property & Room Types
Room Type Distribution
Property Type Distribution
Market Composition Insights for Pelluhue
- The Pelluhue Airbnb market composition is heavily skewed towards Entire Home/Apt listings, which make up 94.2% of the 173 active rentals. This indicates strong guest preference for privacy and space.
- Looking at the property type distribution in Pelluhue, Outdoor/Unique properties are the most common (57.8%), reflecting the local real estate landscape.
- Houses represent a significant 32.9% portion, catering likely to families or larger groups.
- Smaller segments like hotel/boutique, apartment/condo, unique stays (combined 9.2%) offer potential for unique stay experiences.
Pelluhue Airbnb Room Capacity Analysis (2026): Bedroom Distribution
Distribution of Listings by Number of Bedrooms
Room Capacity Insights for Pelluhue
- The dominant room capacity in Pelluhue is 2 bedrooms listings, making up 44.5% of the market. This suggests a strong demand for properties suitable for couples or solo travelers.
- Together, 2 bedrooms and 3 bedrooms properties represent 73.4% of the active Airbnb listings in Pelluhue, indicating a high concentration in these sizes.
- A significant 37.6% of listings offer 3+ bedrooms, catering to larger groups and families seeking more space in Pelluhue.
Pelluhue Vacation Rental Guest Capacity Trends (2026)
Distribution of Listings by Guest Capacity
Guest Capacity Insights for Pelluhue
- The most common guest capacity trend in Pelluhue vacation rentals is listings accommodating 6 guests (24.3%). This suggests the primary traveler segment is likely larger groups.
- Properties designed for 6 guests and 4 guests dominate the Pelluhue STR market, accounting for 46.3% of listings.
- 42.8% of properties accommodate 6+ guests, serving the market segment for larger families or group travel in Pelluhue.
- On average, properties in Pelluhue are equipped to host 4.9 guests.
Pelluhue Airbnb Booking Patterns (2026): Available vs. Booked Days
Available Days Distribution
Booked Days Distribution
Booking Pattern Insights for Pelluhue
- The most common availability pattern in Pelluhue falls within the 271-366 days range, representing 89% of listings. This suggests many properties have significant open periods on their calendars.
- Approximately 98.2% of listings show high availability (181+ days open annually), indicating potential for increased bookings or specific owner usage patterns.
- For booked days, the 31-90 days range is most frequent in Pelluhue (45.7%), reflecting common guest stay durations or potential owner blocking patterns.
- A notable 1.7% of properties secure long booking periods (181+ days booked per year), highlighting successful long-term rental strategies or significant owner usage.
Pelluhue Airbnb Minimum Stay Requirements Analysis
Distribution of Listings by Minimum Night Requirement
1 Night
45 listings
26% of total
2 Nights
81 listings
46.8% of total
3 Nights
9 listings
5.2% of total
4-6 Nights
2 listings
1.2% of total
30+ Nights
36 listings
20.8% of total
Key Insights
- The most prevalent minimum stay requirement in Pelluhue is 2 Nights, adopted by 46.8% of listings. This highlights the market's preference for shorter, flexible bookings.
- A strong majority (72.8%) of the Pelluhue Airbnb data shows acceptance of very short stays (1-2 nights), indicating a dynamic, high-turnover market.
- A significant segment (20.8%) caters to monthly stays (30+ nights) in Pelluhue, pointing to opportunities in the extended-stay market.
Recommendations
- Align with the market by considering a 2 Nights minimum stay, as 46.8% of Pelluhue hosts use this setting.
- If feasible, allowing 1-night stays, especially midweek or during low season, could capture last-minute bookings, as only 26% currently do.
- Explore offering discounts for stays of 30+ nights to attract the 20.8% of the market seeking extended stays.
- Adjust minimum nights based on seasonality – potentially shorter during low season and longer during peak demand periods in Pelluhue.
Pelluhue Airbnb Cancellation Policy Trends Analysis (2026)
Limited
11 listings
6.4% of total
Flexible
73 listings
42.4% of total
Moderate
64 listings
37.2% of total
Firm
22 listings
12.8% of total
Strict
2 listings
1.2% of total
Cancellation Policy Insights for Pelluhue
- The prevailing Airbnb cancellation policy trend in Pelluhue is Flexible, used by 42.4% of listings.
- The market strongly favors guest-friendly terms, with 79.6% of listings offering Flexible or Moderate policies. This suggests guests in Pelluhue may expect booking flexibility.
- Strict cancellation policies are quite rare (1.2%), potentially making listings with this policy less competitive unless justified by high demand or property type.
Recommendations for Hosts
- Consider adopting a Flexible policy to align with the 42.4% market standard in Pelluhue.
- Using a Strict policy might deter some guests, as only 1.2% of listings use it. Evaluate if potential revenue protection outweighs possible lower booking rates.
- Regularly review your cancellation policy against competitors and market demand shifts in Pelluhue.
Pelluhue STR Booking Lead Time Analysis (2026)
Average Booking Lead Time by Month
Booking Lead Time Insights for Pelluhue
- The overall average booking lead time for vacation rentals in Pelluhue is 15 days.
- Guests book furthest in advance for stays during September (average 24 days), likely coinciding with peak travel demand or local events.
- The shortest booking windows occur for stays in May (average 11 days), indicating more last-minute travel plans during this time.
- Seasonally, Fall (19 days avg.) sees the longest lead times, while Summer (13 days avg.) has the shortest, reflecting typical travel planning cycles.
Recommendations for Hosts
- Use the overall average lead time (15 days) as a baseline for your pricing and availability strategy in Pelluhue.
- Target marketing efforts for the Fall season well in advance (at least 19 days) to capture early planners.
- Monitor your own booking lead times against these Pelluhue averages to identify opportunities for dynamic pricing adjustments.
Popular & Essential Airbnb Amenities in Pelluhue (2026)
Amenity Prevalence
Amenity Insights for Pelluhue
- Essential amenities in Pelluhue that guests expect include: Free parking on premises, Kitchen. Lacking these (any) could significantly impact bookings.
- Popular amenities like Dishes and silverware, Hot water, TV are common but not universal. Offering these can provide a competitive edge.
Recommendations for Hosts
- Ensure your listing includes all essential amenities for Pelluhue: Free parking on premises, Kitchen.
- Prioritize adding missing essentials: Free parking on premises, Kitchen.
- Consider adding popular differentiators like Dishes and silverware or Hot water to increase appeal.
- Highlight unique or less common amenities you offer (e.g., hot tub, dedicated workspace, EV charger) in your listing description and photos.
- Regularly check competitor amenities in Pelluhue to stay competitive.
Pelluhue Airbnb Guest Demographics & Profile Analysis (2026)
Guest Profile Summary for Pelluhue
- The typical guest profile for Airbnb in Pelluhue consists of primarily domestic travelers (90%), often arriving from nearby Santiago, typically belonging to the Post-2000s (Gen Z/Alpha) group (50%), primarily speaking Spanish or English.
- Domestic travelers account for 89.9% of guests.
- Key international markets include Chile (89.9%) and United States (2.2%).
- Top languages spoken are Spanish (53.8%) followed by English (30.9%).
- A significant demographic segment is the Post-2000s (Gen Z/Alpha) group, representing 50% of guests.
Recommendations for Hosts
- Target domestic marketing efforts towards travelers from Santiago and Talca.
- Tailor amenities and listing descriptions to appeal to the dominant Post-2000s (Gen Z/Alpha) demographic (e.g., highlight fast WiFi, smart home features, local guides).
- Highlight unique local experiences or amenities relevant to the primary guest profile.
- Consider seasonal promotions aligned with peak travel times for key origin markets.
Nearby Short-Term Rental Market Comparison
How does the Pelluhue Airbnb market stack up against its neighbors? Compare key performance metrics like average monthly revenue, ADR, and occupancy rates in surrounding areas to understand the broader regional STR landscape.
| Market | Active Properties | Monthly Revenue | Daily Rate | Avg. Occupancy |
|---|---|---|---|---|
| Litueche | 68 | $1,254 | $224.62 | 26% |
| Las Cabras | 179 | $1,137 | $219.49 | 27% |
| La Estrella | 21 | $1,078 | $288.44 | 24% |
| Pinto | 424 | $816 | $145.46 | 28% |
| Las Trancas | 18 | $816 | $159.21 | 34% |
| Santa Cruz | 106 | $764 | $120.04 | 22% |
| Palmilla | 13 | $697 | $112.08 | 25% |
| Pichilemu | 1,158 | $648 | $122.60 | 26% |
| Vichuquén | 165 | $598 | $169.26 | 28% |
| San Clemente | 87 | $529 | $90.44 | 29% |