Osorno Airbnb Market Analysis 2026: Short Term Rental Data & Vacation Rental Statistics in Los Lagos Region, Chile
Is Airbnb profitable in Osorno in 2026? Explore comprehensive Airbnb analytics for Osorno, Los Lagos Region, Chile to uncover income potential. This 2026 STR market report for Osorno, based on AirROI data from February 2025 to January 2026, reveals key trends in the niche market of 167 active listings.
Whether you're considering an Airbnb investment in Osorno, optimizing your existing vacation rental, or exploring rental arbitrage opportunities, understanding the Osorno Airbnb data is crucial. Leveraging the low regulation environment is key to maximizing your short term rental income potential. Let's dive into the specifics.
Key Osorno Airbnb Performance Metrics Overview
Monthly Airbnb Revenue Variations & Income Potential in Osorno (2026)
Understanding the monthly revenue variations for Airbnb listings in Osorno is key to maximizing your short term rental income potential. Seasonality significantly impacts earnings. Our analysis, based on data from the past 12 months, shows that the peak revenue month for STRs in Osorno is typically February, while May often presents the lowest earnings, highlighting opportunities for strategic pricing adjustments during shoulder and low seasons. Explore the typical Airbnb income in Osorno across different performance tiers:
- Best-in-class properties (Top 10%) achieve $1,160+ monthly, often utilizing dynamic pricing and superior guest experiences.
- Strong performing properties (Top 25%) earn $819 or more, indicating effective management and desirable locations/amenities.
- Typical properties (Median) generate around $445 per month, representing the average market performance.
- Entry-level properties (Bottom 25%) see earnings around $205, often with potential for optimization.
Average Monthly Airbnb Earnings Trend in Osorno
Osorno Airbnb Occupancy Rate Trends (2026)
Maximize your bookings by understanding the Osorno STR occupancy trends. Seasonal demand shifts significantly influence how often properties are booked. Typically, Februarysees the highest demand (peak season occupancy), while July experiences the lowest (low season). Effective strategies, like adjusting minimum stays or offering promotions, can boost occupancy during slower periods. Here's how different property tiers perform in Osorno:
- Best-in-class properties (Top 10%) achieve 71%+ occupancy, indicating high desirability and potentially optimized availability.
- Strong performing properties (Top 25%) maintain 51% or higher occupancy, suggesting good market fit and guest satisfaction.
- Typical properties (Median) have an occupancy rate around 29%.
- Entry-level properties (Bottom 25%) average 13% occupancy, potentially facing higher vacancy.
Average Monthly Occupancy Rate Trend in Osorno
Average Daily Rate (ADR) Airbnb Trends in Osorno (2026)
Effective short term rental pricing strategy in Osorno involves understanding monthly ADR fluctuations. The Average Daily Rate (ADR) for Airbnb in Osorno typically peaks in January and dips lowest during March. Leveraging Airbnb dynamic pricing tools or strategies based on this seasonality can significantly boost revenue. Here's a look at the typical nightly rates achieved:
- Best-in-class properties (Top 10%) command rates of $82+ per night, often due to premium features or locations.
- Strong performing properties (Top 25%) achieve nightly rates of $66 or more.
- Typical properties (Median) charge around $52 per night.
- Entry-level properties (Bottom 25%) earn around $42 per night.
Average Daily Rate (ADR) Trend by Month in Osorno
Get Live Osorno Market Intelligence 👇

Explore Real-time Analytics
Airbnb Seasonality Analysis & Trends in Osorno (2026)
Peak Season (February, January, October)
- Revenue averages $699 per month
- Occupancy rates average 40.7%
- Daily rates average $57
Shoulder Season
- Revenue averages $534 per month
- Occupancy maintains around 32.4%
- Daily rates hold near $56
Low Season (April, May, July)
- Revenue drops to average $475 per month
- Occupancy decreases to average 30.3%
- Daily rates adjust to average $55
Seasonality Insights for Osorno
- The Airbnb seasonality in Osorno shows moderate seasonality with distinct peak and low periods. While the sections above show seasonal averages, it's also insightful to look at the extremes:
- During the high season, the absolute peak month showcases Osorno's highest earning potential, with monthly revenues capable of climbing to $844, occupancy reaching a high of 52.4%, and ADRs peaking at $58.
- Conversely, the slowest single month of the year, typically falling within the low season, marks the market's lowest point. In this month, revenue might dip to $464, occupancy could drop to 29.2%, and ADRs may adjust down to $53.
- Understanding both the seasonal averages and these monthly peaks and troughs in revenue, occupancy, and ADR is crucial for maximizing your Airbnb profit potential in Osorno.
Seasonal Strategies for Maximizing Profit
- Peak Season: Maximize revenue through premium pricing and potentially longer minimum stays. Ensure high availability.
- Low Season: Offer competitive pricing, special promotions (e.g., extended stay discounts), and flexible cancellation policies. Target off-season travelers like remote workers or budget-conscious guests.
- Shoulder Seasons: Implement dynamic pricing that balances peak and low rates. Target weekend travelers or specific events. Offer slightly more flexible terms than peak season.
- Regularly analyze your own performance against these Osorno seasonality benchmarks and adjust your pricing and availability strategy accordingly.
Best Areas for Airbnb Investment in Osorno (2026)
Exploring the top neighborhoods for short-term rentals in Osorno? This section highlights key areas, outlining why they are attractive for hosts and guests, along with notable local attractions. Consider these locations based on your target guest profile and investment strategy.
| Neighborhood / Area | Why Host Here? (Target Guests & Appeal) | Key Attractions & Landmarks |
|---|---|---|
| Osorno City Center | The bustling heart of Osorno, known for its commercial activity and accessibility. It's ideal for tourists looking to explore the local culture and attractions. | Plaza de Armas, Osorno Cathedral, Museo Interactivo, Parque Cuarto Centenario, Local markets |
| Puyehue National Park | A stunning natural park known for its hot springs, lakes, and hiking trails. Perfect for nature lovers and adventure seekers wanting to escape the city. | Termas de Puyehue, Lago Puyehue, Cerro Tres Picos, Hiking trails, Scenic viewpoints |
| Rio Petrohué | Famous for its breathtaking waterfalls and turquoise waters. A great location for tourists interested in photography, nature, and outdoor activities. | Saltos del Petrohué, Lago Todos los Santos, Hiking trails, Fishing, Kayaking |
| San Pablo | A charming town located near Osorno, known for its picturesque landscapes and local culture. It draws visitors looking for an authentic rural experience. | Quilquico Beach, Local craft markets, Cultural festivals, Traditional food, Scenic viewpoints |
| Frutillar | A beautiful lakeside town known for its German architecture and cultural events. Popular for tourists as a relaxing retreat with artistic and musical events. | Teatro del Lago, Frutillar's German Museum, Beaches, Cultural festivals, Scenic waterfront |
| Los Lagos Region | This entire region is rich in natural beauty, with numerous lakes and rural areas appealing to those seeking outdoor activities and relaxation. | Lago Llanquihue, Cerro Osorno, Fishing and boating opportunities, National Parks, Local cuisine |
| Río Blanco | A hidden gem for adventurous spirits, offering unique landscapes and an intimate connection to nature. Ideal for those looking for solitude and adventure. | Río Blanco River, Caving opportunities, Hiking trails, Wildlife observation, Off-road biking |
| Agricultural Estates | Vast rural areas surrounding Osorno, ideal for tourists wanting a farm experience or to learn about local agriculture and wine production. | Vineyards, Farm tours, Wine tasting, Local markets, Agricultural fairs |
Understanding Airbnb License Requirements & STR Laws in Osorno (2026)
While Osorno, Los Lagos Region, Chile currently shows low STR regulations, specific Airbnb license requirements might still exist or change. Always verify the latest short term rental regulations and Airbnb license requirements directly with local government authorities for Osorno to ensure full compliance before hosting.
(Source: AirROI data, 2026, based on 3% licensed listings)
Top Performing Airbnb Properties in Osorno (2026)
Benchmark your potential! Explore examples of top-performing Airbnb properties in Osornobased on Trailing Twelve Month (TTM) revenue. Analyze their characteristics, revenue, occupancy rate, and ADR to understand what drives success in this market.
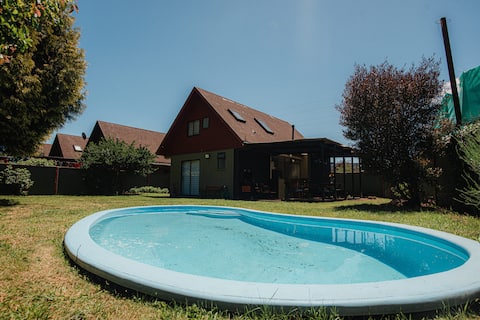
Casa Fuschlocher
Entire Place • 3 bedrooms
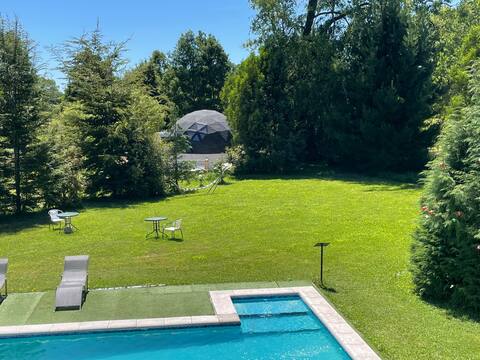
Wonderful Dome
Entire Place • 3 bedrooms

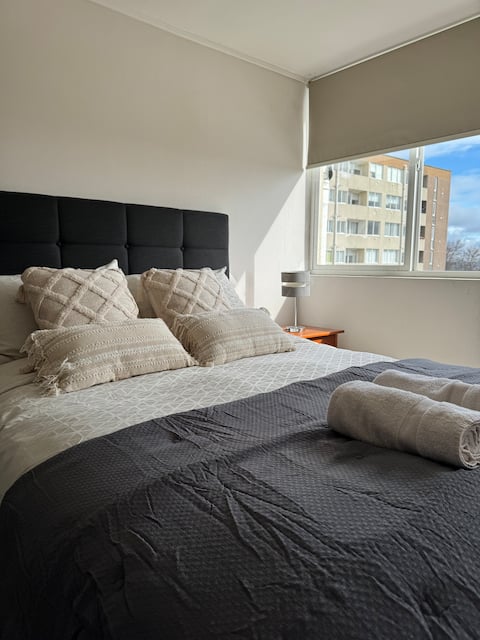
New downtown apartment with parking
Entire Place • 1 bedroom
Apartment in the eastern sector with parking!
Entire Place • 2 bedrooms

Studio apartment in downtown Osorno
Entire Place • 1 bedroom

Single-room apartment
Entire Place • 1 bedroom
Note: Performance varies based on location, size, amenities, seasonality, and management quality. Data reflects the past 12 months.
Top Performing Airbnb Hosts in Osorno (2026)
Learn from the best! This table showcases top-performing Airbnb hosts in Osorno based on the number of properties managed and estimated total revenue over the past year. Analyze their scale and performance metrics.
| Host Name | Properties | Grossing Revenue | Stay Reviews | Avg Rating |
|---|---|---|---|---|
| Angelica | 4 | $26,370 | 278 | 4.83/5.0 |
| Jaime Alejandro | 2 | $25,939 | 334 | 4.93/5.0 |
| Cristina | 3 | $25,412 | 248 | 5.00/5.0 |
| María José | 1 | $24,995 | 71 | 4.96/5.0 |
| Fernando Antonio | 7 | $22,263 | 174 | 4.84/5.0 |
| Cabañas Pilauco | 6 | $21,109 | 34 | 4.84/5.0 |
| Andres | 2 | $19,246 | 46 | 4.97/5.0 |
| Carolina | 2 | $15,261 | 182 | 4.90/5.0 |
| Felipe | 2 | $14,967 | 159 | 4.89/5.0 |
| Felipe Y Claudia | 1 | $14,715 | 27 | 4.89/5.0 |
Analyzing the strategies of top hosts, such as their property selection, pricing, and guest communication, can offer valuable lessons for optimizing your own Airbnb operations in Osorno.
Dive Deeper: Advanced Osorno STR Market Data (2026)
Ready to unlock more insights? AirROI provides access to advanced metrics and comprehensive Airbnb data for Osorno. Explore detailed analytics beyond this report to refine your investment strategy, optimize pricing, and maximize your vacation rental profits.
Explore Advanced MetricsOsorno Short-Term Rental Market Composition (2026): Property & Room Types
Room Type Distribution
Property Type Distribution
Market Composition Insights for Osorno
- The Osorno Airbnb market composition is heavily skewed towards Entire Home/Apt listings, which make up 85.6% of the 167 active rentals. This indicates strong guest preference for privacy and space.
- Looking at the property type distribution in Osorno, Apartment/Condo properties are the most common (55.1%), reflecting the local real estate landscape.
- Houses represent a significant 19.8% portion, catering likely to families or larger groups.
- The presence of 6.6% Hotel/Boutique listings indicates integration with traditional hospitality.
- Smaller segments like others, unique stays (combined 4.2%) offer potential for unique stay experiences.
Osorno Airbnb Room Capacity Analysis (2026): Bedroom Distribution
Distribution of Listings by Number of Bedrooms
Room Capacity Insights for Osorno
- The dominant room capacity in Osorno is 2 bedrooms listings, making up 35.9% of the market. This suggests a strong demand for properties suitable for couples or solo travelers.
- Together, 2 bedrooms and 1 bedroom properties represent 70.6% of the active Airbnb listings in Osorno, indicating a high concentration in these sizes.
Osorno Vacation Rental Guest Capacity Trends (2026)
Distribution of Listings by Guest Capacity
Guest Capacity Insights for Osorno
- The most common guest capacity trend in Osorno vacation rentals is listings accommodating 2 guests (24.6%). This suggests the primary traveler segment is likely couples or solo travelers.
- Properties designed for 2 guests and 4 guests dominate the Osorno STR market, accounting for 48.6% of listings.
- 16.2% of properties accommodate 6+ guests, serving the market segment for larger families or group travel in Osorno.
- On average, properties in Osorno are equipped to host 3.4 guests.
Osorno Airbnb Booking Patterns (2026): Available vs. Booked Days
Available Days Distribution
Booked Days Distribution
Booking Pattern Insights for Osorno
- The most common availability pattern in Osorno falls within the 271-366 days range, representing 69.5% of listings. This suggests many properties have significant open periods on their calendars.
- Approximately 92.3% of listings show high availability (181+ days open annually), indicating potential for increased bookings or specific owner usage patterns.
- For booked days, the 1-30 days range is most frequent in Osorno (34.1%), reflecting common guest stay durations or potential owner blocking patterns.
- A notable 8.4% of properties secure long booking periods (181+ days booked per year), highlighting successful long-term rental strategies or significant owner usage.
Osorno Airbnb Minimum Stay Requirements Analysis
Distribution of Listings by Minimum Night Requirement
1 Night
105 listings
62.9% of total
2 Nights
31 listings
18.6% of total
3 Nights
1 listings
0.6% of total
4-6 Nights
1 listings
0.6% of total
30+ Nights
29 listings
17.4% of total
Key Insights
- The most prevalent minimum stay requirement in Osorno is 1 Night, adopted by 62.9% of listings. This highlights the market's preference for shorter, flexible bookings.
- A strong majority (81.5%) of the Osorno Airbnb data shows acceptance of very short stays (1-2 nights), indicating a dynamic, high-turnover market.
- A significant segment (17.4%) caters to monthly stays (30+ nights) in Osorno, pointing to opportunities in the extended-stay market.
Recommendations
- Align with the market by considering a 1 Night minimum stay, as 62.9% of Osorno hosts use this setting.
- Explore offering discounts for stays of 30+ nights to attract the 17.4% of the market seeking extended stays.
- Adjust minimum nights based on seasonality – potentially shorter during low season and longer during peak demand periods in Osorno.
Osorno Airbnb Cancellation Policy Trends Analysis (2026)
Limited
2 listings
1.2% of total
Flexible
106 listings
63.9% of total
Moderate
47 listings
28.3% of total
Firm
11 listings
6.6% of total
Cancellation Policy Insights for Osorno
- The prevailing Airbnb cancellation policy trend in Osorno is Flexible, used by 63.9% of listings.
- The market strongly favors guest-friendly terms, with 92.2% of listings offering Flexible or Moderate policies. This suggests guests in Osorno may expect booking flexibility.
Recommendations for Hosts
- Consider adopting a Flexible policy to align with the 63.9% market standard in Osorno.
- Given the high prevalence of Flexible policies (63.9%), offering this can enhance booking appeal, especially during shoulder seasons.
- Regularly review your cancellation policy against competitors and market demand shifts in Osorno.
Osorno STR Booking Lead Time Analysis (2026)
Average Booking Lead Time by Month
Booking Lead Time Insights for Osorno
- The overall average booking lead time for vacation rentals in Osorno is 13 days.
- Guests book furthest in advance for stays during January (average 23 days), likely coinciding with peak travel demand or local events.
- The shortest booking windows occur for stays in August (average 10 days), indicating more last-minute travel plans during this time.
- Seasonally, Winter (17 days avg.) sees the longest lead times, while Spring (11 days avg.) has the shortest, reflecting typical travel planning cycles.
Recommendations for Hosts
- Use the overall average lead time (13 days) as a baseline for your pricing and availability strategy in Osorno.
- Target marketing efforts for the Winter season well in advance (at least 17 days) to capture early planners.
- Monitor your own booking lead times against these Osorno averages to identify opportunities for dynamic pricing adjustments.
Popular & Essential Airbnb Amenities in Osorno (2026)
Amenity Prevalence
Amenity Insights for Osorno
- Popular amenities like Wifi, TV, Kitchen are common but not universal. Offering these can provide a competitive edge.
- Warning: Wifi is not universally provided but is considered essential globally. Ensure reliable Wifi is offered.
Recommendations for Hosts
- Consider adding popular differentiators like Wifi or TV to increase appeal.
- Highlight unique or less common amenities you offer (e.g., hot tub, dedicated workspace, EV charger) in your listing description and photos.
- Regularly check competitor amenities in Osorno to stay competitive.
Osorno Airbnb Guest Demographics & Profile Analysis (2026)
Guest Profile Summary for Osorno
- The typical guest profile for Airbnb in Osorno consists of a mix of domestic (59%) and international guests, often arriving from nearby Santiago, typically belonging to the Post-2000s (Gen Z/Alpha) group (50%), primarily speaking Spanish or English.
- Domestic travelers account for 58.8% of guests.
- Key international markets include Chile (58.8%) and Argentina (30.4%).
- Top languages spoken are Spanish (53.2%) followed by English (29.6%).
- A significant demographic segment is the Post-2000s (Gen Z/Alpha) group, representing 50% of guests.
Recommendations for Hosts
- Balance marketing efforts between domestic and international channels based on the guest mix.
- Tailor amenities and listing descriptions to appeal to the dominant Post-2000s (Gen Z/Alpha) demographic (e.g., highlight fast WiFi, smart home features, local guides).
- Highlight unique local experiences or amenities relevant to the primary guest profile.
- Consider seasonal promotions aligned with peak travel times for key origin markets.
Nearby Short-Term Rental Market Comparison
How does the Osorno Airbnb market stack up against its neighbors? Compare key performance metrics like average monthly revenue, ADR, and occupancy rates in surrounding areas to understand the broader regional STR landscape.
| Market | Active Properties | Monthly Revenue | Daily Rate | Avg. Occupancy |
|---|---|---|---|---|
| Puerto Varas | 1,250 | $660 | $102.65 | 38% |
| Puyehue | 88 | $570 | $102.90 | 30% |
| Frutillar | 244 | $566 | $111.42 | 34% |
| Futrono | 177 | $530 | $126.37 | 32% |
| Puerto Octay | 112 | $524 | $133.36 | 28% |
| Los Lagos | 35 | $512 | $111.49 | 28% |
| Panguipulli | 609 | $501 | $99.59 | 33% |
| Lago Ranco | 164 | $430 | $106.48 | 32% |
| Río Bueno | 29 | $428 | $73.05 | 35% |
| Cochamó | 140 | $410 | $88.51 | 30% |