Vicuña Airbnb Market Analysis 2026: Short Term Rental Data & Vacation Rental Statistics in Coquimbo Region, Chile
Is Airbnb profitable in Vicuña in 2026? Explore comprehensive Airbnb analytics for Vicuña, Coquimbo Region, Chile to uncover income potential. This 2026 STR market report for Vicuña, based on AirROI data from February 2025 to January 2026, reveals key trends in the market of 207 active listings.
Whether you're considering an Airbnb investment in Vicuña, optimizing your existing vacation rental, or exploring rental arbitrage opportunities, understanding the Vicuña Airbnb data is crucial. Leveraging the low regulation environment is key to maximizing your short term rental income potential. Let's dive into the specifics.
Key Vicuña Airbnb Performance Metrics Overview
Monthly Airbnb Revenue Variations & Income Potential in Vicuña (2026)
Understanding the monthly revenue variations for Airbnb listings in Vicuña is key to maximizing your short term rental income potential. Seasonality significantly impacts earnings. Our analysis, based on data from the past 12 months, shows that the peak revenue month for STRs in Vicuña is typically February, while June often presents the lowest earnings, highlighting opportunities for strategic pricing adjustments during shoulder and low seasons. Explore the typical Airbnb income in Vicuña across different performance tiers:
- Best-in-class properties (Top 10%) achieve $1,808+ monthly, often utilizing dynamic pricing and superior guest experiences.
- Strong performing properties (Top 25%) earn $1,042 or more, indicating effective management and desirable locations/amenities.
- Typical properties (Median) generate around $467 per month, representing the average market performance.
- Entry-level properties (Bottom 25%) see earnings around $208, often with potential for optimization.
Average Monthly Airbnb Earnings Trend in Vicuña
Vicuña Airbnb Occupancy Rate Trends (2026)
Maximize your bookings by understanding the Vicuña STR occupancy trends. Seasonal demand shifts significantly influence how often properties are booked. Typically, Februarysees the highest demand (peak season occupancy), while June experiences the lowest (low season). Effective strategies, like adjusting minimum stays or offering promotions, can boost occupancy during slower periods. Here's how different property tiers perform in Vicuña:
- Best-in-class properties (Top 10%) achieve 59%+ occupancy, indicating high desirability and potentially optimized availability.
- Strong performing properties (Top 25%) maintain 38% or higher occupancy, suggesting good market fit and guest satisfaction.
- Typical properties (Median) have an occupancy rate around 21%.
- Entry-level properties (Bottom 25%) average 11% occupancy, potentially facing higher vacancy.
Average Monthly Occupancy Rate Trend in Vicuña
Average Daily Rate (ADR) Airbnb Trends in Vicuña (2026)
Effective short term rental pricing strategy in Vicuña involves understanding monthly ADR fluctuations. The Average Daily Rate (ADR) for Airbnb in Vicuña typically peaks in January and dips lowest during March. Leveraging Airbnb dynamic pricing tools or strategies based on this seasonality can significantly boost revenue. Here's a look at the typical nightly rates achieved:
- Best-in-class properties (Top 10%) command rates of $151+ per night, often due to premium features or locations.
- Strong performing properties (Top 25%) achieve nightly rates of $108 or more.
- Typical properties (Median) charge around $78 per night.
- Entry-level properties (Bottom 25%) earn around $54 per night.
Average Daily Rate (ADR) Trend by Month in Vicuña
Get Live Vicuña Market Intelligence 👇

Explore Real-time Analytics
Airbnb Seasonality Analysis & Trends in Vicuña (2026)
Peak Season (February, January, March)
- Revenue averages $1,051 per month
- Occupancy rates average 37.4%
- Daily rates average $88
Shoulder Season
- Revenue averages $695 per month
- Occupancy maintains around 24.9%
- Daily rates hold near $86
Low Season (June, August, November)
- Revenue drops to average $588 per month
- Occupancy decreases to average 22.4%
- Daily rates adjust to average $86
Seasonality Insights for Vicuña
- The Airbnb seasonality in Vicuña shows highly seasonal trends requiring careful strategy. While the sections above show seasonal averages, it's also insightful to look at the extremes:
- During the high season, the absolute peak month showcases Vicuña's highest earning potential, with monthly revenues capable of climbing to $1,341, occupancy reaching a high of 51.2%, and ADRs peaking at $92.
- Conversely, the slowest single month of the year, typically falling within the low season, marks the market's lowest point. In this month, revenue might dip to $536, occupancy could drop to 20.7%, and ADRs may adjust down to $84.
- Understanding both the seasonal averages and these monthly peaks and troughs in revenue, occupancy, and ADR is crucial for maximizing your Airbnb profit potential in Vicuña.
Seasonal Strategies for Maximizing Profit
- Peak Season: Maximize revenue through premium pricing and potentially longer minimum stays. Ensure high availability.
- Low Season: Offer competitive pricing, special promotions (e.g., extended stay discounts), and flexible cancellation policies. Target off-season travelers like remote workers or budget-conscious guests.
- Shoulder Seasons: Implement dynamic pricing that balances peak and low rates. Target weekend travelers or specific events. Offer slightly more flexible terms than peak season.
- Regularly analyze your own performance against these Vicuña seasonality benchmarks and adjust your pricing and availability strategy accordingly.
Best Areas for Airbnb Investment in Vicuña (2026)
Exploring the top neighborhoods for short-term rentals in Vicuña? This section highlights key areas, outlining why they are attractive for hosts and guests, along with notable local attractions. Consider these locations based on your target guest profile and investment strategy.
| Neighborhood / Area | Why Host Here? (Target Guests & Appeal) | Key Attractions & Landmarks |
|---|---|---|
| Elqui Valley | A stunning valley known for its clear skies and beautiful landscapes, popular for stargazing and outdoor activities. It attracts tourists looking for a unique experience in nature, wine tasting, and relaxation. | Pisco Elqui, Valle del Elqui Observatory, Cochiguaz, Alcohuaz, Solar de Tipaume |
| Vicuña Town Center | The heart of Vicuña, offering cultural experiences, shops, and local cuisine. Ideal for tourists who want to explore the local culture and the surrounding areas. | Vicuña Plaza, Cozy local restaurants, Museo del Faro, Casa de Gabriela Mistral |
| Historic Valley Tour | This area showcases the history and traditions of the Elqui Valley, attracting visitors who wish to learn more about the region's heritage and natural beauty. | Historical farms, Traditional Pisco distilleries, Hiking trails, Cultural festivals |
| Pisco Elqui | Famous for its production of Pisco, this town is a must-visit for tourists interested in wine and spirit tours, with stunning views of the Andes. | Local distilleries, Scenic viewpoints, Nature walks |
| Andes Mountains Hikes | The mountain ranges offer breathtaking hikes and adventure experiences, attracting outdoor enthusiasts and nature lovers. | Hiking trails, Mountain biking, Photographic viewpoints |
| Maipo River Delights | This area provides recreational activities along the river, attracting families and active visitors looking to enjoy water sports and relaxation. | River activities, Picnic spots, Bicycle paths |
| Astronomical Observatories | The area is renowned for its observatories due to its clear skies, making it ideal for tourists interested in astronomy and stargazing. | Observatorio Mamalluca, Observatorio Collowara, Star-gazing tours |
| Local Cuisine Tours | Vicuña is known for its unique cuisine featuring local ingredients. Foodies will find a paradise with various culinary experiences. | Local markets, Gastronomic festivals, Pisco tasting, Traditional Chilean dishes |
Understanding Airbnb License Requirements & STR Laws in Vicuña (2026)
While Vicuña, Coquimbo Region, Chile currently shows low STR regulations, specific Airbnb license requirements might still exist or change. Always verify the latest short term rental regulations and Airbnb license requirements directly with local government authorities for Vicuña to ensure full compliance before hosting.
(Source: AirROI data, 2026, based on 1% licensed listings)
Top Performing Airbnb Properties in Vicuña (2026)
Benchmark your potential! Explore examples of top-performing Airbnb properties in Vicuñabased on Trailing Twelve Month (TTM) revenue. Analyze their characteristics, revenue, occupancy rate, and ADR to understand what drives success in this market.
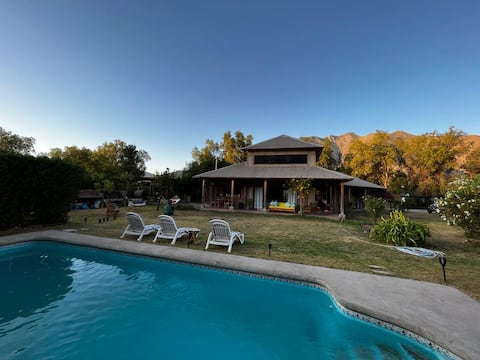
House in the Elqui Valley countryside
Entire Place • 4 bedrooms
House for 11 people with a private pool
Entire Place • 2 bedrooms
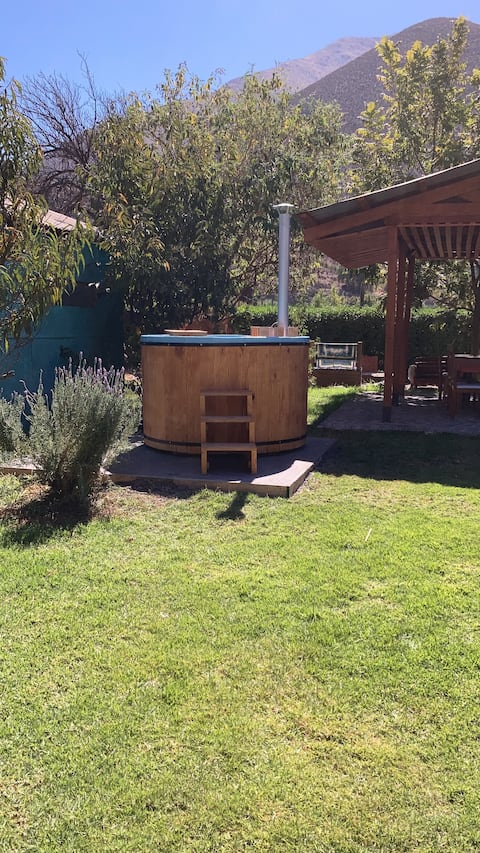
House in Valle del Elqui
Entire Place • 4 bedrooms
La Huerta House, Diaguitas
Entire Place • 4 bedrooms
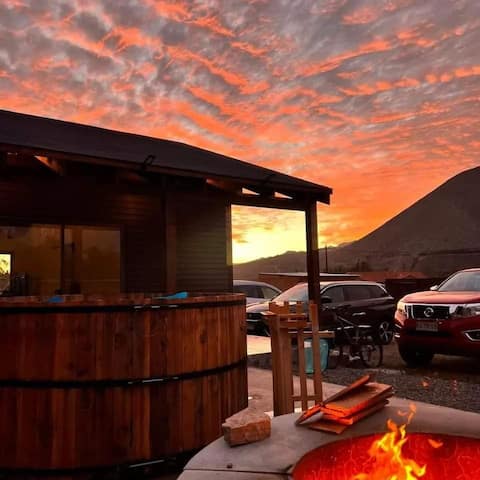
Cabaña Tres Cruces (Three Crosses Cabin) - Paihuano
Entire Place • 3 bedrooms

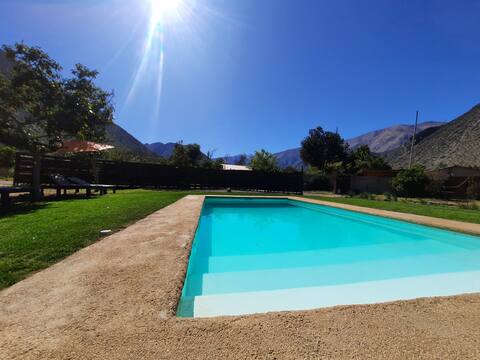
Casa Elqui Diaguitas – Pool and Mamalluca view
Entire Place • 3 bedrooms
Note: Performance varies based on location, size, amenities, seasonality, and management quality. Data reflects the past 12 months.
Top Performing Airbnb Hosts in Vicuña (2026)
Learn from the best! This table showcases top-performing Airbnb hosts in Vicuña based on the number of properties managed and estimated total revenue over the past year. Analyze their scale and performance metrics.
| Host Name | Properties | Grossing Revenue | Stay Reviews | Avg Rating |
|---|---|---|---|---|
| Enny | 3 | $52,900 | 263 | 4.99/5.0 |
| Jessica Del Pilar | 2 | $33,804 | 136 | 4.99/5.0 |
| Victor | 1 | $33,584 | 59 | 4.92/5.0 |
| Mauricio | 1 | $29,368 | 32 | 5.00/5.0 |
| Gabriel | 1 | $28,850 | 93 | 4.98/5.0 |
| Paulina | 1 | $27,372 | 71 | 4.86/5.0 |
| Nicolas | 1 | $27,368 | 78 | 4.88/5.0 |
| Nicolas | 1 | $26,868 | 132 | 4.99/5.0 |
| Elias Ignacio | 2 | $25,588 | 71 | 4.83/5.0 |
| Puclaro | 1 | $25,285 | 28 | 4.93/5.0 |
Analyzing the strategies of top hosts, such as their property selection, pricing, and guest communication, can offer valuable lessons for optimizing your own Airbnb operations in Vicuña.
Dive Deeper: Advanced Vicuña STR Market Data (2026)
Ready to unlock more insights? AirROI provides access to advanced metrics and comprehensive Airbnb data for Vicuña. Explore detailed analytics beyond this report to refine your investment strategy, optimize pricing, and maximize your vacation rental profits.
Explore Advanced MetricsVicuña Short-Term Rental Market Composition (2026): Property & Room Types
Room Type Distribution
Property Type Distribution
Market Composition Insights for Vicuña
- The Vicuña Airbnb market composition is heavily skewed towards Entire Home/Apt listings, which make up 68.1% of the 207 active rentals. This indicates strong guest preference for privacy and space.
- However, a notable 31.9% share for Private Rooms suggests opportunities for budget-conscious travelers or hosts renting out spare rooms.
- Looking at the property type distribution in Vicuña, House properties are the most common (36.7%), reflecting the local real estate landscape.
- Houses represent a significant 36.7% portion, catering likely to families or larger groups.
- The presence of 21.3% Hotel/Boutique listings indicates integration with traditional hospitality.
- Smaller segments like unique stays, others (combined 4.3%) offer potential for unique stay experiences.
Vicuña Airbnb Room Capacity Analysis (2026): Bedroom Distribution
Distribution of Listings by Number of Bedrooms
Room Capacity Insights for Vicuña
- The dominant room capacity in Vicuña is 2 bedrooms listings, making up 36.7% of the market. This suggests a strong demand for properties suitable for couples or solo travelers.
- Together, 2 bedrooms and 1 bedroom properties represent 63.3% of the active Airbnb listings in Vicuña, indicating a high concentration in these sizes.
- A significant 23.2% of listings offer 3+ bedrooms, catering to larger groups and families seeking more space in Vicuña.
Vicuña Vacation Rental Guest Capacity Trends (2026)
Distribution of Listings by Guest Capacity
Guest Capacity Insights for Vicuña
- The most common guest capacity trend in Vicuña vacation rentals is listings accommodating 4 guests (26.1%). This suggests the primary traveler segment is likely small families or groups.
- Properties designed for 4 guests and 6 guests dominate the Vicuña STR market, accounting for 42.0% of listings.
- 28.9% of properties accommodate 6+ guests, serving the market segment for larger families or group travel in Vicuña.
- On average, properties in Vicuña are equipped to host 4.0 guests.
Vicuña Airbnb Booking Patterns (2026): Available vs. Booked Days
Available Days Distribution
Booked Days Distribution
Booking Pattern Insights for Vicuña
- The most common availability pattern in Vicuña falls within the 271-366 days range, representing 79.2% of listings. This suggests many properties have significant open periods on their calendars.
- Approximately 93.7% of listings show high availability (181+ days open annually), indicating potential for increased bookings or specific owner usage patterns.
- For booked days, the 1-30 days range is most frequent in Vicuña (41.1%), reflecting common guest stay durations or potential owner blocking patterns.
- A notable 6.3% of properties secure long booking periods (181+ days booked per year), highlighting successful long-term rental strategies or significant owner usage.
Vicuña Airbnb Minimum Stay Requirements Analysis
Distribution of Listings by Minimum Night Requirement
1 Night
89 listings
43% of total
2 Nights
61 listings
29.5% of total
3 Nights
10 listings
4.8% of total
4-6 Nights
1 listings
0.5% of total
30+ Nights
46 listings
22.2% of total
Key Insights
- The most prevalent minimum stay requirement in Vicuña is 1 Night, adopted by 43% of listings. This highlights the market's preference for shorter, flexible bookings.
- A strong majority (72.5%) of the Vicuña Airbnb data shows acceptance of very short stays (1-2 nights), indicating a dynamic, high-turnover market.
- A significant segment (22.2%) caters to monthly stays (30+ nights) in Vicuña, pointing to opportunities in the extended-stay market.
Recommendations
- Align with the market by considering a 1 Night minimum stay, as 43% of Vicuña hosts use this setting.
- Explore offering discounts for stays of 30+ nights to attract the 22.2% of the market seeking extended stays.
- Adjust minimum nights based on seasonality – potentially shorter during low season and longer during peak demand periods in Vicuña.
Vicuña Airbnb Cancellation Policy Trends Analysis (2026)
Limited
3 listings
1.5% of total
Flexible
110 listings
53.4% of total
Moderate
61 listings
29.6% of total
Firm
30 listings
14.6% of total
Strict
2 listings
1% of total
Cancellation Policy Insights for Vicuña
- The prevailing Airbnb cancellation policy trend in Vicuña is Flexible, used by 53.4% of listings.
- The market strongly favors guest-friendly terms, with 83.0% of listings offering Flexible or Moderate policies. This suggests guests in Vicuña may expect booking flexibility.
- Strict cancellation policies are quite rare (1%), potentially making listings with this policy less competitive unless justified by high demand or property type.
Recommendations for Hosts
- Consider adopting a Flexible policy to align with the 53.4% market standard in Vicuña.
- Given the high prevalence of Flexible policies (53.4%), offering this can enhance booking appeal, especially during shoulder seasons.
- Using a Strict policy might deter some guests, as only 1% of listings use it. Evaluate if potential revenue protection outweighs possible lower booking rates.
- Regularly review your cancellation policy against competitors and market demand shifts in Vicuña.
Vicuña STR Booking Lead Time Analysis (2026)
Average Booking Lead Time by Month
Booking Lead Time Insights for Vicuña
- The overall average booking lead time for vacation rentals in Vicuña is 21 days.
- Guests book furthest in advance for stays during December (average 31 days), likely coinciding with peak travel demand or local events.
- The shortest booking windows occur for stays in June (average 11 days), indicating more last-minute travel plans during this time.
- Seasonally, Winter (27 days avg.) sees the longest lead times, while Summer (15 days avg.) has the shortest, reflecting typical travel planning cycles.
Recommendations for Hosts
- Use the overall average lead time (21 days) as a baseline for your pricing and availability strategy in Vicuña.
- During June, focus on last-minute booking availability and promotions, as guests book with very short notice (11 days avg.).
- Target marketing efforts for the Winter season well in advance (at least 27 days) to capture early planners.
- Monitor your own booking lead times against these Vicuña averages to identify opportunities for dynamic pricing adjustments.
Popular & Essential Airbnb Amenities in Vicuña (2026)
Amenity Prevalence
Amenity Insights for Vicuña
- Popular amenities like Free parking on premises, Kitchen, BBQ grill are common but not universal. Offering these can provide a competitive edge.
- A pool is a highly desired but not standard amenity, making it a key feature for attracting guests seeking leisure in Vicuña.
- Warning: Wifi is not universally provided but is considered essential globally. Ensure reliable Wifi is offered.
Recommendations for Hosts
- Consider adding popular differentiators like Free parking on premises or Kitchen to increase appeal.
- Highlight unique or less common amenities you offer (e.g., hot tub, dedicated workspace, EV charger) in your listing description and photos.
- Regularly check competitor amenities in Vicuña to stay competitive.
Vicuña Airbnb Guest Demographics & Profile Analysis (2026)
Guest Profile Summary for Vicuña
- The typical guest profile for Airbnb in Vicuña consists of primarily domestic travelers (71%), often arriving from nearby Santiago, typically belonging to the Post-2000s (Gen Z/Alpha) group (50%), primarily speaking Spanish or English.
- Domestic travelers account for 70.9% of guests.
- Key international markets include Chile (70.9%) and France (9.4%).
- Top languages spoken are Spanish (46.4%) followed by English (30%).
- A significant demographic segment is the Post-2000s (Gen Z/Alpha) group, representing 50% of guests.
Recommendations for Hosts
- Target domestic marketing efforts towards travelers from Santiago and La Serena.
- Tailor amenities and listing descriptions to appeal to the dominant Post-2000s (Gen Z/Alpha) demographic (e.g., highlight fast WiFi, smart home features, local guides).
- Highlight unique local experiences or amenities relevant to the primary guest profile.
- Consider seasonal promotions aligned with peak travel times for key origin markets.
Nearby Short-Term Rental Market Comparison
How does the Vicuña Airbnb market stack up against its neighbors? Compare key performance metrics like average monthly revenue, ADR, and occupancy rates in surrounding areas to understand the broader regional STR landscape.