Los Vilos Airbnb Market Analysis 2026: Short Term Rental Data & Vacation Rental Statistics in Coquimbo Region, Chile
Is Airbnb profitable in Los Vilos in 2026? Explore comprehensive Airbnb analytics for Los Vilos, Coquimbo Region, Chile to uncover income potential. This 2026 STR market report for Los Vilos, based on AirROI data from February 2025 to January 2026, reveals key trends in the niche market of 192 active listings.
Whether you're considering an Airbnb investment in Los Vilos, optimizing your existing vacation rental, or exploring rental arbitrage opportunities, understanding the Los Vilos Airbnb data is crucial. Leveraging the low regulation environment is key to maximizing your short term rental income potential. Let's dive into the specifics.
Key Los Vilos Airbnb Performance Metrics Overview
Monthly Airbnb Revenue Variations & Income Potential in Los Vilos (2026)
Understanding the monthly revenue variations for Airbnb listings in Los Vilos is key to maximizing your short term rental income potential. Seasonality significantly impacts earnings. Our analysis, based on data from the past 12 months, shows that the peak revenue month for STRs in Los Vilos is typically February, while August often presents the lowest earnings, highlighting opportunities for strategic pricing adjustments during shoulder and low seasons. Explore the typical Airbnb income in Los Vilos across different performance tiers:
- Best-in-class properties (Top 10%) achieve $2,194+ monthly, often utilizing dynamic pricing and superior guest experiences.
- Strong performing properties (Top 25%) earn $1,197 or more, indicating effective management and desirable locations/amenities.
- Typical properties (Median) generate around $555 per month, representing the average market performance.
- Entry-level properties (Bottom 25%) see earnings around $258, often with potential for optimization.
Average Monthly Airbnb Earnings Trend in Los Vilos
Los Vilos Airbnb Occupancy Rate Trends (2026)
Maximize your bookings by understanding the Los Vilos STR occupancy trends. Seasonal demand shifts significantly influence how often properties are booked. Typically, Februarysees the highest demand (peak season occupancy), while August experiences the lowest (low season). Effective strategies, like adjusting minimum stays or offering promotions, can boost occupancy during slower periods. Here's how different property tiers perform in Los Vilos:
- Best-in-class properties (Top 10%) achieve 50%+ occupancy, indicating high desirability and potentially optimized availability.
- Strong performing properties (Top 25%) maintain 34% or higher occupancy, suggesting good market fit and guest satisfaction.
- Typical properties (Median) have an occupancy rate around 21%.
- Entry-level properties (Bottom 25%) average 10% occupancy, potentially facing higher vacancy.
Average Monthly Occupancy Rate Trend in Los Vilos
Average Daily Rate (ADR) Airbnb Trends in Los Vilos (2026)
Effective short term rental pricing strategy in Los Vilos involves understanding monthly ADR fluctuations. The Average Daily Rate (ADR) for Airbnb in Los Vilos typically peaks in September and dips lowest during March. Leveraging Airbnb dynamic pricing tools or strategies based on this seasonality can significantly boost revenue. Here's a look at the typical nightly rates achieved:
- Best-in-class properties (Top 10%) command rates of $218+ per night, often due to premium features or locations.
- Strong performing properties (Top 25%) achieve nightly rates of $137 or more.
- Typical properties (Median) charge around $87 per night.
- Entry-level properties (Bottom 25%) earn around $58 per night.
Average Daily Rate (ADR) Trend by Month in Los Vilos
Get Live Los Vilos Market Intelligence 👇

Explore Real-time Analytics
Airbnb Seasonality Analysis & Trends in Los Vilos (2026)
Peak Season (February, January, March)
- Revenue averages $1,438 per month
- Occupancy rates average 40.9%
- Daily rates average $110
Shoulder Season
- Revenue averages $810 per month
- Occupancy maintains around 20.9%
- Daily rates hold near $111
Low Season (August, October, November)
- Revenue drops to average $603 per month
- Occupancy decreases to average 16.2%
- Daily rates adjust to average $111
Seasonality Insights for Los Vilos
- The Airbnb seasonality in Los Vilos shows highly seasonal trends requiring careful strategy. While the sections above show seasonal averages, it's also insightful to look at the extremes:
- During the high season, the absolute peak month showcases Los Vilos's highest earning potential, with monthly revenues capable of climbing to $1,988, occupancy reaching a high of 58.3%, and ADRs peaking at $114.
- Conversely, the slowest single month of the year, typically falling within the low season, marks the market's lowest point. In this month, revenue might dip to $586, occupancy could drop to 14.9%, and ADRs may adjust down to $106.
- Understanding both the seasonal averages and these monthly peaks and troughs in revenue, occupancy, and ADR is crucial for maximizing your Airbnb profit potential in Los Vilos.
Seasonal Strategies for Maximizing Profit
- Peak Season: Maximize revenue through premium pricing and potentially longer minimum stays. Ensure high availability.
- Low Season: Offer competitive pricing, special promotions (e.g., extended stay discounts), and flexible cancellation policies. Target off-season travelers like remote workers or budget-conscious guests.
- Shoulder Seasons: Implement dynamic pricing that balances peak and low rates. Target weekend travelers or specific events. Offer slightly more flexible terms than peak season.
- Regularly analyze your own performance against these Los Vilos seasonality benchmarks and adjust your pricing and availability strategy accordingly.
Best Areas for Airbnb Investment in Los Vilos (2026)
Exploring the top neighborhoods for short-term rentals in Los Vilos? This section highlights key areas, outlining why they are attractive for hosts and guests, along with notable local attractions. Consider these locations based on your target guest profile and investment strategy.
| Neighborhood / Area | Why Host Here? (Target Guests & Appeal) | Key Attractions & Landmarks |
|---|---|---|
| Playa Los Vilos | A stunning beach area known for its warm waters and beautiful scenery. It's a popular spot for both locals and tourists, making it ideal for vacation rentals. | Los Vilos Beach, Dunar de Los Vilos, El Faro de Los Vilos, Coastal Nature Reserve, Fishing and water sports activities |
| Los Vilos Town Center | The bustling downtown area offers various amenities, shops, and cultural attractions. A great place for guests looking to experience local life in Los Vilos. | Plaza de Armas, Local markets, Restaurants and cafes, Historic buildings, Cultural festivals |
| Pampa de Tabagí | A beautiful natural area nearby known for its tranquil surroundings and rural charm. Perfect for eco-tourism and visitors looking for peace and nature. | Nature trails, Birdwatching, Outdoor activities, Scenic views, Campsites |
| Cerro Blanco | Offers panoramic views of the surrounding region and is a popular spot for hiking enthusiasts. Ideal for those seeking outdoor adventures. | Hiking trails, Scenic viewpoints, Nature photography, Rural landscapes |
| Pueblo de Los Vilos | A quaint village atmosphere provides a glimpse into traditional Chilean life, enriching the visitor experience with local culture and hospitality. | Chilean crafts shops, Local cuisine, Community events, Cultural heritage sites |
| Bajo La Misión | Known for its beautiful coastal cliffs and ocean views, this area is suitable for travelers seeking scenic beauty and adventure. | Cliffside walks, Ocean views, Wildlife watching, Photography spots |
| Calle de Los Vilos | A vibrant street known for its nightlife and local eateries, attracting young travelers and families looking for dining options into the late hours. | Restaurants, Bars, Street vendors, Local entertainment, Nightlife |
| Surco | A more secluded area known for its peace and quiet, making it a great choice for families and those looking to escape the noise of the city. | Quiet beaches, Serene environment, Relaxation spots, Picnic areas |
Understanding Airbnb License Requirements & STR Laws in Los Vilos (2026)
While Los Vilos, Coquimbo Region, Chile currently shows low STR regulations, specific Airbnb license requirements might still exist or change. Always verify the latest short term rental regulations and Airbnb license requirements directly with local government authorities for Los Vilos to ensure full compliance before hosting.
(Source: AirROI data, 2026, based on 2% licensed listings)
Top Performing Airbnb Properties in Los Vilos (2026)
Benchmark your potential! Explore examples of top-performing Airbnb properties in Los Vilosbased on Trailing Twelve Month (TTM) revenue. Analyze their characteristics, revenue, occupancy rate, and ADR to understand what drives success in this market.
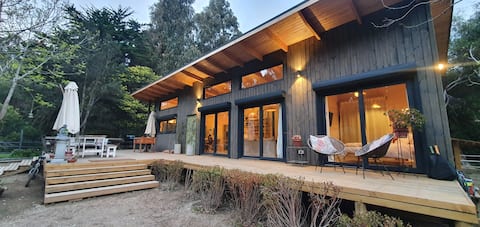
New and Modern Pichidangui House
Entire Place • 4 bedrooms

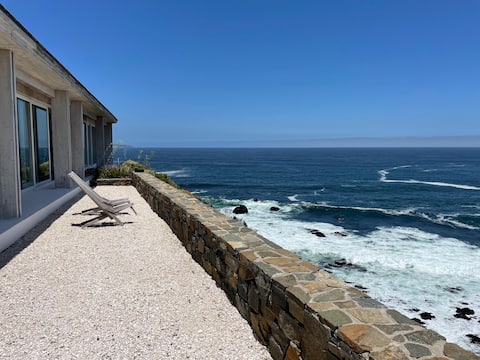
BAHÍA AZUL First line Architect Cecilia Puga
Entire Place • 4 bedrooms
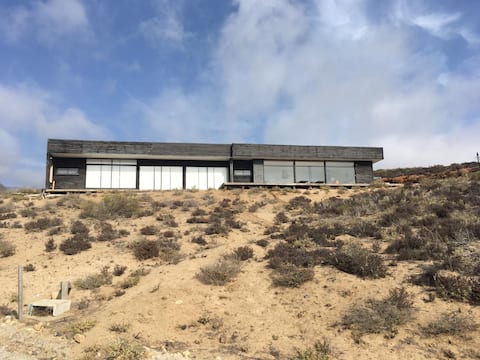
Chigualoco, Huentelauquén
Entire Place • 3 bedrooms
Spectacular house for 2 families on the beachfront
Entire Place • 5 bedrooms
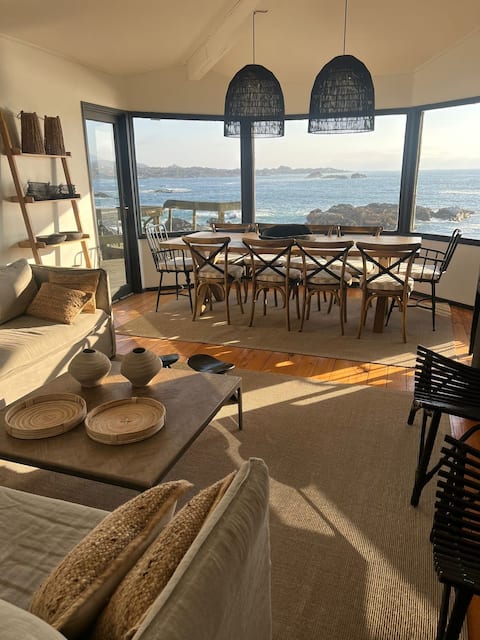
House to rest. Extraordinary ocean view
Entire Place • 3 bedrooms

Unique house with incredible oceanfront view.
Entire Place • 5 bedrooms
Note: Performance varies based on location, size, amenities, seasonality, and management quality. Data reflects the past 12 months.
Top Performing Airbnb Hosts in Los Vilos (2026)
Learn from the best! This table showcases top-performing Airbnb hosts in Los Vilos based on the number of properties managed and estimated total revenue over the past year. Analyze their scale and performance metrics.
| Host Name | Properties | Grossing Revenue | Stay Reviews | Avg Rating |
|---|---|---|---|---|
| Carlos | 6 | $67,596 | 31 | 4.92/5.0 |
| Olivia | 1 | $43,486 | 16 | 5.00/5.0 |
| Barbara | 1 | $39,187 | 116 | 4.74/5.0 |
| Augusta | 1 | $32,417 | 5 | 5.00/5.0 |
| Macarena | 1 | $32,361 | 7 | 4.57/5.0 |
| Clemente | 1 | $31,881 | 57 | 4.95/5.0 |
| Daina Y Esteban | 1 | $31,083 | 5 | 5.00/5.0 |
| Luis Eduardo | 1 | $29,437 | 20 | 5.00/5.0 |
| Maria Paz | 1 | $28,669 | 8 | 4.88/5.0 |
| Gaston | 1 | $27,711 | 11 | 5.00/5.0 |
Analyzing the strategies of top hosts, such as their property selection, pricing, and guest communication, can offer valuable lessons for optimizing your own Airbnb operations in Los Vilos.
Dive Deeper: Advanced Los Vilos STR Market Data (2026)
Ready to unlock more insights? AirROI provides access to advanced metrics and comprehensive Airbnb data for Los Vilos. Explore detailed analytics beyond this report to refine your investment strategy, optimize pricing, and maximize your vacation rental profits.
Explore Advanced MetricsLos Vilos Short-Term Rental Market Composition (2026): Property & Room Types
Room Type Distribution
Property Type Distribution
Market Composition Insights for Los Vilos
- The Los Vilos Airbnb market composition is heavily skewed towards Entire Home/Apt listings, which make up 94.8% of the 192 active rentals. This indicates strong guest preference for privacy and space.
- Looking at the property type distribution in Los Vilos, House properties are the most common (52.6%), reflecting the local real estate landscape.
- Houses represent a significant 52.6% portion, catering likely to families or larger groups.
- Smaller segments like hotel/boutique, unique stays, others, apartment/condo (combined 7.8%) offer potential for unique stay experiences.
Los Vilos Airbnb Room Capacity Analysis (2026): Bedroom Distribution
Distribution of Listings by Number of Bedrooms
Room Capacity Insights for Los Vilos
- The dominant room capacity in Los Vilos is 3 bedrooms listings, making up 31.8% of the market. This suggests a strong demand for properties suitable for families or small groups.
- Together, 3 bedrooms and 2 bedrooms properties represent 63.6% of the active Airbnb listings in Los Vilos, indicating a high concentration in these sizes.
- A significant 54.2% of listings offer 3+ bedrooms, catering to larger groups and families seeking more space in Los Vilos.
Los Vilos Vacation Rental Guest Capacity Trends (2026)
Distribution of Listings by Guest Capacity
Guest Capacity Insights for Los Vilos
- The most common guest capacity trend in Los Vilos vacation rentals is listings accommodating 8+ guests (27.1%). This suggests the primary traveler segment is likely larger groups.
- Properties designed for 8+ guests and 4 guests dominate the Los Vilos STR market, accounting for 45.9% of listings.
- 51.0% of properties accommodate 6+ guests, serving the market segment for larger families or group travel in Los Vilos.
- On average, properties in Los Vilos are equipped to host 5.6 guests.
Los Vilos Airbnb Booking Patterns (2026): Available vs. Booked Days
Available Days Distribution
Booked Days Distribution
Booking Pattern Insights for Los Vilos
- The most common availability pattern in Los Vilos falls within the 271-366 days range, representing 81.8% of listings. This suggests many properties have significant open periods on their calendars.
- Approximately 98.5% of listings show high availability (181+ days open annually), indicating potential for increased bookings or specific owner usage patterns.
- For booked days, the 31-90 days range is most frequent in Los Vilos (42.2%), reflecting common guest stay durations or potential owner blocking patterns.
- A notable 1.6% of properties secure long booking periods (181+ days booked per year), highlighting successful long-term rental strategies or significant owner usage.
Los Vilos Airbnb Minimum Stay Requirements Analysis
Distribution of Listings by Minimum Night Requirement
1 Night
43 listings
22.4% of total
2 Nights
56 listings
29.2% of total
3 Nights
28 listings
14.6% of total
4-6 Nights
16 listings
8.3% of total
7-29 Nights
1 listings
0.5% of total
30+ Nights
48 listings
25% of total
Key Insights
- The most prevalent minimum stay requirement in Los Vilos is 2 Nights, adopted by 29.2% of listings. This highlights the market's preference for shorter, flexible bookings.
- A significant segment (25%) caters to monthly stays (30+ nights) in Los Vilos, pointing to opportunities in the extended-stay market.
Recommendations
- Align with the market by considering a 2 Nights minimum stay, as 29.2% of Los Vilos hosts use this setting.
- If feasible, allowing 1-night stays, especially midweek or during low season, could capture last-minute bookings, as only 22.4% currently do.
- Explore offering discounts for stays of 30+ nights to attract the 25% of the market seeking extended stays.
- Adjust minimum nights based on seasonality – potentially shorter during low season and longer during peak demand periods in Los Vilos.
Los Vilos Airbnb Cancellation Policy Trends Analysis (2026)
Limited
7 listings
3.7% of total
Flexible
72 listings
37.7% of total
Moderate
69 listings
36.1% of total
Firm
35 listings
18.3% of total
Strict
8 listings
4.2% of total
Cancellation Policy Insights for Los Vilos
- The prevailing Airbnb cancellation policy trend in Los Vilos is Flexible, used by 37.7% of listings.
- The market strongly favors guest-friendly terms, with 73.8% of listings offering Flexible or Moderate policies. This suggests guests in Los Vilos may expect booking flexibility.
- Strict cancellation policies are quite rare (4.2%), potentially making listings with this policy less competitive unless justified by high demand or property type.
Recommendations for Hosts
- Consider adopting a Flexible policy to align with the 37.7% market standard in Los Vilos.
- Using a Strict policy might deter some guests, as only 4.2% of listings use it. Evaluate if potential revenue protection outweighs possible lower booking rates.
- Regularly review your cancellation policy against competitors and market demand shifts in Los Vilos.
Los Vilos STR Booking Lead Time Analysis (2026)
Average Booking Lead Time by Month
Booking Lead Time Insights for Los Vilos
- The overall average booking lead time for vacation rentals in Los Vilos is 18 days.
- Guests book furthest in advance for stays during September (average 30 days), likely coinciding with peak travel demand or local events.
- The shortest booking windows occur for stays in July (average 9 days), indicating more last-minute travel plans during this time.
- Seasonally, Winter (24 days avg.) sees the longest lead times, while Summer (11 days avg.) has the shortest, reflecting typical travel planning cycles.
Recommendations for Hosts
- Use the overall average lead time (18 days) as a baseline for your pricing and availability strategy in Los Vilos.
- For September stays, consider implementing length-of-stay discounts or slightly higher rates for bookings made less than 30 days out to capitalize on advance planning.
- During July, focus on last-minute booking availability and promotions, as guests book with very short notice (9 days avg.).
- Target marketing efforts for the Winter season well in advance (at least 24 days) to capture early planners.
- Monitor your own booking lead times against these Los Vilos averages to identify opportunities for dynamic pricing adjustments.
Popular & Essential Airbnb Amenities in Los Vilos (2026)
Amenity Prevalence
Amenity Insights for Los Vilos
- Essential amenities in Los Vilos that guests expect include: Free parking on premises. Lacking these (this) could significantly impact bookings.
- Popular amenities like Kitchen, TV, Hot water are common but not universal. Offering these can provide a competitive edge.
- Warning: Wifi is not universally provided but is considered essential globally. Ensure reliable Wifi is offered.
Recommendations for Hosts
- Ensure your listing includes all essential amenities for Los Vilos: Free parking on premises.
- Prioritize adding missing essentials: Free parking on premises.
- Consider adding popular differentiators like Kitchen or TV to increase appeal.
- Highlight unique or less common amenities you offer (e.g., hot tub, dedicated workspace, EV charger) in your listing description and photos.
- Regularly check competitor amenities in Los Vilos to stay competitive.
Los Vilos Airbnb Guest Demographics & Profile Analysis (2026)
Guest Profile Summary for Los Vilos
- The typical guest profile for Airbnb in Los Vilos consists of primarily domestic travelers (90%), often arriving from nearby Santiago, typically belonging to the Post-2000s (Gen Z/Alpha) group (50%), primarily speaking Spanish or English.
- Domestic travelers account for 89.7% of guests.
- Key international markets include Chile (89.7%) and France (2.5%).
- Top languages spoken are Spanish (51.2%) followed by English (33.7%).
- A significant demographic segment is the Post-2000s (Gen Z/Alpha) group, representing 50% of guests.
Recommendations for Hosts
- Target domestic marketing efforts towards travelers from Santiago and Santiago Metropolitan Region.
- Tailor amenities and listing descriptions to appeal to the dominant Post-2000s (Gen Z/Alpha) demographic (e.g., highlight fast WiFi, smart home features, local guides).
- Highlight unique local experiences or amenities relevant to the primary guest profile.
- Consider seasonal promotions aligned with peak travel times for key origin markets.
Nearby Short-Term Rental Market Comparison
How does the Los Vilos Airbnb market stack up against its neighbors? Compare key performance metrics like average monthly revenue, ADR, and occupancy rates in surrounding areas to understand the broader regional STR landscape.
| Market | Active Properties | Monthly Revenue | Daily Rate | Avg. Occupancy |
|---|---|---|---|---|
| Lo Barnechea | 483 | $2,018 | $372.13 | 42% |
| Canela | 58 | $1,410 | $226.71 | 27% |
| Zapallar | 534 | $1,323 | $258.51 | 28% |
| Peñaflor | 12 | $1,232 | $164.71 | 30% |
| Casablanca | 241 | $1,095 | $165.43 | 30% |
| Vitacura | 257 | $1,062 | $128.87 | 42% |
| Las Condes | 1,652 | $1,007 | $87.62 | 48% |
| Santo Domingo | 228 | $947 | $186.52 | 27% |
| Puchuncaví | 1,114 | $941 | $170.29 | 29% |
| Navidad | 679 | $895 | $140.10 | 27% |