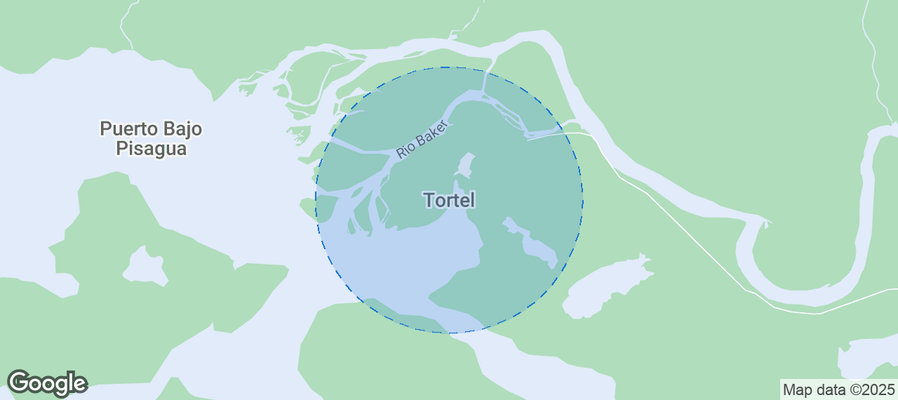
Tortel Airbnb Market Analysis 2025: Short Term Rental Data & Vacation Rental Statistics in Aysen del General Carlos Ibanez del Campo Region, Chile
Is Airbnb profitable in Tortel in 2025? Explore comprehensive Airbnb analytics for Tortel, Aysen del General Carlos Ibanez del Campo Region, Chile to uncover income potential. This 2025 STR market report for Tortel, based on AirROI data from November 2024 to October 2025, reveals key trends in the niche market of 17 active listings.
Whether you're considering an Airbnb investment in Tortel, optimizing your existing vacation rental, or exploring rental arbitrage opportunities, understanding the Tortel Airbnb data is crucial. Leveraging the low regulation environment is key to maximizing your short term rental income potential. Let's dive into the specifics.
Key Tortel Airbnb Performance Metrics Overview
Monthly Airbnb Revenue Variations & Income Potential in Tortel (2025)
Understanding the monthly revenue variations for Airbnb listings in Tortel is key to maximizing your short term rental income potential. Seasonality significantly impacts earnings. Our analysis, based on data from the past 12 months, shows that the peak revenue month for STRs in Tortel is typically December, while July often presents the lowest earnings, highlighting opportunities for strategic pricing adjustments during shoulder and low seasons. Explore the typical Airbnb income in Tortel across different performance tiers:
- Best-in-class properties (Top 10%) achieve $1,244+ monthly, often utilizing dynamic pricing and superior guest experiences.
- Strong performing properties (Top 25%) earn $865 or more, indicating effective management and desirable locations/amenities.
- Typical properties (Median) generate around $499 per month, representing the average market performance.
- Entry-level properties (Bottom 25%) see earnings around $236, often with potential for optimization.
Average Monthly Airbnb Earnings Trend in Tortel
Tortel Airbnb Occupancy Rate Trends (2025)
Maximize your bookings by understanding the Tortel STR occupancy trends. Seasonal demand shifts significantly influence how often properties are booked. Typically, Februarysees the highest demand (peak season occupancy), while July experiences the lowest (low season). Effective strategies, like adjusting minimum stays or offering promotions, can boost occupancy during slower periods. Here's how different property tiers perform in Tortel:
- Best-in-class properties (Top 10%) achieve 56%+ occupancy, indicating high desirability and potentially optimized availability.
- Strong performing properties (Top 25%) maintain 41% or higher occupancy, suggesting good market fit and guest satisfaction.
- Typical properties (Median) have an occupancy rate around 23%.
- Entry-level properties (Bottom 25%) average 13% occupancy, potentially facing higher vacancy.
Average Monthly Occupancy Rate Trend in Tortel
Average Daily Rate (ADR) Airbnb Trends in Tortel (2025)
Effective short term rental pricing strategy in Tortel involves understanding monthly ADR fluctuations. The Average Daily Rate (ADR) for Airbnb in Tortel typically peaks in May and dips lowest during October. Leveraging Airbnb dynamic pricing tools or strategies based on this seasonality can significantly boost revenue. Here's a look at the typical nightly rates achieved:
- Best-in-class properties (Top 10%) command rates of $92+ per night, often due to premium features or locations.
- Strong performing properties (Top 25%) achieve nightly rates of $79 or more.
- Typical properties (Median) charge around $61 per night.
- Entry-level properties (Bottom 25%) earn around $54 per night.
Average Daily Rate (ADR) Trend by Month in Tortel
Get Live Tortel Market Intelligence 👇
Explore Real-time Analytics
Airbnb Seasonality Analysis & Trends in Tortel (2025)
Peak Season (December, February, January)
- Revenue averages $978 per month
- Occupancy rates average 44.0%
- Daily rates average $67
Shoulder Season
- Revenue averages $504 per month
- Occupancy maintains around 25.9%
- Daily rates hold near $66
Low Season (July, August, September)
- Revenue drops to average $196 per month
- Occupancy decreases to average 8.7%
- Daily rates adjust to average $63
Seasonality Insights for Tortel
- The Airbnb seasonality in Tortel shows highly seasonal trends requiring careful strategy. While the sections above show seasonal averages, it's also insightful to look at the extremes:
- During the high season, the absolute peak month showcases Tortel's highest earning potential, with monthly revenues capable of climbing to $1,145, occupancy reaching a high of 48.5%, and ADRs peaking at $68.
- Conversely, the slowest single month of the year, typically falling within the low season, marks the market's lowest point. In this month, revenue might dip to $0, occupancy could drop to 0.0%, and ADRs may adjust down to $62.
- Understanding both the seasonal averages and these monthly peaks and troughs in revenue, occupancy, and ADR is crucial for maximizing your Airbnb profit potential in Tortel.
Seasonal Strategies for Maximizing Profit
- Peak Season: Maximize revenue through premium pricing and potentially longer minimum stays. Ensure high availability.
- Low Season: Offer competitive pricing, special promotions (e.g., extended stay discounts), and flexible cancellation policies. Target off-season travelers like remote workers or budget-conscious guests.
- Shoulder Seasons: Implement dynamic pricing that balances peak and low rates. Target weekend travelers or specific events. Offer slightly more flexible terms than peak season.
- Regularly analyze your own performance against these Tortel seasonality benchmarks and adjust your pricing and availability strategy accordingly.
Best Areas for Airbnb Investment in Tortel (2025)
Exploring the top neighborhoods for short-term rentals in Tortel? This section highlights key areas, outlining why they are attractive for hosts and guests, along with notable local attractions. Consider these locations based on your target guest profile and investment strategy.
| Neighborhood / Area | Why Host Here? (Target Guests & Appeal) | Key Attractions & Landmarks |
|---|---|---|
| Cerro Castillo | A quaint village set against stunning mountain backdrops, offering unique local culture and connectivity to beautiful hiking trails. | Cerro Castillo National Reserve, Cerro Castillo volcano, local artisan shops, natural hot springs |
| Tortel Village | Known for its charming wooden walkways and the picturesque view of the fjords, it's perfect for tourists seeking a unique coastal experience. | Wooden walkways, Patagonia River, local seafood restaurants, scenic viewpoints |
| Laguna San Rafael | A beautiful national park area which attracts adventure seekers and nature lovers for its glaciers and stunning landscapes. | San Rafael Glacier, Kayaking, Wildlife sighting, Hiking trails |
| Puerto Edén | Remote and peaceful, this small village offers isolation and natural beauty, ideal for eco-tourism and visitors seeking tranquility. | Local indigenous culture, Natural scenery, Fishing opportunities |
| Balmaceda | A gateway to various Patagonia attractions, attracts travelers routinely passing through to get to other striking natural locations. | Near to various hitching trails, Cerro La Vieja, Cerro Dorotea |
| Fjords of Aysén | Tourists are drawn here for breathtaking fjord landscapes and unique ecosystems for nature exploration and relaxation. | Scenic fjord tours, Bird watching, Hiking along the fjords |
| Queulat National Park | A highlight for nature lovers, offering incredible trails and views of the Queulat Glacier and lush forests. | Queulat Glacier, Lush rainforest, Scenic walks and hikes, Wildlife viewing |
| Río Baker | One of the largest and most beautiful rivers in Chile, great for adventure sports and outdoor activities. | White-water rafting, Kayaking, Fishing, Natural hot springs nearby |
Understanding Airbnb License Requirements & STR Laws in Tortel (2025)
While Tortel, Aysen del General Carlos Ibanez del Campo Region, Chile currently shows low STR regulations, specific Airbnb license requirements might still exist or change. Always verify the latest short term rental regulations and Airbnb license requirements directly with local government authorities for Tortel to ensure full compliance before hosting.
(Source: AirROI data, 2025, finding no licensed listings among those analyzed)
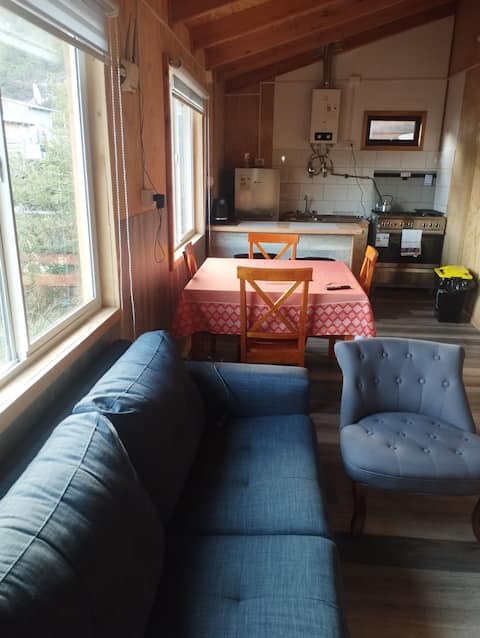
Top Performing Airbnb Properties in Tortel (2025)
Benchmark your potential! Explore examples of top-performing Airbnb properties in Tortelbased on Trailing Twelve Month (TTM) revenue. Analyze their characteristics, revenue, occupancy rate, and ADR to understand what drives success in this market.
amber cabin
Entire Place • 2 bedrooms

PANORAMIC view, 30 meters from the parking lot.
Entire Place • 2 bedrooms
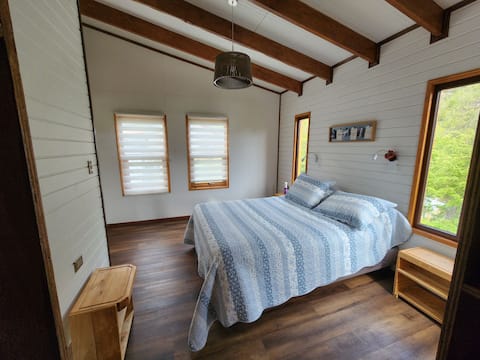
1 room for 2 people with a double bed.
Private Room • N/A

Room with a full bed.
Private Room • N/A

1 room with 2 single beds
Private Room • N/A
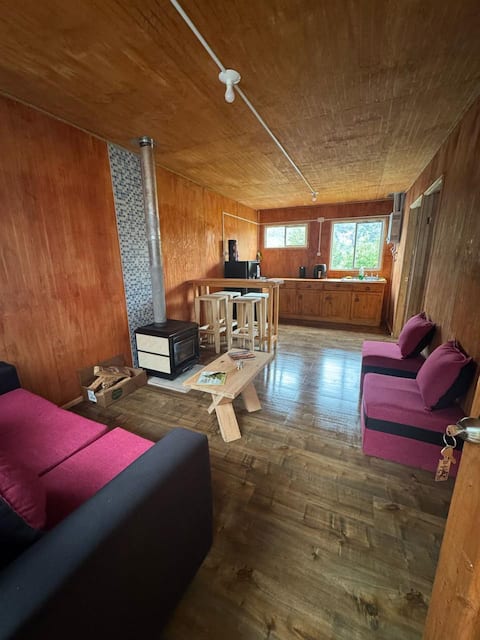
Cabin Don Esteban II
Entire Place • 2 bedrooms
Note: Performance varies based on location, size, amenities, seasonality, and management quality. Data reflects the past 12 months.
Top Performing Airbnb Hosts in Tortel (2025)
Learn from the best! This table showcases top-performing Airbnb hosts in Tortel based on the number of properties managed and estimated total revenue over the past year. Analyze their scale and performance metrics.
| Host Name | Properties | Grossing Revenue | Stay Reviews | Avg Rating |
|---|---|---|---|---|
| Javiera | 3 | $22,202 | 96 | 4.97/5.0 |
| Roxana | 6 | $15,569 | 26 | 4.76/5.0 |
| Bernarda | 1 | $13,496 | 63 | 4.97/5.0 |
| Katy | 1 | $9,124 | 97 | 4.56/5.0 |
| Norma | 1 | $5,264 | 26 | 4.54/5.0 |
| Arcenio | 3 | $4,271 | 53 | 4.67/5.0 |
| Iris Alicia | 2 | $2,802 | 7 | 4.29/5.0 |
Analyzing the strategies of top hosts, such as their property selection, pricing, and guest communication, can offer valuable lessons for optimizing your own Airbnb operations in Tortel.
Dive Deeper: Advanced Tortel STR Market Data (2025)
Ready to unlock more insights? AirROI provides access to advanced metrics and comprehensive Airbnb data for Tortel. Explore detailed analytics beyond this report to refine your investment strategy, optimize pricing, and maximize your vacation rental profits.
Explore Advanced MetricsTortel Short-Term Rental Market Composition (2025): Property & Room Types
Room Type Distribution
Property Type Distribution
Market Composition Insights for Tortel
- The Tortel Airbnb market composition is heavily skewed towards Private Room listings, which make up 52.9% of the 17 active rentals. This indicates strong guest preference for privacy and space.
- Looking at the property type distribution in Tortel, Hotel/Boutique properties are the most common (47.1%), reflecting the local real estate landscape.
- Houses represent a significant 29.4% portion, catering likely to families or larger groups.
- The presence of 47.1% Hotel/Boutique listings indicates integration with traditional hospitality.
Tortel Airbnb Room Capacity Analysis (2025): Bedroom Distribution
Distribution of Listings by Number of Bedrooms
Room Capacity Insights for Tortel
- The dominant room capacity in Tortel is 2 bedrooms listings, making up 17.6% of the market. This suggests a strong demand for properties suitable for couples or solo travelers.
- Together, 2 bedrooms and 5+ bedrooms properties represent 23.5% of the active Airbnb listings in Tortel, indicating a high concentration in these sizes.
Tortel Vacation Rental Guest Capacity Trends (2025)
Distribution of Listings by Guest Capacity
Guest Capacity Insights for Tortel
- The most common guest capacity trend in Tortel vacation rentals is listings accommodating 4 guests (17.6%). This suggests the primary traveler segment is likely small families or groups.
- Properties designed for 4 guests and 2 guests dominate the Tortel STR market, accounting for 29.4% of listings.
- On average, properties in Tortel are equipped to host 1.6 guests.
Tortel Airbnb Booking Patterns (2025): Available vs. Booked Days
Available Days Distribution
Booked Days Distribution
Booking Pattern Insights for Tortel
- The most common availability pattern in Tortel falls within the 271-366 days range, representing 76.5% of listings. This suggests many properties have significant open periods on their calendars.
- Approximately 100.0% of listings show high availability (181+ days open annually), indicating potential for increased bookings or specific owner usage patterns.
- For booked days, the 31-90 days range is most frequent in Tortel (52.9%), reflecting common guest stay durations or potential owner blocking patterns.
Tortel Airbnb Minimum Stay Requirements Analysis
Distribution of Listings by Minimum Night Requirement
1 Night
15 listings
88.2% of total
2 Nights
1 listings
5.9% of total
30+ Nights
1 listings
5.9% of total
Key Insights
- The most prevalent minimum stay requirement in Tortel is 1 Night, adopted by 88.2% of listings. This highlights the market's preference for shorter, flexible bookings.
- A strong majority (94.1%) of the Tortel Airbnb data shows acceptance of very short stays (1-2 nights), indicating a dynamic, high-turnover market.
Recommendations
- Align with the market by considering a 1 Night minimum stay, as 88.2% of Tortel hosts use this setting.
- Explore offering discounts for stays of 30+ nights to attract the 5.9% of the market seeking extended stays.
- Adjust minimum nights based on seasonality – potentially shorter during low season and longer during peak demand periods in Tortel.
Tortel Airbnb Cancellation Policy Trends Analysis (2025)
Limited
1 listings
5.9% of total
Flexible
13 listings
76.5% of total
Moderate
1 listings
5.9% of total
Firm
2 listings
11.8% of total
Cancellation Policy Insights for Tortel
- The prevailing Airbnb cancellation policy trend in Tortel is Flexible, used by 76.5% of listings.
- The market strongly favors guest-friendly terms, with 82.4% of listings offering Flexible or Moderate policies. This suggests guests in Tortel may expect booking flexibility.
Recommendations for Hosts
- Consider adopting a Flexible policy to align with the 76.5% market standard in Tortel.
- Given the high prevalence of Flexible policies (76.5%), offering this can enhance booking appeal, especially during shoulder seasons.
- Regularly review your cancellation policy against competitors and market demand shifts in Tortel.
Tortel STR Booking Lead Time Analysis (2025)
Average Booking Lead Time by Month
Booking Lead Time Insights for Tortel
- The overall average booking lead time for vacation rentals in Tortel is 28 days.
- Guests book furthest in advance for stays during December (average 59 days), likely coinciding with peak travel demand or local events.
- The shortest booking windows occur for stays in August (average 0 days), indicating more last-minute travel plans during this time.
- Seasonally, Winter (38 days avg.) sees the longest lead times, while Summer (15 days avg.) has the shortest, reflecting typical travel planning cycles.
Recommendations for Hosts
- Use the overall average lead time (28 days) as a baseline for your pricing and availability strategy in Tortel.
- For December stays, consider implementing length-of-stay discounts or slightly higher rates for bookings made less than 59 days out to capitalize on advance planning.
- During August, focus on last-minute booking availability and promotions, as guests book with very short notice (0 days avg.).
- Target marketing efforts for the Winter season well in advance (at least 38 days) to capture early planners.
- Monitor your own booking lead times against these Tortel averages to identify opportunities for dynamic pricing adjustments.
Popular & Essential Airbnb Amenities in Tortel (2025)
Amenity Prevalence
Amenity Insights for Tortel
- Popular amenities like Kitchen, Indoor fireplace, Dedicated workspace are common but not universal. Offering these can provide a competitive edge.
- Warning: Wifi is not universally provided but is considered essential globally. Ensure reliable Wifi is offered.
Recommendations for Hosts
- Consider adding popular differentiators like Kitchen or Indoor fireplace to increase appeal.
- Highlight unique or less common amenities you offer (e.g., hot tub, dedicated workspace, EV charger) in your listing description and photos.
- Regularly check competitor amenities in Tortel to stay competitive.
Tortel Airbnb Guest Demographics & Profile Analysis (2025)
Guest Profile Summary for Tortel
- The typical guest profile for Airbnb in Tortel consists of a mix of domestic (43%) and international guests, with top international origins including France, typically belonging to the Post-2000s (Gen Z/Alpha) group (50%), primarily speaking Spanish or English.
- Domestic travelers account for 43.2% of guests.
- Key international markets include Chile (43.2%) and France (11.7%).
- Top languages spoken are Spanish (36.7%) followed by English (33.6%).
- A significant demographic segment is the Post-2000s (Gen Z/Alpha) group, representing 50% of guests.
Recommendations for Hosts
- Balance marketing efforts between domestic and international channels based on the guest mix.
- Tailor amenities and listing descriptions to appeal to the dominant Post-2000s (Gen Z/Alpha) demographic (e.g., highlight fast WiFi, smart home features, local guides).
- Highlight unique local experiences or amenities relevant to the primary guest profile.
- Consider seasonal promotions aligned with peak travel times for key origin markets.
Nearby Short-Term Rental Market Comparison
How does the Tortel Airbnb market stack up against its neighbors? Compare key performance metrics like average monthly revenue, ADR, and occupancy rates in surrounding areas to understand the broader regional STR landscape.
| Market | Active Properties | Monthly Revenue | Daily Rate | Avg. Occupancy |
|---|---|---|---|---|
| Río Ibáñez | 122 | $656 | $109.47 | 33% |
| Chile Chico | 72 | $508 | $98.32 | 29% |
| Cochrane | 47 | $489 | $78.54 | 32% |