Saint John's Airbnb Market Analysis 2026: Short Term Rental Data & Vacation Rental Statistics in Newfoundland and Labrador, Canada
Is Airbnb profitable in Saint John's in 2026? Explore comprehensive Airbnb analytics for Saint John's, Newfoundland and Labrador, Canada to uncover income potential. This 2026 STR market report for Saint John's, based on AirROI data from February 2025 to January 2026, reveals key trends in the market of 553 active listings.
Whether you're considering an Airbnb investment in Saint John's, optimizing your existing vacation rental, or exploring rental arbitrage opportunities, understanding the Saint John's Airbnb data is crucial. Navigating the high regulation landscape is key to maximizing your short term rental income potential. Let's dive into the specifics.
Key Saint John's Airbnb Performance Metrics Overview
Monthly Airbnb Revenue Variations & Income Potential in Saint John's (2026)
Understanding the monthly revenue variations for Airbnb listings in Saint John's is key to maximizing your short term rental income potential. Seasonality significantly impacts earnings. Our analysis, based on data from the past 12 months, shows that the peak revenue month for STRs in Saint John's is typically August, while January often presents the lowest earnings, highlighting opportunities for strategic pricing adjustments during shoulder and low seasons. Explore the typical Airbnb income in Saint John's across different performance tiers:
- Best-in-class properties (Top 10%) achieve $4,662+ monthly, often utilizing dynamic pricing and superior guest experiences.
- Strong performing properties (Top 25%) earn $3,290 or more, indicating effective management and desirable locations/amenities.
- Typical properties (Median) generate around $2,137 per month, representing the average market performance.
- Entry-level properties (Bottom 25%) see earnings around $1,270, often with potential for optimization.
Average Monthly Airbnb Earnings Trend in Saint John's
Saint John's Airbnb Occupancy Rate Trends (2026)
Maximize your bookings by understanding the Saint John's STR occupancy trends. Seasonal demand shifts significantly influence how often properties are booked. Typically, Augustsees the highest demand (peak season occupancy), while January experiences the lowest (low season). Effective strategies, like adjusting minimum stays or offering promotions, can boost occupancy during slower periods. Here's how different property tiers perform in Saint John's:
- Best-in-class properties (Top 10%) achieve 84%+ occupancy, indicating high desirability and potentially optimized availability.
- Strong performing properties (Top 25%) maintain 71% or higher occupancy, suggesting good market fit and guest satisfaction.
- Typical properties (Median) have an occupancy rate around 53%.
- Entry-level properties (Bottom 25%) average 34% occupancy, potentially facing higher vacancy.
Average Monthly Occupancy Rate Trend in Saint John's
Average Daily Rate (ADR) Airbnb Trends in Saint John's (2026)
Effective short term rental pricing strategy in Saint John's involves understanding monthly ADR fluctuations. The Average Daily Rate (ADR) for Airbnb in Saint John's typically peaks in August and dips lowest during February. Leveraging Airbnb dynamic pricing tools or strategies based on this seasonality can significantly boost revenue. Here's a look at the typical nightly rates achieved:
- Best-in-class properties (Top 10%) command rates of $254+ per night, often due to premium features or locations.
- Strong performing properties (Top 25%) achieve nightly rates of $184 or more.
- Typical properties (Median) charge around $131 per night.
- Entry-level properties (Bottom 25%) earn around $93 per night.
Average Daily Rate (ADR) Trend by Month in Saint John's
Get Live Saint John's Market Intelligence 👇

Explore Real-time Analytics
Airbnb Seasonality Analysis & Trends in Saint John's (2026)
Peak Season (August, July, June)
- Revenue averages $4,263 per month
- Occupancy rates average 72.8%
- Daily rates average $172
Shoulder Season
- Revenue averages $2,254 per month
- Occupancy maintains around 48.8%
- Daily rates hold near $151
Low Season (January, February, March)
- Revenue drops to average $1,263 per month
- Occupancy decreases to average 37.7%
- Daily rates adjust to average $134
Seasonality Insights for Saint John's
- The Airbnb seasonality in Saint John's shows highly seasonal trends requiring careful strategy. While the sections above show seasonal averages, it's also insightful to look at the extremes:
- During the high season, the absolute peak month showcases Saint John's's highest earning potential, with monthly revenues capable of climbing to $4,986, occupancy reaching a high of 79.4%, and ADRs peaking at $182.
- Conversely, the slowest single month of the year, typically falling within the low season, marks the market's lowest point. In this month, revenue might dip to $1,207, occupancy could drop to 30.5%, and ADRs may adjust down to $127.
- Understanding both the seasonal averages and these monthly peaks and troughs in revenue, occupancy, and ADR is crucial for maximizing your Airbnb profit potential in Saint John's.
Seasonal Strategies for Maximizing Profit
- Peak Season: Maximize revenue through premium pricing and potentially longer minimum stays. Ensure high availability.
- Low Season: Offer competitive pricing, special promotions (e.g., extended stay discounts), and flexible cancellation policies. Target off-season travelers like remote workers or budget-conscious guests.
- Shoulder Seasons: Implement dynamic pricing that balances peak and low rates. Target weekend travelers or specific events. Offer slightly more flexible terms than peak season.
- Regularly analyze your own performance against these Saint John's seasonality benchmarks and adjust your pricing and availability strategy accordingly.
Best Areas for Airbnb Investment in Saint John's (2026)
Exploring the top neighborhoods for short-term rentals in Saint John's? This section highlights key areas, outlining why they are attractive for hosts and guests, along with notable local attractions. Consider these locations based on your target guest profile and investment strategy.
| Neighborhood / Area | Why Host Here? (Target Guests & Appeal) | Key Attractions & Landmarks |
|---|---|---|
| Downtown St. John's | The vibrant heart of the city, downtown St. John's is filled with shops, restaurants, and cultural attractions. It's a popular spot for tourists and offers easy access to the waterfront. | Signal Hill National Historic Site, The Rooms, George Street, Quidi Vidi Village, St. John's Code Division |
| Signal Hill | Offering stunning views of the city and the Atlantic Ocean, Signal Hill is a historic site and a great location for nature lovers. This area attracts visitors interested in hiking and exploring history. | Signal Hill, Cabot Tower, North Head Trail, Historic Walking Trails, Fort Amherst |
| The Battery | A picturesque neighborhood known for its colorful row houses and scenic coastline. It's popular with tourists for its charm and beauty, making it great for short-term rentals. | The Battery, Cape Spear, The Narrows, Signal Hill Views, European-style architecture |
| Quidi Vidi | This quaint fishing village within the city is known for its brewery and beautiful lake. It's a peaceful area that attracts tourists looking for a cozy stay close to nature. | Quidi Vidi Lake, Quidi Vidi Brewery, St. John's Signal Hill, Walking Trails, Arts & Crafts Shops |
| Mount Pearl | Just outside of St. John's, Mount Pearl is a growing suburb with community amenities and parks. It's appealing to families and longer-stay guests. | Parks and playgrounds, Avalon Mall, Mount Pearl Curling Club, Rugby and Soccer Fields, Community Events |
| Paradise | A suburban area that appeals to families and visitors looking for quieter accommodations while still being close to St. John's attractions. It's a popular choice for longer stays. | Baldwin's Hill, Paradise Park, Local Shops, Community Trails, Family-friendly Activities |
| Torbay | Located near the coast, Torbay offers stunning views and hiking opportunities. It's an ideal location for nature lovers and those seeking a tranquil getaway. | Torbay Beach, Parks and Trails, Hiking Trails, Community Events, Fishing Spots |
| Petty Harbour-Maddox Cove | This charming fishing village is known for its stunning coastal scenery and outdoor activities. It attracts visitors looking for a unique experience away from the city hustle. | Petty Harbour Marina, Hiking Trails, Local Seafood Restaurants, Scenic Views, Fishing and Boating Activities |
Understanding Airbnb License Requirements & STR Laws in Saint John's (2026)
Yes, Saint John's, Newfoundland and Labrador, Canada enforces high STR regulations. Obtaining a license and ensuring compliance is almost certainly required according to current 2026 STR laws. Always verify the latest short term rental regulations and Airbnb license requirements directly with local government authorities for Saint John's to ensure full compliance before hosting.
(Source: AirROI data, 2026, based on 47% licensed listings)
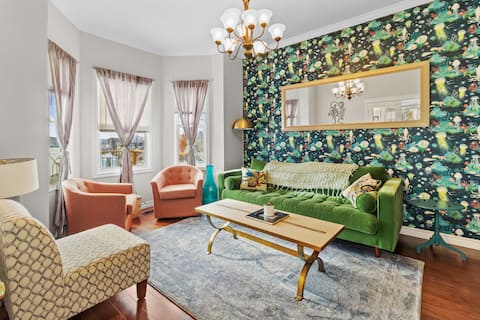
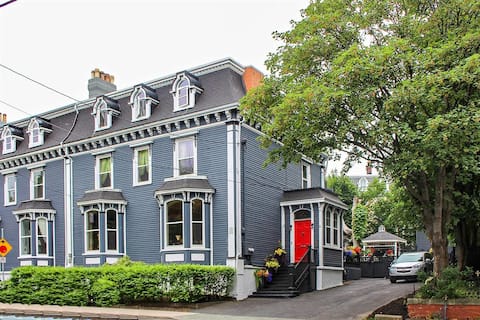
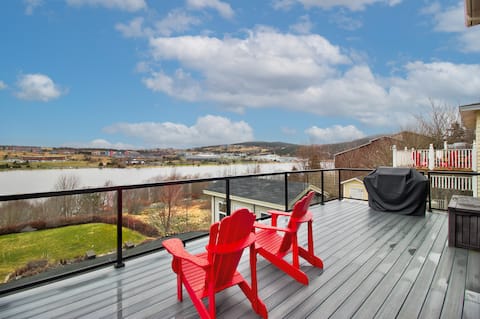
Top Performing Airbnb Properties in Saint John's (2026)
Benchmark your potential! Explore examples of top-performing Airbnb properties in Saint John'sbased on Trailing Twelve Month (TTM) revenue. Analyze their characteristics, revenue, occupancy rate, and ADR to understand what drives success in this market.

Family reunion-Sleep 20 in this 8 suite mini hotel
Entire Place • 8 bedrooms
The Battery Harbour Home, Ocean&City View,Parking
Entire Place • 4 bedrooms

Iconic Red Top of the Battery Ocean & City View
Entire Place • 2 bedrooms
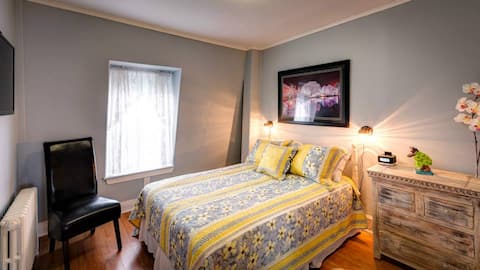
Cantwell House (Full House)
Private Room • 5 bedrooms
5Bd Heritage Dream Home in the heart of Downtown!
Entire Place • 5 bedrooms
QV Lake house 5Bd Gym Bar Theatre
Entire Place • 5 bedrooms
Note: Performance varies based on location, size, amenities, seasonality, and management quality. Data reflects the past 12 months.
Top Performing Airbnb Hosts in Saint John's (2026)
Learn from the best! This table showcases top-performing Airbnb hosts in Saint John's based on the number of properties managed and estimated total revenue over the past year. Analyze their scale and performance metrics.
| Host Name | Properties | Grossing Revenue | Stay Reviews | Avg Rating |
|---|---|---|---|---|
| David From We Host | 28 | $1,373,667 | 1598 | 4.85/5.0 |
| Newground Property | 44 | $1,319,135 | 2670 | 4.82/5.0 |
| Gordon | 9 | $264,980 | 435 | 4.86/5.0 |
| Just Rent Property Management | 15 | $225,866 | 1032 | 4.67/5.0 |
| Julia And Dion | 2 | $187,350 | 70 | 4.96/5.0 |
| Rochelle | 5 | $161,019 | 233 | 4.89/5.0 |
| Steve | 4 | $153,178 | 633 | 4.74/5.0 |
| Stacey | 3 | $138,540 | 260 | 4.97/5.0 |
| Eli | 3 | $128,728 | 195 | 4.93/5.0 |
| Roxy | 5 | $122,841 | 226 | 4.97/5.0 |
Analyzing the strategies of top hosts, such as their property selection, pricing, and guest communication, can offer valuable lessons for optimizing your own Airbnb operations in Saint John's.
Dive Deeper: Advanced Saint John's STR Market Data (2026)
Ready to unlock more insights? AirROI provides access to advanced metrics and comprehensive Airbnb data for Saint John's. Explore detailed analytics beyond this report to refine your investment strategy, optimize pricing, and maximize your vacation rental profits.
Explore Advanced MetricsSaint John's Short-Term Rental Market Composition (2026): Property & Room Types
Room Type Distribution
Property Type Distribution
Market Composition Insights for Saint John's
- The Saint John's Airbnb market composition is heavily skewed towards Entire Home/Apt listings, which make up 83.9% of the 553 active rentals. This indicates strong guest preference for privacy and space.
- Looking at the property type distribution in Saint John's, House properties are the most common (56.2%), reflecting the local real estate landscape.
- Houses represent a significant 56.2% portion, catering likely to families or larger groups.
- The presence of 5.4% Hotel/Boutique listings indicates integration with traditional hospitality.
- Smaller segments like others, outdoor/unique (combined 2.2%) offer potential for unique stay experiences.
Saint John's Airbnb Room Capacity Analysis (2026): Bedroom Distribution
Distribution of Listings by Number of Bedrooms
Room Capacity Insights for Saint John's
- The dominant room capacity in Saint John's is 1 bedroom listings, making up 28.8% of the market. This suggests a strong demand for properties suitable for couples or solo travelers.
- Together, 1 bedroom and 2 bedrooms properties represent 56.3% of the active Airbnb listings in Saint John's, indicating a high concentration in these sizes.
- A significant 31.5% of listings offer 3+ bedrooms, catering to larger groups and families seeking more space in Saint John's.
Saint John's Vacation Rental Guest Capacity Trends (2026)
Distribution of Listings by Guest Capacity
Guest Capacity Insights for Saint John's
- The most common guest capacity trend in Saint John's vacation rentals is listings accommodating 4 guests (26.9%). This suggests the primary traveler segment is likely small families or groups.
- Properties designed for 4 guests and 2 guests dominate the Saint John's STR market, accounting for 50.0% of listings.
- 29.2% of properties accommodate 6+ guests, serving the market segment for larger families or group travel in Saint John's.
- On average, properties in Saint John's are equipped to host 3.8 guests.
Saint John's Airbnb Booking Patterns (2026): Available vs. Booked Days
Available Days Distribution
Booked Days Distribution
Booking Pattern Insights for Saint John's
- The most common availability pattern in Saint John's falls within the 181-270 days range, representing 45% of listings. This suggests many properties have significant open periods on their calendars.
- Approximately 71.0% of listings show high availability (181+ days open annually), indicating potential for increased bookings or specific owner usage patterns.
- For booked days, the 91-180 days range is most frequent in Saint John's (45.6%), reflecting common guest stay durations or potential owner blocking patterns.
- A notable 30.2% of properties secure long booking periods (181+ days booked per year), highlighting successful long-term rental strategies or significant owner usage.
Saint John's Airbnb Minimum Stay Requirements Analysis
Distribution of Listings by Minimum Night Requirement
1 Night
96 listings
17.4% of total
2 Nights
191 listings
34.5% of total
3 Nights
37 listings
6.7% of total
4-6 Nights
31 listings
5.6% of total
7-29 Nights
9 listings
1.6% of total
30+ Nights
189 listings
34.2% of total
Key Insights
- The most prevalent minimum stay requirement in Saint John's is 2 Nights, adopted by 34.5% of listings. This highlights the market's preference for shorter, flexible bookings.
- A significant segment (34.2%) caters to monthly stays (30+ nights) in Saint John's, pointing to opportunities in the extended-stay market.
Recommendations
- Align with the market by considering a 2 Nights minimum stay, as 34.5% of Saint John's hosts use this setting.
- If feasible, allowing 1-night stays, especially midweek or during low season, could capture last-minute bookings, as only 17.4% currently do.
- A 2-night minimum appears standard (34.5%). Consider this for weekends or peak periods.
- Explore offering discounts for stays of 30+ nights to attract the 34.2% of the market seeking extended stays.
- Adjust minimum nights based on seasonality – potentially shorter during low season and longer during peak demand periods in Saint John's.
Saint John's Airbnb Cancellation Policy Trends Analysis (2026)
Limited
31 listings
5.6% of total
Super Strict 30 Days
1 listings
0.2% of total
Flexible
111 listings
20.1% of total
Moderate
141 listings
25.5% of total
Firm
232 listings
42% of total
Strict
36 listings
6.5% of total
Cancellation Policy Insights for Saint John's
- The prevailing Airbnb cancellation policy trend in Saint John's is Firm, used by 42% of listings.
- There's a relatively balanced mix between guest-friendly (45.6%) and stricter (48.5%) policies, offering choices for different guest needs.
- Strict cancellation policies are quite rare (6.5%), potentially making listings with this policy less competitive unless justified by high demand or property type.
Recommendations for Hosts
- Consider adopting a Firm policy to align with the 42% market standard in Saint John's.
- Using a Strict policy might deter some guests, as only 6.5% of listings use it. Evaluate if potential revenue protection outweighs possible lower booking rates.
- Regularly review your cancellation policy against competitors and market demand shifts in Saint John's.
Saint John's STR Booking Lead Time Analysis (2026)
Average Booking Lead Time by Month
Booking Lead Time Insights for Saint John's
- The overall average booking lead time for vacation rentals in Saint John's is 67 days.
- Guests book furthest in advance for stays during August (average 124 days), likely coinciding with peak travel demand or local events.
- The shortest booking windows occur for stays in February (average 20 days), indicating more last-minute travel plans during this time.
- Seasonally, Summer (100 days avg.) sees the longest lead times, while Winter (27 days avg.) has the shortest, reflecting typical travel planning cycles.
Recommendations for Hosts
- Use the overall average lead time (67 days) as a baseline for your pricing and availability strategy in Saint John's.
- For August stays, consider implementing length-of-stay discounts or slightly higher rates for bookings made less than 124 days out to capitalize on advance planning.
- Target marketing efforts for the Summer season well in advance (at least 100 days) to capture early planners.
- Monitor your own booking lead times against these Saint John's averages to identify opportunities for dynamic pricing adjustments.
Popular & Essential Airbnb Amenities in Saint John's (2026)
Amenity Prevalence
Amenity Insights for Saint John's
- Essential amenities in Saint John's that guests expect include: Wifi, Heating, Smoke alarm. Lacking these (any) could significantly impact bookings.
- Popular amenities like TV, Hot water, Dishes and silverware are common but not universal. Offering these can provide a competitive edge.
Recommendations for Hosts
- Ensure your listing includes all essential amenities for Saint John's: Wifi, Heating, Smoke alarm.
- Prioritize adding missing essentials: Wifi, Heating, Smoke alarm.
- Consider adding popular differentiators like TV or Hot water to increase appeal.
- Highlight unique or less common amenities you offer (e.g., hot tub, dedicated workspace, EV charger) in your listing description and photos.
- Regularly check competitor amenities in Saint John's to stay competitive.
Saint John's Airbnb Guest Demographics & Profile Analysis (2026)
Guest Profile Summary for Saint John's
- The typical guest profile for Airbnb in Saint John's consists of primarily domestic travelers (86%), often arriving from nearby Toronto, typically belonging to the Post-2000s (Gen Z/Alpha) group (50%), primarily speaking English or French.
- Domestic travelers account for 85.5% of guests.
- Key international markets include Canada (85.5%) and United States (8.8%).
- Top languages spoken are English (70.3%) followed by French (15.1%).
- A significant demographic segment is the Post-2000s (Gen Z/Alpha) group, representing 50% of guests.
Recommendations for Hosts
- Target domestic marketing efforts towards travelers from Toronto and Ottawa.
- Tailor amenities and listing descriptions to appeal to the dominant Post-2000s (Gen Z/Alpha) demographic (e.g., highlight fast WiFi, smart home features, local guides).
- Highlight unique local experiences or amenities relevant to the primary guest profile.
- Consider seasonal promotions aligned with peak travel times for key origin markets.
Nearby Short-Term Rental Market Comparison
How does the Saint John's Airbnb market stack up against its neighbors? Compare key performance metrics like average monthly revenue, ADR, and occupancy rates in surrounding areas to understand the broader regional STR landscape.
| Market | Active Properties | Monthly Revenue | Daily Rate | Avg. Occupancy |
|---|---|---|---|---|
| Pouch Cove | 11 | $2,725 | $172.22 | 53% |
| Tors Cove | 17 | $2,610 | $219.59 | 45% |
| Portugal Cove - St. Philips | 15 | $2,391 | $176.72 | 55% |
| Port Rexton | 31 | $2,182 | $185.44 | 51% |
| Dildo | 26 | $2,130 | $187.56 | 43% |
| Port de Grave | 11 | $1,971 | $165.11 | 43% |
| Conception Bay South | 38 | $1,967 | $147.22 | 54% |
| Trinity Bay North | 18 | $1,957 | $147.69 | 53% |
| Bonavista | 98 | $1,919 | $151.65 | 54% |
| Paradise | 20 | $1,875 | $102.81 | 61% |