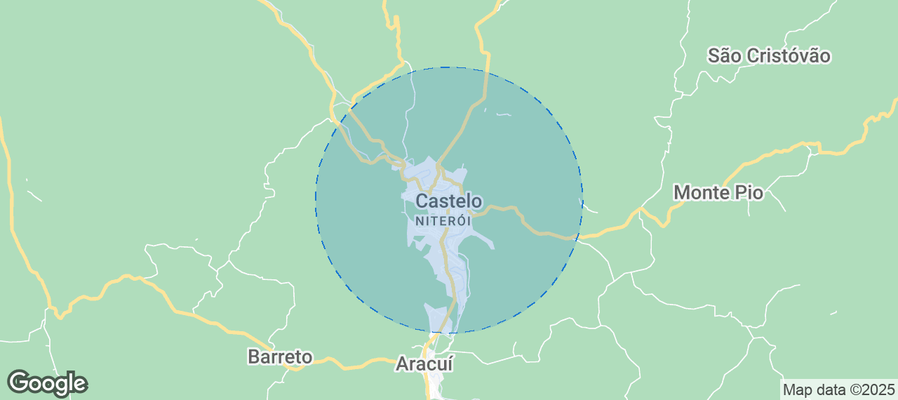
Castelo Airbnb Market Analysis 2025: Short Term Rental Data & Vacation Rental Statistics in Espírito Santo, Brazil
Is Airbnb profitable in Castelo in 2025? Explore comprehensive Airbnb analytics for Castelo, Espírito Santo, Brazil to uncover income potential. This 2025 STR market report for Castelo, based on AirROI data from June 2024 to May 2025, reveals key trends in the niche market of 18 active listings.
Whether you're considering an Airbnb investment in Castelo, optimizing your existing vacation rental, or exploring rental arbitrage opportunities, understanding the Castelo Airbnb data is crucial. Understanding the local regulations is key to maximizing your short term rental income potential. Let's dive into the specifics.
Key Castelo Airbnb Performance Metrics Overview
Monthly Airbnb Revenue Variations & Income Potential in Castelo (2025)
Understanding the monthly revenue variations for Airbnb listings in Castelo is key to maximizing your short term rental income potential. Seasonality significantly impacts earnings. Our analysis, based on data from the past 12 months, shows that the peak revenue month for STRs in Castelo is typically December, while June often presents the lowest earnings, highlighting opportunities for strategic pricing adjustments during shoulder and low seasons. Explore the typical Airbnb income in Castelo across different performance tiers:
- Best-in-class properties (Top 10%) achieve $1,820+ monthly, often utilizing dynamic pricing and superior guest experiences.
- Strong performing properties (Top 25%) earn $871 or more, indicating effective management and desirable locations/amenities.
- Typical properties (Median) generate around $432 per month, representing the average market performance.
- Entry-level properties (Bottom 25%) see earnings around $189, often with potential for optimization.
Average Monthly Airbnb Earnings Trend in Castelo
Castelo Airbnb Occupancy Rate Trends (2025)
Maximize your bookings by understanding the Castelo STR occupancy trends. Seasonal demand shifts significantly influence how often properties are booked. Typically, Octobersees the highest demand (peak season occupancy), while May experiences the lowest (low season). Effective strategies, like adjusting minimum stays or offering promotions, can boost occupancy during slower periods. Here's how different property tiers perform in Castelo:
- Best-in-class properties (Top 10%) achieve 43%+ occupancy, indicating high desirability and potentially optimized availability.
- Strong performing properties (Top 25%) maintain 32% or higher occupancy, suggesting good market fit and guest satisfaction.
- Typical properties (Median) have an occupancy rate around 21%.
- Entry-level properties (Bottom 25%) average 13% occupancy, potentially facing higher vacancy.
Average Monthly Occupancy Rate Trend in Castelo
Average Daily Rate (ADR) Airbnb Trends in Castelo (2025)
Effective short term rental pricing strategy in Castelo involves understanding monthly ADR fluctuations. The Average Daily Rate (ADR) for Airbnb in Castelo typically peaks in May and dips lowest during September. Leveraging Airbnb dynamic pricing tools or strategies based on this seasonality can significantly boost revenue. Here's a look at the typical nightly rates achieved:
- Best-in-class properties (Top 10%) command rates of $193+ per night, often due to premium features or locations.
- Strong performing properties (Top 25%) achieve nightly rates of $108 or more.
- Typical properties (Median) charge around $67 per night.
- Entry-level properties (Bottom 25%) earn around $38 per night.
Average Daily Rate (ADR) Trend by Month in Castelo
Get Live Castelo Market Intelligence 👇
Explore Real-time Analytics
Airbnb Seasonality Analysis & Trends in Castelo (2025)
Peak Season (December, March, July)
- Revenue averages $1,388 per month
- Occupancy rates average 25.3%
- Daily rates average $123
Shoulder Season
- Revenue averages $773 per month
- Occupancy maintains around 26.1%
- Daily rates hold near $122
Low Season (February, May, June)
- Revenue drops to average $358 per month
- Occupancy decreases to average 17.0%
- Daily rates adjust to average $129
Seasonality Insights for Castelo
- The Airbnb seasonality in Castelo shows highly seasonal trends requiring careful strategy. While the sections above show seasonal averages, it's also insightful to look at the extremes:
- During the high season, the absolute peak month showcases Castelo's highest earning potential, with monthly revenues capable of climbing to $1,613, occupancy reaching a high of 30.2%, and ADRs peaking at $144.
- Conversely, the slowest single month of the year, typically falling within the low season, marks the market's lowest point. In this month, revenue might dip to $231, occupancy could drop to 12.7%, and ADRs may adjust down to $113.
- Understanding both the seasonal averages and these monthly peaks and troughs in revenue, occupancy, and ADR is crucial for maximizing your Airbnb profit potential in Castelo.
Seasonal Strategies for Maximizing Profit
- Peak Season: Maximize revenue through premium pricing and potentially longer minimum stays. Ensure high availability.
- Low Season: Offer competitive pricing, special promotions (e.g., extended stay discounts), and flexible cancellation policies. Target off-season travelers like remote workers or budget-conscious guests.
- Shoulder Seasons: Implement dynamic pricing that balances peak and low rates. Target weekend travelers or specific events. Offer slightly more flexible terms than peak season.
- Regularly analyze your own performance against these Castelo seasonality benchmarks and adjust your pricing and availability strategy accordingly.
Best Areas for Airbnb Investment in Castelo (2025)
Exploring the top neighborhoods for short-term rentals in Castelo? This section highlights key areas, outlining why they are attractive for hosts and guests, along with notable local attractions. Consider these locations based on your target guest profile and investment strategy.
| Neighborhood / Area | Why Host Here? (Target Guests & Appeal) | Key Attractions & Landmarks |
|---|---|---|
| Praia da Costa | Vibrant beach area known for its beautiful coastline and numerous restaurants. Popular with both tourists and locals, making it an ideal location for short-term rentals. | Praia da Costa Beach, Shopping Vila Velha, Convento da Penha, Avenida Luciano S. Nunes, Green Beach, Praia do Canto |
| Itapuã | A charming neighborhood close to the beach, known for its relaxed atmosphere and beautiful natural landscape. Attracts families and tourists looking for a peaceful getaway. | Praia de Itapuã, Parque Natural Municipal de Dulce Ribeiro, Mangue Seco, Itapuã's Fisherman's Square, Beach kiosks and restaurants |
| Jardim da Penha | A residential area that is close to the beach and has a community feel. It is a good option for travelers who want convenience and access to local amenities. | Praia do Canto, Shopping Center Norte, Nearby parks, Café do Mercado, Local restaurants and bars |
| Centro de Vila Velha | The city center offers cultural attractions and is close to historical sites. It attracts visitors interested in local culture and history. | Historic city buildings, Museu Vale, Praça Duque de Caxias, Caminho de Areia, Theater of Vila Velha |
| Bairro da Glória | Known for its cultural touch and local vibe, ideal for those who want to experience the authentic life in Espírito Santo. Offers a variety of local dining and attractions. | Lighthouse of Glória, Local art galleries, Snack bars, Cultural events, Nearby parks |
| Praia do Canto | Highly sought after for its beaches and lively atmosphere, it's popular among young travelers and beach-goers. | Praia do Canto Beach, Local nightlife, Nearby markets, Cultural events, Art galleries |
| Guarapari | Famous for its stunning beaches, a short drive from Castelo, attracting beach lovers and those looking for a lively atmosphere during the summer months. | Praia do Morro, Bacutia Beach, ando em Guarapari, Ponta da Fruta Beach, Local dining options |
| Santo Antônio | A more tranquil area close to the mountains and nature, suitable for those looking for a peaceful retreat away from the hustle and bustle of the city. | Natural reserves, Hiking trails, Scenic viewpoints, Traditional markets, Local farms |
Understanding Airbnb License Requirements & STR Laws in Castelo (2025)
With 11% of listings showing registration in 2025, understanding potential Airbnb license requirements is crucial in Castelo. Always verify the latest short term rental regulations and Airbnb license requirements directly with local government authorities for Castelo to ensure full compliance before hosting.
(Source: AirROI data, 2025, based on 11% licensed listings)
Top Performing Airbnb Properties in Castelo (2025)
Benchmark your potential! Explore examples of top-performing Airbnb properties in Castelobased on Trailing Twelve Month (TTM) revenue. Analyze their characteristics, revenue, occupancy rate, and ADR to understand what drives success in this market.
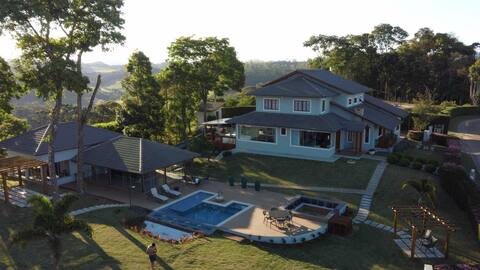
Casa Azul Mansion! Exclusive in the region
Entire Place • 6 bedrooms
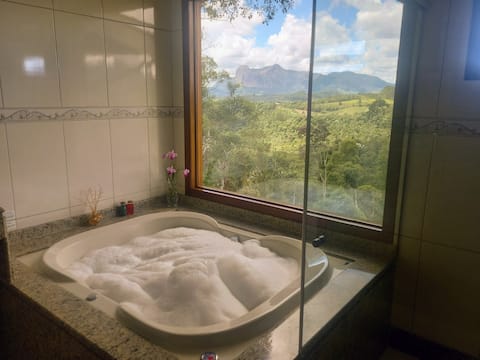
Paz and heated hydro with incredible views of Pedra Azul
Entire Place • 5 bedrooms
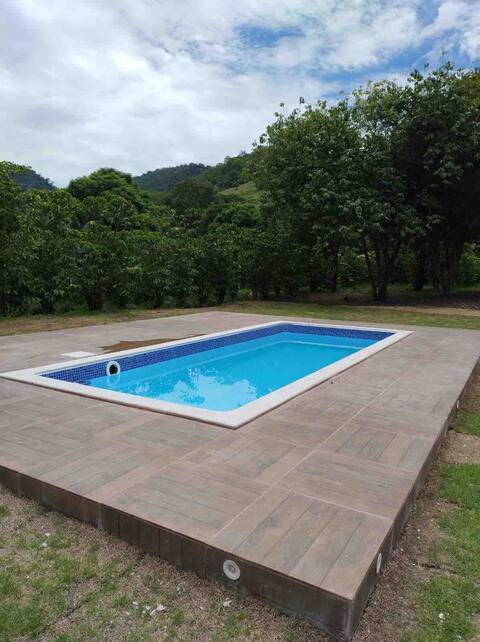
Chalé da Tuia + Casa da Vovó
Entire Place • 6 bedrooms

Chácara Recanto dos Guizzardi
Entire Place • 3 bedrooms

Chácara da Tuia
Entire Place • 2 bedrooms

Country house, privacy and coziness in Castelo
Entire Place • 2 bedrooms
Note: Performance varies based on location, size, amenities, seasonality, and management quality. Data reflects the past 12 months.
Top Performing Airbnb Hosts in Castelo (2025)
Learn from the best! This table showcases top-performing Airbnb hosts in Castelo based on the number of properties managed and estimated total revenue over the past year. Analyze their scale and performance metrics.
| Host Name | Properties | Grossing Revenue | Stay Reviews | Avg Rating |
|---|---|---|---|---|
| Lucilaine | 1 | $44,994 | 4 | 5.00/5.0 |
| Diogo | 3 | $27,301 | 6 | 5.00/5.0 |
| Jarbas | 1 | $16,893 | 6 | 5.00/5.0 |
| Cássia | 1 | $9,872 | 4 | 5.00/5.0 |
| Narjara | 1 | $7,782 | 28 | 4.93/5.0 |
| Marcia | 1 | $3,626 | 42 | 4.90/5.0 |
| Gerusa | 1 | $3,596 | 0 | N/A/5.0 |
| Karolyne | 1 | $3,579 | 4 | 5.00/5.0 |
| Kênia | 1 | $2,257 | 3 | 5.00/5.0 |
| Host #504027682 | 1 | $1,390 | 0 | N/A/5.0 |
Analyzing the strategies of top hosts, such as their property selection, pricing, and guest communication, can offer valuable lessons for optimizing your own Airbnb operations in Castelo.
Dive Deeper: Advanced Castelo STR Market Data (2025)
Ready to unlock more insights? AirROI provides access to advanced metrics and comprehensive Airbnb data for Castelo. Explore detailed analytics beyond this report to refine your investment strategy, optimize pricing, and maximize your vacation rental profits.
Explore Advanced MetricsCastelo Short-Term Rental Market Composition (2025): Property & Room Types
Room Type Distribution
Property Type Distribution
Market Composition Insights for Castelo
- The Castelo Airbnb market composition is heavily skewed towards Entire Home/Apt listings, which make up 88.9% of the 18 active rentals. This indicates strong guest preference for privacy and space.
- Looking at the property type distribution in Castelo, House properties are the most common (77.8%), reflecting the local real estate landscape.
- Houses represent a significant 77.8% portion, catering likely to families or larger groups.
- The presence of 11.1% Hotel/Boutique listings indicates integration with traditional hospitality.
Castelo Airbnb Room Capacity Analysis (2025): Bedroom Distribution
Distribution of Listings by Number of Bedrooms
Room Capacity Insights for Castelo
- The dominant room capacity in Castelo is 5+ bedrooms listings, making up 27.8% of the market. This suggests a strong demand for properties suitable for families or small groups.
- Together, 5+ bedrooms and 3 bedrooms properties represent 50.0% of the active Airbnb listings in Castelo, indicating a high concentration in these sizes.
- A significant 55.6% of listings offer 3+ bedrooms, catering to larger groups and families seeking more space in Castelo.
Castelo Vacation Rental Guest Capacity Trends (2025)
Distribution of Listings by Guest Capacity
Guest Capacity Insights for Castelo
- The most common guest capacity trend in Castelo vacation rentals is listings accommodating 8+ guests (50%). This suggests the primary traveler segment is likely larger groups.
- Properties designed for 8+ guests and 4 guests dominate the Castelo STR market, accounting for 72.2% of listings.
- 72.2% of properties accommodate 6+ guests, serving the market segment for larger families or group travel in Castelo.
- On average, properties in Castelo are equipped to host 6.5 guests.
Castelo Airbnb Booking Patterns (2025): Available vs. Booked Days
Available Days Distribution
Booked Days Distribution
Booking Pattern Insights for Castelo
- The most common availability pattern in Castelo falls within the 271-366 days range, representing 72.2% of listings. This suggests many properties have significant open periods on their calendars.
- Approximately 100.0% of listings show high availability (181+ days open annually), indicating potential for increased bookings or specific owner usage patterns.
- For booked days, the 1-30 days range is most frequent in Castelo (38.9%), reflecting common guest stay durations or potential owner blocking patterns.
Castelo Airbnb Minimum Stay Requirements Analysis
Distribution of Listings by Minimum Night Requirement
1 Night
6 listings
33.3% of total
2 Nights
7 listings
38.9% of total
3 Nights
1 listings
5.6% of total
30+ Nights
4 listings
22.2% of total
Key Insights
- The most prevalent minimum stay requirement in Castelo is 2 Nights, adopted by 38.9% of listings. This highlights the market's preference for shorter, flexible bookings.
- A strong majority (72.2%) of the Castelo Airbnb data shows acceptance of very short stays (1-2 nights), indicating a dynamic, high-turnover market.
- A significant segment (22.2%) caters to monthly stays (30+ nights) in Castelo, pointing to opportunities in the extended-stay market.
Recommendations
- Align with the market by considering a 2 Nights minimum stay, as 38.9% of Castelo hosts use this setting.
- Explore offering discounts for stays of 30+ nights to attract the 22.2% of the market seeking extended stays.
- Adjust minimum nights based on seasonality – potentially shorter during low season and longer during peak demand periods in Castelo.
Castelo Airbnb Cancellation Policy Trends Analysis (2025)
Flexible
7 listings
43.8% of total
Moderate
2 listings
12.5% of total
Firm
5 listings
31.3% of total
Strict
2 listings
12.5% of total
Cancellation Policy Insights for Castelo
- The prevailing Airbnb cancellation policy trend in Castelo is Flexible, used by 43.8% of listings.
- There's a relatively balanced mix between guest-friendly (56.3%) and stricter (43.8%) policies, offering choices for different guest needs.
Recommendations for Hosts
- Consider adopting a Flexible policy to align with the 43.8% market standard in Castelo.
- Using a Strict policy might deter some guests, as only 12.5% of listings use it. Evaluate if potential revenue protection outweighs possible lower booking rates.
- Regularly review your cancellation policy against competitors and market demand shifts in Castelo.
Castelo STR Booking Lead Time Analysis (2025)
Average Booking Lead Time by Month
Booking Lead Time Insights for Castelo
- The overall average booking lead time for vacation rentals in Castelo is 23 days.
- Guests book furthest in advance for stays during March (average 61 days), likely coinciding with peak travel demand or local events.
- The shortest booking windows occur for stays in July (average 9 days), indicating more last-minute travel plans during this time.
- Seasonally, Spring (38 days avg.) sees the longest lead times, while Summer (17 days avg.) has the shortest, reflecting typical travel planning cycles.
Recommendations for Hosts
- Use the overall average lead time (23 days) as a baseline for your pricing and availability strategy in Castelo.
- For March stays, consider implementing length-of-stay discounts or slightly higher rates for bookings made less than 61 days out to capitalize on advance planning.
- During July, focus on last-minute booking availability and promotions, as guests book with very short notice (9 days avg.).
- Target marketing efforts for the Spring season well in advance (at least 38 days) to capture early planners.
- Monitor your own booking lead times against these Castelo averages to identify opportunities for dynamic pricing adjustments.
Popular & Essential Airbnb Amenities in Castelo (2025)
Amenity Prevalence
Amenity Insights for Castelo
- Essential amenities in Castelo that guests expect include: Kitchen. Lacking these (this) could significantly impact bookings.
- Popular amenities like Wifi, Free parking on premises, TV are common but not universal. Offering these can provide a competitive edge.
- Warning: Wifi is not universally provided but is considered essential globally. Ensure reliable Wifi is offered.
Recommendations for Hosts
- Ensure your listing includes all essential amenities for Castelo: Kitchen.
- Consider adding popular differentiators like Wifi or Free parking on premises to increase appeal.
- Highlight unique or less common amenities you offer (e.g., hot tub, dedicated workspace, EV charger) in your listing description and photos.
- Regularly check competitor amenities in Castelo to stay competitive.
Castelo Airbnb Guest Demographics & Profile Analysis (2025)
Guest Profile Summary for Castelo
- The typical guest profile for Airbnb in Castelo consists of primarily domestic travelers (90%), often arriving from nearby Vila Velha, typically belonging to the Post-2000s (Gen Z/Alpha) group (50%), primarily speaking Portuguese or French.
- Domestic travelers account for 90.0% of guests.
- Key international markets include Brazil (90%) and Canada (3.3%).
- Top languages spoken are Portuguese (73.3%) followed by French (13.3%).
- A significant demographic segment is the Post-2000s (Gen Z/Alpha) group, representing 50% of guests.
Recommendations for Hosts
- Target domestic marketing efforts towards travelers from Vila Velha and Vitoria.
- Tailor amenities and listing descriptions to appeal to the dominant Post-2000s (Gen Z/Alpha) demographic (e.g., highlight fast WiFi, smart home features, local guides).
- Highlight unique local experiences or amenities relevant to the primary guest profile.
- Consider seasonal promotions aligned with peak travel times for key origin markets.
Nearby Short-Term Rental Market Comparison
How does the Castelo Airbnb market stack up against its neighbors? Compare key performance metrics like average monthly revenue, ADR, and occupancy rates in surrounding areas to understand the broader regional STR landscape.
| Market | Active Properties | Monthly Revenue | Daily Rate | Avg. Occupancy |
|---|---|---|---|---|
| Domingos Martins | 634 | $654 | $110.23 | 27% |
| Venda Nova do Imigrante | 82 | $652 | $121.39 | 24% |
| Anchieta | 366 | $641 | $122.00 | 27% |
| Santa Teresa | 294 | $621 | $113.86 | 25% |
| Marechal Floriano | 141 | $613 | $103.42 | 26% |
| Espera Feliz | 32 | $561 | $97.24 | 24% |
| Vargem Alta | 25 | $514 | $101.81 | 24% |
| Vila Velha | 1,567 | $510 | $60.14 | 41% |
| Além Paraíba | 11 | $497 | $195.11 | 17% |
| Alfredo Chaves | 67 | $493 | $99.54 | 21% |