Hamilton Airbnb Market Analysis 2026: Short Term Rental Data & Vacation Rental Statistics in Hamilton Parish, Bermuda
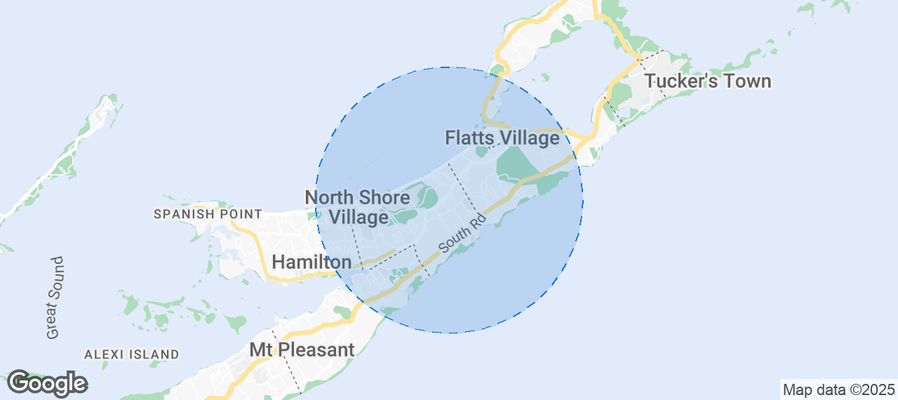
Is Airbnb profitable in Hamilton in 2026? Explore comprehensive Airbnb analytics for Hamilton, Hamilton Parish, Bermuda to uncover income potential. This 2026 STR market report for Hamilton, based on AirROI data from February 2025 to January 2026, reveals key trends in the niche market of 23 active listings.
Whether you're considering an Airbnb investment in Hamilton, optimizing your existing vacation rental, or exploring rental arbitrage opportunities, understanding the Hamilton Airbnb data is crucial. Leveraging the low regulation environment is key to maximizing your short term rental income potential. Let's dive into the specifics.
Key Hamilton Airbnb Performance Metrics Overview
Monthly Airbnb Revenue Variations & Income Potential in Hamilton (2026)
Understanding the monthly revenue variations for Airbnb listings in Hamilton is key to maximizing your short term rental income potential. Seasonality significantly impacts earnings. Our analysis, based on data from the past 12 months, shows that the peak revenue month for STRs in Hamilton is typically July, while February often presents the lowest earnings, highlighting opportunities for strategic pricing adjustments during shoulder and low seasons. Explore the typical Airbnb income in Hamilton across different performance tiers:
- Best-in-class properties (Top 10%) achieve $17,458+ monthly, often utilizing dynamic pricing and superior guest experiences.
- Strong performing properties (Top 25%) earn $7,319 or more, indicating effective management and desirable locations/amenities.
- Typical properties (Median) generate around $4,001 per month, representing the average market performance.
- Entry-level properties (Bottom 25%) see earnings around $2,532, often with potential for optimization.
Average Monthly Airbnb Earnings Trend in Hamilton
Hamilton Airbnb Occupancy Rate Trends (2026)
Maximize your bookings by understanding the Hamilton STR occupancy trends. Seasonal demand shifts significantly influence how often properties are booked. Typically, Julysees the highest demand (peak season occupancy), while January experiences the lowest (low season). Effective strategies, like adjusting minimum stays or offering promotions, can boost occupancy during slower periods. Here's how different property tiers perform in Hamilton:
- Best-in-class properties (Top 10%) achieve 84%+ occupancy, indicating high desirability and potentially optimized availability.
- Strong performing properties (Top 25%) maintain 68% or higher occupancy, suggesting good market fit and guest satisfaction.
- Typical properties (Median) have an occupancy rate around 47%.
- Entry-level properties (Bottom 25%) average 32% occupancy, potentially facing higher vacancy.
Average Monthly Occupancy Rate Trend in Hamilton
Average Daily Rate (ADR) Airbnb Trends in Hamilton (2026)
Effective short term rental pricing strategy in Hamilton involves understanding monthly ADR fluctuations. The Average Daily Rate (ADR) for Airbnb in Hamilton typically peaks in August and dips lowest during January. Leveraging Airbnb dynamic pricing tools or strategies based on this seasonality can significantly boost revenue. Here's a look at the typical nightly rates achieved:
- Best-in-class properties (Top 10%) command rates of $3,448+ per night, often due to premium features or locations.
- Strong performing properties (Top 25%) achieve nightly rates of $753 or more.
- Typical properties (Median) charge around $264 per night.
- Entry-level properties (Bottom 25%) earn around $176 per night.
Average Daily Rate (ADR) Trend by Month in Hamilton
Get Live Hamilton Market Intelligence 👇
Explore Real-time Analytics
Airbnb Seasonality Analysis & Trends in Hamilton (2026)
Peak Season (July, April, June)
- Revenue averages $12,068 per month
- Occupancy rates average 65.3%
- Daily rates average $859
Shoulder Season
- Revenue averages $7,638 per month
- Occupancy maintains around 49.1%
- Daily rates hold near $826
Low Season (January, February, November)
- Revenue drops to average $3,828 per month
- Occupancy decreases to average 35.3%
- Daily rates adjust to average $753
Seasonality Insights for Hamilton
- The Airbnb seasonality in Hamilton shows highly seasonal trends requiring careful strategy. While the sections above show seasonal averages, it's also insightful to look at the extremes:
- During the high season, the absolute peak month showcases Hamilton's highest earning potential, with monthly revenues capable of climbing to $12,584, occupancy reaching a high of 66.7%, and ADRs peaking at $888.
- Conversely, the slowest single month of the year, typically falling within the low season, marks the market's lowest point. In this month, revenue might dip to $3,073, occupancy could drop to 24.7%, and ADRs may adjust down to $727.
- Understanding both the seasonal averages and these monthly peaks and troughs in revenue, occupancy, and ADR is crucial for maximizing your Airbnb profit potential in Hamilton.
Seasonal Strategies for Maximizing Profit
- Peak Season: Maximize revenue through premium pricing and potentially longer minimum stays. Ensure high availability.
- Low Season: Offer competitive pricing, special promotions (e.g., extended stay discounts), and flexible cancellation policies. Target off-season travelers like remote workers or budget-conscious guests.
- Shoulder Seasons: Implement dynamic pricing that balances peak and low rates. Target weekend travelers or specific events. Offer slightly more flexible terms than peak season.
- Regularly analyze your own performance against these Hamilton seasonality benchmarks and adjust your pricing and availability strategy accordingly.
Best Areas for Airbnb Investment in Hamilton (2026)
Exploring the top neighborhoods for short-term rentals in Hamilton? This section highlights key areas, outlining why they are attractive for hosts and guests, along with notable local attractions. Consider these locations based on your target guest profile and investment strategy.
| Neighborhood / Area | Why Host Here? (Target Guests & Appeal) | Key Attractions & Landmarks |
|---|---|---|
| Horseshoe Bay | Famous for its stunning pink sand beach and scenic views, Horseshoe Bay attracts tourists seeking relaxation and beach activities. Ideal for Airbnb hosts looking to cater to travelers who enjoy sun and sea. | Horseshoe Bay Beach, Church Bay, Warwick Long Bay, The Gibb's Hill Lighthouse, South Shore Park |
| St. George's | A UNESCO World Heritage site known for its preserved colonial history and charming architecture. Hosts can attract guests interested in history and culture with various historical sites and events. | St. George's Historic Town, Fort St. Catherine, National Museum of Bermuda, Tobacco Bay, The Old State House |
| Hamilton City | The vibrant capital city offers a mix of business, shopping, and dining experiences. Great for travelers looking to experience Bermudian city life and easy access to ferries and tours. | Bermuda Botanical Gardens, Bermuda National Gallery, Front Street shopping, Par-la-Ville Park, Royal Naval Dockyard |
| Elbow Beach | A beautiful beach destination popular with tourists looking for stunning coastal views and luxury accommodations. Perfect for those who want a more exclusive beach experience. | Elbow Beach, Elbow Beach Hotel, Crystal Cave, Grotto Bay Beach, Spittal Pond Nature Reserve |
| Sandy's Parish | Known for its beautiful beaches and relaxed atmosphere, Sandy's Parish is perfect for vacationers looking for a laid-back experience away from the more tourist-heavy areas. | Snorkel Park Beach, Mangrove Bay, West End Sailboat Rentals, Somers Isles, Historic Scaur Hill Fort |
| Warwick Parish | Offers a balance of beaches, parks, and local charm, appealing to families and groups seeking a combination of relaxation and activities. | Warwick Long Bay, Coco Reef Resort, Horseshoe Bay, South Shore Park, Elbow Beach |
| Tobacco Bay | A stunning cove known for its clear waters and great snorkeling. Ideal for beach lovers and water sports enthusiasts looking for an adventurous stay. | Tobacco Bay Beach, Snorkeling Spots, Historic St. George's, Water Sports Rentals, Beach Bars |
| Long Bay | A tranquil beach spot perfect for those seeking a quiet getaway. Attracts couples and solo travelers looking for peace and natural beauty. | Long Bay Beach, Nature Trails, South Shore Park, Cove Bay Beach, Beautiful Sand Dunes |
Understanding Airbnb License Requirements & STR Laws in Hamilton (2026)
While Hamilton, Hamilton Parish, Bermuda currently shows low STR regulations, specific Airbnb license requirements might still exist or change. Always verify the latest short term rental regulations and Airbnb license requirements directly with local government authorities for Hamilton to ensure full compliance before hosting.
(Source: AirROI data, 2026, finding no licensed listings among those analyzed)
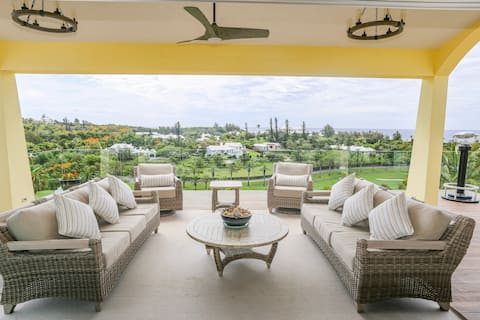
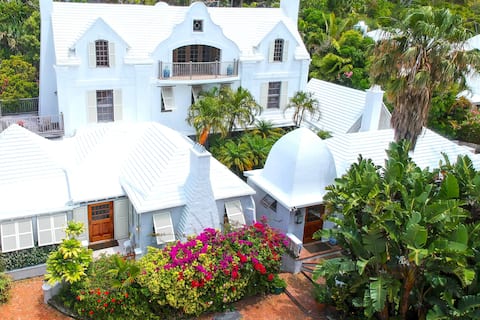
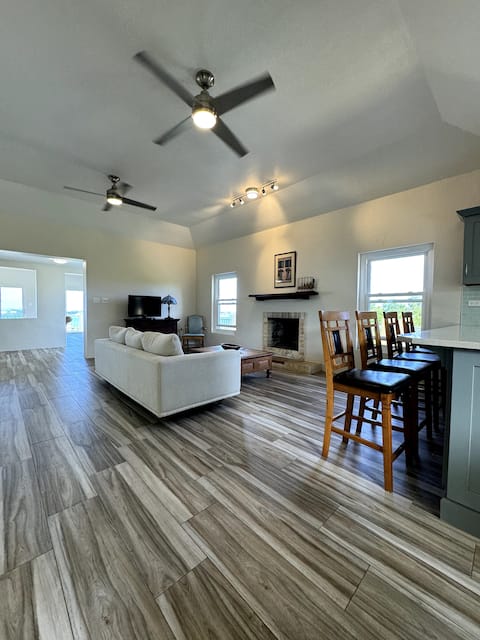
Top Performing Airbnb Properties in Hamilton (2026)
Benchmark your potential! Explore examples of top-performing Airbnb properties in Hamiltonbased on Trailing Twelve Month (TTM) revenue. Analyze their characteristics, revenue, occupancy rate, and ADR to understand what drives success in this market.
Large home, incredible views in Tuckerstown
Entire Place • 4 bedrooms
Unique retreat w/panoramic pool and swimming caves
Entire Place • 5 bedrooms
High & Dry Bermuda
Entire Place • 2 bedrooms

Sound Winds: Harrington Sound Ocean Front Estate
Entire Place • 5 bedrooms
Top Shell: Oceanfront luxury with stunning views
Entire Place • 2 bedrooms

Spectacular one bedroom. A must see.
Entire Place • 1 bedroom
Note: Performance varies based on location, size, amenities, seasonality, and management quality. Data reflects the past 12 months.
Top Performing Airbnb Hosts in Hamilton (2026)
Learn from the best! This table showcases top-performing Airbnb hosts in Hamilton based on the number of properties managed and estimated total revenue over the past year. Analyze their scale and performance metrics.
| Host Name | Properties | Grossing Revenue | Stay Reviews | Avg Rating |
|---|---|---|---|---|
| Brian | 1 | $390,724 | 6 | 5.00/5.0 |
| Phoebe | 2 | $314,494 | 5 | 5.00/5.0 |
| Johnette | 4 | $122,098 | 115 | 4.98/5.0 |
| Daley | 1 | $107,820 | 23 | 4.91/5.0 |
| Hendryks | 1 | $73,616 | 33 | 4.97/5.0 |
| Andrea | 1 | $73,586 | 10 | 4.90/5.0 |
| Margaret | 1 | $66,401 | 38 | 5.00/5.0 |
| Taylor | 1 | $57,273 | 50 | 4.84/5.0 |
| Shomari | 1 | $51,150 | 32 | 4.91/5.0 |
| Exclusive Island Rentals | 1 | $49,058 | 2 | Not Rated |
Analyzing the strategies of top hosts, such as their property selection, pricing, and guest communication, can offer valuable lessons for optimizing your own Airbnb operations in Hamilton.
Dive Deeper: Advanced Hamilton STR Market Data (2026)
Ready to unlock more insights? AirROI provides access to advanced metrics and comprehensive Airbnb data for Hamilton. Explore detailed analytics beyond this report to refine your investment strategy, optimize pricing, and maximize your vacation rental profits.
Explore Advanced MetricsHamilton Short-Term Rental Market Composition (2026): Property & Room Types
Room Type Distribution
Property Type Distribution
Market Composition Insights for Hamilton
- The Hamilton Airbnb market composition is heavily skewed towards Entire Home/Apt listings, which make up 95.7% of the 23 active rentals. This indicates strong guest preference for privacy and space.
- Looking at the property type distribution in Hamilton, Apartment/Condo properties are the most common (47.8%), reflecting the local real estate landscape.
- Houses represent a significant 39.1% portion, catering likely to families or larger groups.
- The presence of 8.7% Hotel/Boutique listings indicates integration with traditional hospitality.
- Smaller segments like others (combined 4.3%) offer potential for unique stay experiences.
Hamilton Airbnb Room Capacity Analysis (2026): Bedroom Distribution
Distribution of Listings by Number of Bedrooms
Room Capacity Insights for Hamilton
- The dominant room capacity in Hamilton is 1 bedroom listings, making up 39.1% of the market. This suggests a strong demand for properties suitable for couples or solo travelers.
- Together, 1 bedroom and 2 bedrooms properties represent 60.8% of the active Airbnb listings in Hamilton, indicating a high concentration in these sizes.
- A significant 21.7% of listings offer 3+ bedrooms, catering to larger groups and families seeking more space in Hamilton.
Hamilton Vacation Rental Guest Capacity Trends (2026)
Distribution of Listings by Guest Capacity
Guest Capacity Insights for Hamilton
- The most common guest capacity trend in Hamilton vacation rentals is listings accommodating 2 guests (43.5%). This suggests the primary traveler segment is likely couples or solo travelers.
- Properties designed for 2 guests and 6 guests dominate the Hamilton STR market, accounting for 65.2% of listings.
- A significant 43.5% of listings cater specifically to 1-2 guests, highlighting strong demand from couples and solo travelers in Hamilton.
- 34.7% of properties accommodate 6+ guests, serving the market segment for larger families or group travel in Hamilton.
- On average, properties in Hamilton are equipped to host 3.9 guests.
Hamilton Airbnb Booking Patterns (2026): Available vs. Booked Days
Available Days Distribution
Booked Days Distribution
Booking Pattern Insights for Hamilton
- The most common availability pattern in Hamilton falls within the 181-270 days range, representing 43.5% of listings. This suggests many properties have significant open periods on their calendars.
- Approximately 69.6% of listings show high availability (181+ days open annually), indicating potential for increased bookings or specific owner usage patterns.
- For booked days, the 91-180 days range is most frequent in Hamilton (39.1%), reflecting common guest stay durations or potential owner blocking patterns.
- A notable 34.8% of properties secure long booking periods (181+ days booked per year), highlighting successful long-term rental strategies or significant owner usage.
Hamilton Airbnb Minimum Stay Requirements Analysis
Distribution of Listings by Minimum Night Requirement
1 Night
3 listings
13% of total
2 Nights
1 listings
4.3% of total
3 Nights
7 listings
30.4% of total
4-6 Nights
4 listings
17.4% of total
30+ Nights
8 listings
34.8% of total
Key Insights
- The most prevalent minimum stay requirement in Hamilton is 30+ Nights, adopted by 34.8% of listings. This highlights the market's preference for longer commitments.
- Very short stays (1-2 nights) are less common (17.3%), suggesting hosts prefer slightly longer bookings to optimize turnover.
- A significant segment (34.8%) caters to monthly stays (30+ nights) in Hamilton, pointing to opportunities in the extended-stay market.
Recommendations
- Align with the market by considering a 30+ Nights minimum stay, as 34.8% of Hamilton hosts use this setting.
- If feasible, allowing 1-night stays, especially midweek or during low season, could capture last-minute bookings, as only 13% currently do.
- Explore offering discounts for stays of 30+ nights to attract the 34.8% of the market seeking extended stays.
- Adjust minimum nights based on seasonality – potentially shorter during low season and longer during peak demand periods in Hamilton.
Hamilton Airbnb Cancellation Policy Trends Analysis (2026)
Super Strict 60 Days
1 listings
4.3% of total
Flexible
6 listings
26.1% of total
Moderate
3 listings
13% of total
Firm
13 listings
56.5% of total
Cancellation Policy Insights for Hamilton
- The prevailing Airbnb cancellation policy trend in Hamilton is Firm, used by 56.5% of listings.
- A majority (56.5%) of hosts in Hamilton utilize Firm or Strict policies, indicating a market where hosts prioritize booking security.
Recommendations for Hosts
- Consider adopting a Firm policy to align with the 56.5% market standard in Hamilton.
- Regularly review your cancellation policy against competitors and market demand shifts in Hamilton.
Hamilton STR Booking Lead Time Analysis (2026)
Average Booking Lead Time by Month
Booking Lead Time Insights for Hamilton
- The overall average booking lead time for vacation rentals in Hamilton is 57 days.
- Guests book furthest in advance for stays during July (average 78 days), likely coinciding with peak travel demand or local events.
- The shortest booking windows occur for stays in February (average 14 days), indicating more last-minute travel plans during this time.
- Seasonally, Summer (69 days avg.) sees the longest lead times, while Winter (37 days avg.) has the shortest, reflecting typical travel planning cycles.
Recommendations for Hosts
- Use the overall average lead time (57 days) as a baseline for your pricing and availability strategy in Hamilton.
- For July stays, consider implementing length-of-stay discounts or slightly higher rates for bookings made less than 78 days out to capitalize on advance planning.
- During February, focus on last-minute booking availability and promotions, as guests book with very short notice (14 days avg.).
- Target marketing efforts for the Summer season well in advance (at least 69 days) to capture early planners.
- Monitor your own booking lead times against these Hamilton averages to identify opportunities for dynamic pricing adjustments.
Popular & Essential Airbnb Amenities in Hamilton (2026)
Amenity Prevalence
Amenity Insights for Hamilton
- Essential amenities in Hamilton that guests expect include: Wifi, TV, Air conditioning, Hot water. Lacking these (any) could significantly impact bookings.
- Popular amenities like Free parking on premises, Iron, Kitchen are common but not universal. Offering these can provide a competitive edge.
Recommendations for Hosts
- Ensure your listing includes all essential amenities for Hamilton: Wifi, TV, Air conditioning, Hot water.
- Prioritize adding missing essentials: Hot water.
- Consider adding popular differentiators like Free parking on premises or Iron to increase appeal.
- Highlight unique or less common amenities you offer (e.g., hot tub, dedicated workspace, EV charger) in your listing description and photos.
- Regularly check competitor amenities in Hamilton to stay competitive.
Hamilton Airbnb Guest Demographics & Profile Analysis (2026)
Guest Profile Summary for Hamilton
- The typical guest profile for Airbnb in Hamilton consists of predominantly international visitors (92%), with top international origins including Canada, typically belonging to the Post-2000s (Gen Z/Alpha) group (50%), primarily speaking English or Spanish.
- Domestic travelers account for 7.7% of guests.
- Key international markets include United States (63.6%) and Canada (12.6%).
- Top languages spoken are English (61.9%) followed by Spanish (14.3%).
- A significant demographic segment is the Post-2000s (Gen Z/Alpha) group, representing 50% of guests.
Recommendations for Hosts
- Focus marketing internationally, particularly towards travelers from Canada.
- Tailor amenities and listing descriptions to appeal to the dominant Post-2000s (Gen Z/Alpha) demographic (e.g., highlight fast WiFi, smart home features, local guides).
- Highlight unique local experiences or amenities relevant to the primary guest profile.
- Consider seasonal promotions aligned with peak travel times for key origin markets.
Nearby Short-Term Rental Market Comparison
How does the Hamilton Airbnb market stack up against its neighbors? Compare key performance metrics like average monthly revenue, ADR, and occupancy rates in surrounding areas to understand the broader regional STR landscape.
| Market | Active Properties | Monthly Revenue | Daily Rate | Avg. Occupancy |
|---|---|---|---|---|
| Southampton | 41 | $5,984 | $466.24 | 49% |
| Town of St. George | 14 | $5,330 | $241.33 | 72% |
| Somerset | 30 | $5,006 | $448.41 | 49% |
| Warwick | 34 | $4,345 | $341.29 | 52% |
| Royal Naval Dockyard | 12 | $4,304 | $538.73 | 40% |
| Spanish Point | 19 | $4,214 | $247.41 | 66% |
| North Shore Village | 11 | $3,987 | $218.55 | 65% |
| Paget Parish | 11 | $3,957 | $330.52 | 61% |
| Southampton Parish | 11 | $3,870 | $308.42 | 50% |
| Smiths | 24 | $3,694 | $384.44 | 57% |