Cotonou Airbnb Market Analysis 2026: Short Term Rental Data & Vacation Rental Statistics in Littoral, Benin
Is Airbnb profitable in Cotonou in 2026? Explore comprehensive Airbnb analytics for Cotonou, Littoral, Benin to uncover income potential. This 2026 STR market report for Cotonou, based on AirROI data from February 2025 to January 2026, reveals key trends in the market of 232 active listings.
Whether you're considering an Airbnb investment in Cotonou, optimizing your existing vacation rental, or exploring rental arbitrage opportunities, understanding the Cotonou Airbnb data is crucial. Leveraging the low regulation environment is key to maximizing your short term rental income potential. Let's dive into the specifics.
Key Cotonou Airbnb Performance Metrics Overview
Monthly Airbnb Revenue Variations & Income Potential in Cotonou (2026)
Understanding the monthly revenue variations for Airbnb listings in Cotonou is key to maximizing your short term rental income potential. Seasonality significantly impacts earnings. Our analysis, based on data from the past 12 months, shows that the peak revenue month for STRs in Cotonou is typically July, while June often presents the lowest earnings, highlighting opportunities for strategic pricing adjustments during shoulder and low seasons. Explore the typical Airbnb income in Cotonou across different performance tiers:
- Best-in-class properties (Top 10%) achieve $1,024+ monthly, often utilizing dynamic pricing and superior guest experiences.
- Strong performing properties (Top 25%) earn $641 or more, indicating effective management and desirable locations/amenities.
- Typical properties (Median) generate around $322 per month, representing the average market performance.
- Entry-level properties (Bottom 25%) see earnings around $129, often with potential for optimization.
Average Monthly Airbnb Earnings Trend in Cotonou
Cotonou Airbnb Occupancy Rate Trends (2026)
Maximize your bookings by understanding the Cotonou STR occupancy trends. Seasonal demand shifts significantly influence how often properties are booked. Typically, Augustsees the highest demand (peak season occupancy), while June experiences the lowest (low season). Effective strategies, like adjusting minimum stays or offering promotions, can boost occupancy during slower periods. Here's how different property tiers perform in Cotonou:
- Best-in-class properties (Top 10%) achieve 77%+ occupancy, indicating high desirability and potentially optimized availability.
- Strong performing properties (Top 25%) maintain 53% or higher occupancy, suggesting good market fit and guest satisfaction.
- Typical properties (Median) have an occupancy rate around 28%.
- Entry-level properties (Bottom 25%) average 12% occupancy, potentially facing higher vacancy.
Average Monthly Occupancy Rate Trend in Cotonou
Average Daily Rate (ADR) Airbnb Trends in Cotonou (2026)
Effective short term rental pricing strategy in Cotonou involves understanding monthly ADR fluctuations. The Average Daily Rate (ADR) for Airbnb in Cotonou typically peaks in January and dips lowest during March. Leveraging Airbnb dynamic pricing tools or strategies based on this seasonality can significantly boost revenue. Here's a look at the typical nightly rates achieved:
- Best-in-class properties (Top 10%) command rates of $85+ per night, often due to premium features or locations.
- Strong performing properties (Top 25%) achieve nightly rates of $56 or more.
- Typical properties (Median) charge around $40 per night.
- Entry-level properties (Bottom 25%) earn around $29 per night.
Average Daily Rate (ADR) Trend by Month in Cotonou
Get Live Cotonou Market Intelligence 👇

Explore Real-time Analytics
Airbnb Seasonality Analysis & Trends in Cotonou (2026)
Peak Season (July, August, April)
- Revenue averages $604 per month
- Occupancy rates average 39.3%
- Daily rates average $51
Shoulder Season
- Revenue averages $473 per month
- Occupancy maintains around 34.9%
- Daily rates hold near $53
Low Season (March, May, June)
- Revenue drops to average $384 per month
- Occupancy decreases to average 30.3%
- Daily rates adjust to average $51
Seasonality Insights for Cotonou
- The Airbnb seasonality in Cotonou shows moderate seasonality with distinct peak and low periods. While the sections above show seasonal averages, it's also insightful to look at the extremes:
- During the high season, the absolute peak month showcases Cotonou's highest earning potential, with monthly revenues capable of climbing to $669, occupancy reaching a high of 40.9%, and ADRs peaking at $54.
- Conversely, the slowest single month of the year, typically falling within the low season, marks the market's lowest point. In this month, revenue might dip to $346, occupancy could drop to 28.7%, and ADRs may adjust down to $50.
- Understanding both the seasonal averages and these monthly peaks and troughs in revenue, occupancy, and ADR is crucial for maximizing your Airbnb profit potential in Cotonou.
Seasonal Strategies for Maximizing Profit
- Peak Season: Maximize revenue through premium pricing and potentially longer minimum stays. Ensure high availability.
- Low Season: Offer competitive pricing, special promotions (e.g., extended stay discounts), and flexible cancellation policies. Target off-season travelers like remote workers or budget-conscious guests.
- Shoulder Seasons: Implement dynamic pricing that balances peak and low rates. Target weekend travelers or specific events. Offer slightly more flexible terms than peak season.
- Regularly analyze your own performance against these Cotonou seasonality benchmarks and adjust your pricing and availability strategy accordingly.
Best Areas for Airbnb Investment in Cotonou (2026)
Exploring the top neighborhoods for short-term rentals in Cotonou? This section highlights key areas, outlining why they are attractive for hosts and guests, along with notable local attractions. Consider these locations based on your target guest profile and investment strategy.
| Neighborhood / Area | Why Host Here? (Target Guests & Appeal) | Key Attractions & Landmarks |
|---|---|---|
| Cotonou Centre | The bustling heart of Cotonou, this area is ideal for hosting guests who want to explore local markets, culture, and cuisine. Its proximity to major attractions makes it a favorite among tourists. | Dantokpa Market, Cotonou Cathedral, Place des Martyrs, Artisan Market, Ouidah Museum of History |
| Ganvié | Known as the 'Venice of Africa', Ganvié is famous for its stilt houses and scenic views over the lagoon. It's a unique destination that attracts visitors looking for a cultural experience. | Ganvié Stilt Village, Local fishing tours, Traditional boat rides, Lagoon views, Craft markets |
| Route de l'Aéroport | This area is close to the airport, making it a convenient location for travelers. It's popular with business visitors and tourists arriving in Cotonou. | Cotonou International Airport, Hotel complexes, Restaurants and cafes, Business centers, Shopping venues |
| Bohicon | A bit further from central Cotonou, Bohicon is known for its historical and natural attractions. It's ideal for adventurous travelers who want to explore the region's culture. | Bohicon Market, Royal Palace of Abomey, Togoville, Natural parks, Cultural festivals |
| Wologasou | A residential neighborhood that offers a local vibe along with accessibility to many attractions. It's perfect for travelers looking for a quieter stay. | Local eateries, Community parks, Craft shops, Proximity to public transport, Cultural experiences |
| Adjara | This coastal area near Cotonou is known for its beaches and tranquil environment. It's great for travelers looking to relax and enjoy some sun and surf. | Adjara Beach, Water sports activities, Local seafood restaurants, Sunset views, Beachfront accommodations |
| Kouhounou | A vibrant neighborhood with a blend of local culture and commerce. It offers a unique experience for visitors interested in authentic local life. | Kouhounou Market, Cultural events, Artisans, Local music venues, Street food stalls |
| Attogon | This area is characterized by its beautiful natural settings and is perfect for eco-tourism. It's an ideal spot for environmentally conscious travelers. | Natural reserves, Walking trails, Bird watching, Community meetings, Cultural exchanges |
Understanding Airbnb License Requirements & STR Laws in Cotonou (2026)
While Cotonou, Littoral, Benin currently shows low STR regulations, specific Airbnb license requirements might still exist or change. Always verify the latest short term rental regulations and Airbnb license requirements directly with local government authorities for Cotonou to ensure full compliance before hosting.
(Source: AirROI data, 2026, based on 1% licensed listings)
Top Performing Airbnb Properties in Cotonou (2026)
Benchmark your potential! Explore examples of top-performing Airbnb properties in Cotonoubased on Trailing Twelve Month (TTM) revenue. Analyze their characteristics, revenue, occupancy rate, and ADR to understand what drives success in this market.
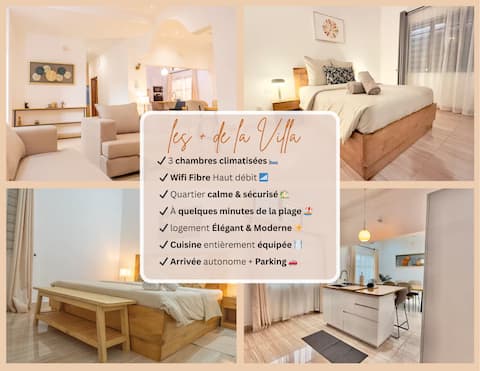
Cozy & modern house in Fidjrosse (Beach & Sea)
Entire Place • 3 bedrooms
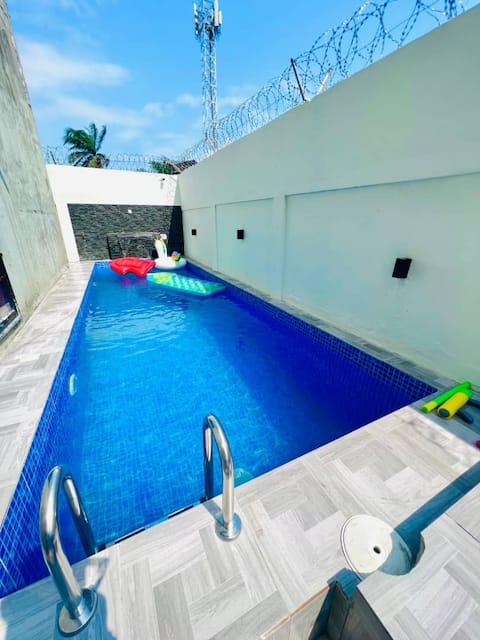
Villa moderne de 5 chambres avec piscine
Entire Place • 5 bedrooms
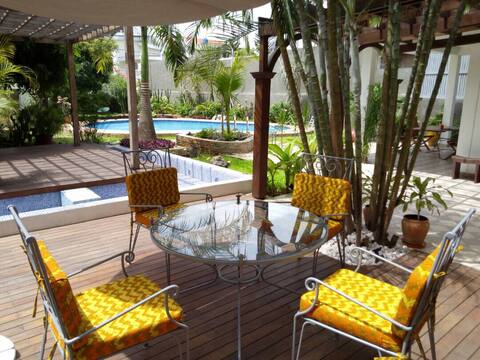
Villa Chayol - Beautiful, spacious, bright!
Entire Place • 5 bedrooms

Tropical waterfront lodge
Entire Place • 1 bedroom

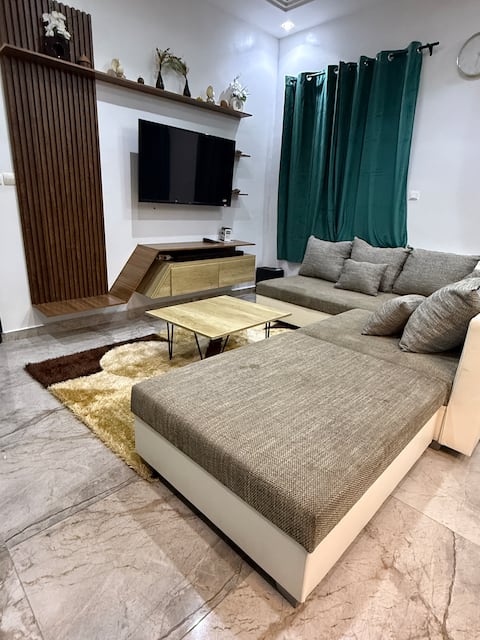
3-bedroom apartment in Cotonou: 3 bedrooms in Fidjrossè
Entire Place • 3 bedrooms
Spacious, cozy 4 bedroom apartment, terrace with city view
Entire Place • 3 bedrooms
Note: Performance varies based on location, size, amenities, seasonality, and management quality. Data reflects the past 12 months.
Top Performing Airbnb Hosts in Cotonou (2026)
Learn from the best! This table showcases top-performing Airbnb hosts in Cotonou based on the number of properties managed and estimated total revenue over the past year. Analyze their scale and performance metrics.
| Host Name | Properties | Grossing Revenue | Stay Reviews | Avg Rating |
|---|---|---|---|---|
| Dem’s Appart | 5 | $35,926 | 72 | 4.90/5.0 |
| Anne-Yolaine | 3 | $31,636 | 34 | 4.89/5.0 |
| Landry | 4 | $31,551 | 124 | 4.89/5.0 |
| Vianney | 1 | $25,735 | 40 | 4.95/5.0 |
| Kris-Nelly | 6 | $24,082 | 166 | 4.77/5.0 |
| Jessyca | 1 | $22,808 | 14 | 4.79/5.0 |
| Paul | 5 | $21,904 | 55 | 4.80/5.0 |
| Amaaffra | 2 | $18,151 | 113 | 4.81/5.0 |
| Tite Renaud | 2 | $15,807 | 132 | 4.99/5.0 |
| Assiba | 2 | $14,618 | 22 | 4.64/5.0 |
Analyzing the strategies of top hosts, such as their property selection, pricing, and guest communication, can offer valuable lessons for optimizing your own Airbnb operations in Cotonou.
Dive Deeper: Advanced Cotonou STR Market Data (2026)
Ready to unlock more insights? AirROI provides access to advanced metrics and comprehensive Airbnb data for Cotonou. Explore detailed analytics beyond this report to refine your investment strategy, optimize pricing, and maximize your vacation rental profits.
Explore Advanced MetricsCotonou Short-Term Rental Market Composition (2026): Property & Room Types
Room Type Distribution
Property Type Distribution
Market Composition Insights for Cotonou
- The Cotonou Airbnb market composition is heavily skewed towards Entire Home/Apt listings, which make up 84.9% of the 232 active rentals. This indicates strong guest preference for privacy and space.
- Looking at the property type distribution in Cotonou, Apartment/Condo properties are the most common (65.9%), reflecting the local real estate landscape.
- Houses represent a significant 24.6% portion, catering likely to families or larger groups.
- The presence of 9.1% Hotel/Boutique listings indicates integration with traditional hospitality.
- Smaller segments like others (combined 0.4%) offer potential for unique stay experiences.
Cotonou Airbnb Room Capacity Analysis (2026): Bedroom Distribution
Distribution of Listings by Number of Bedrooms
Room Capacity Insights for Cotonou
- The dominant room capacity in Cotonou is 1 bedroom listings, making up 37.5% of the market. This suggests a strong demand for properties suitable for couples or solo travelers.
- Together, 1 bedroom and 2 bedrooms properties represent 74.1% of the active Airbnb listings in Cotonou, indicating a high concentration in these sizes.
Cotonou Vacation Rental Guest Capacity Trends (2026)
Distribution of Listings by Guest Capacity
Guest Capacity Insights for Cotonou
- The most common guest capacity trend in Cotonou vacation rentals is listings accommodating 2 guests (34.9%). This suggests the primary traveler segment is likely couples or solo travelers.
- Properties designed for 2 guests and 4 guests dominate the Cotonou STR market, accounting for 64.2% of listings.
- 14.2% of properties accommodate 6+ guests, serving the market segment for larger families or group travel in Cotonou.
- On average, properties in Cotonou are equipped to host 3.2 guests.
Cotonou Airbnb Booking Patterns (2026): Available vs. Booked Days
Available Days Distribution
Booked Days Distribution
Booking Pattern Insights for Cotonou
- The most common availability pattern in Cotonou falls within the 271-366 days range, representing 79.3% of listings. This suggests many properties have significant open periods on their calendars.
- Approximately 92.2% of listings show high availability (181+ days open annually), indicating potential for increased bookings or specific owner usage patterns.
- For booked days, the 1-30 days range is most frequent in Cotonou (49.1%), reflecting common guest stay durations or potential owner blocking patterns.
- A notable 7.8% of properties secure long booking periods (181+ days booked per year), highlighting successful long-term rental strategies or significant owner usage.
Cotonou Airbnb Minimum Stay Requirements Analysis
Distribution of Listings by Minimum Night Requirement
1 Night
90 listings
38.8% of total
2 Nights
53 listings
22.8% of total
3 Nights
37 listings
15.9% of total
4-6 Nights
16 listings
6.9% of total
7-29 Nights
11 listings
4.7% of total
30+ Nights
25 listings
10.8% of total
Key Insights
- The most prevalent minimum stay requirement in Cotonou is 1 Night, adopted by 38.8% of listings. This highlights the market's preference for shorter, flexible bookings.
- A strong majority (61.6%) of the Cotonou Airbnb data shows acceptance of very short stays (1-2 nights), indicating a dynamic, high-turnover market.
- A significant segment (10.8%) caters to monthly stays (30+ nights) in Cotonou, pointing to opportunities in the extended-stay market.
Recommendations
- Align with the market by considering a 1 Night minimum stay, as 38.8% of Cotonou hosts use this setting.
- Explore offering discounts for stays of 30+ nights to attract the 10.8% of the market seeking extended stays.
- Adjust minimum nights based on seasonality – potentially shorter during low season and longer during peak demand periods in Cotonou.
Cotonou Airbnb Cancellation Policy Trends Analysis (2026)
Flexible
135 listings
58.2% of total
Moderate
60 listings
25.9% of total
Firm
32 listings
13.8% of total
Strict
5 listings
2.2% of total
Cancellation Policy Insights for Cotonou
- The prevailing Airbnb cancellation policy trend in Cotonou is Flexible, used by 58.2% of listings.
- The market strongly favors guest-friendly terms, with 84.1% of listings offering Flexible or Moderate policies. This suggests guests in Cotonou may expect booking flexibility.
- Strict cancellation policies are quite rare (2.2%), potentially making listings with this policy less competitive unless justified by high demand or property type.
Recommendations for Hosts
- Consider adopting a Flexible policy to align with the 58.2% market standard in Cotonou.
- Given the high prevalence of Flexible policies (58.2%), offering this can enhance booking appeal, especially during shoulder seasons.
- Using a Strict policy might deter some guests, as only 2.2% of listings use it. Evaluate if potential revenue protection outweighs possible lower booking rates.
- Regularly review your cancellation policy against competitors and market demand shifts in Cotonou.
Cotonou STR Booking Lead Time Analysis (2026)
Average Booking Lead Time by Month
Booking Lead Time Insights for Cotonou
- The overall average booking lead time for vacation rentals in Cotonou is 17 days.
- Guests book furthest in advance for stays during January (average 29 days), likely coinciding with peak travel demand or local events.
- The shortest booking windows occur for stays in September (average 10 days), indicating more last-minute travel plans during this time.
- Seasonally, Winter (24 days avg.) sees the longest lead times, while Spring (14 days avg.) has the shortest, reflecting typical travel planning cycles.
Recommendations for Hosts
- Use the overall average lead time (17 days) as a baseline for your pricing and availability strategy in Cotonou.
- For January stays, consider implementing length-of-stay discounts or slightly higher rates for bookings made less than 29 days out to capitalize on advance planning.
- Target marketing efforts for the Winter season well in advance (at least 24 days) to capture early planners.
- Monitor your own booking lead times against these Cotonou averages to identify opportunities for dynamic pricing adjustments.
Popular & Essential Airbnb Amenities in Cotonou (2026)
Amenity Prevalence
Amenity Insights for Cotonou
- Essential amenities in Cotonou that guests expect include: Air conditioning. Lacking these (this) could significantly impact bookings.
- Popular amenities like Wifi, Kitchen, Free parking on premises are common but not universal. Offering these can provide a competitive edge.
- Warning: Wifi is not universally provided but is considered essential globally. Ensure reliable Wifi is offered.
Recommendations for Hosts
- Ensure your listing includes all essential amenities for Cotonou: Air conditioning.
- Prioritize adding missing essentials: Air conditioning.
- Consider adding popular differentiators like Wifi or Kitchen to increase appeal.
- Highlight unique or less common amenities you offer (e.g., hot tub, dedicated workspace, EV charger) in your listing description and photos.
- Regularly check competitor amenities in Cotonou to stay competitive.
Cotonou Airbnb Guest Demographics & Profile Analysis (2026)
Guest Profile Summary for Cotonou
- The typical guest profile for Airbnb in Cotonou consists of predominantly international visitors (98%), with top international origins including United States, typically belonging to the Post-2000s (Gen Z/Alpha) group (50%), primarily speaking French or English.
- Domestic travelers account for 1.6% of guests.
- Key international markets include France (44%) and United States (13.1%).
- Top languages spoken are French (40.3%) followed by English (38.7%).
- A significant demographic segment is the Post-2000s (Gen Z/Alpha) group, representing 50% of guests.
Recommendations for Hosts
- Focus marketing internationally, particularly towards travelers from United States.
- Offer listing details and communication support in French.
- Tailor amenities and listing descriptions to appeal to the dominant Post-2000s (Gen Z/Alpha) demographic (e.g., highlight fast WiFi, smart home features, local guides).
- Highlight unique local experiences or amenities relevant to the primary guest profile.
- Consider seasonal promotions aligned with peak travel times for key origin markets.
Nearby Short-Term Rental Market Comparison
How does the Cotonou Airbnb market stack up against its neighbors? Compare key performance metrics like average monthly revenue, ADR, and occupancy rates in surrounding areas to understand the broader regional STR landscape.
| Market | Active Properties | Monthly Revenue | Daily Rate | Avg. Occupancy |
|---|---|---|---|---|
| Ibeju | 16 | $1,061 | $108.42 | 37% |
| Eko Atlantic | 10 | $914 | $227.86 | 20% |
| Falomo | 97 | $713 | $157.78 | 30% |
| Ebute-Metta | 19 | $709 | $56.74 | 46% |
| Moba | 155 | $573 | $110.35 | 30% |
| Ajah | 10 | $511 | $99.79 | 28% |
| Ikate | 120 | $478 | $102.32 | 29% |
| Itirin | 97 | $464 | $110.21 | 30% |
| Ikeja | 182 | $450 | $73.45 | 30% |
| Djako Daho | 47 | $420 | $56.59 | 38% |