San Pedro Airbnb Market Analysis 2026: Short Term Rental Data & Vacation Rental Statistics in Corozal District, Belize
Is Airbnb profitable in San Pedro in 2026? Explore comprehensive Airbnb analytics for San Pedro, Corozal District, Belize to uncover income potential. This 2026 STR market report for San Pedro, based on AirROI data from February 2025 to January 2026, reveals key trends in the niche market of 94 active listings.
Whether you're considering an Airbnb investment in San Pedro, optimizing your existing vacation rental, or exploring rental arbitrage opportunities, understanding the San Pedro Airbnb data is crucial. Leveraging the low regulation environment is key to maximizing your short term rental income potential. Let's dive into the specifics.
Key San Pedro Airbnb Performance Metrics Overview
Monthly Airbnb Revenue Variations & Income Potential in San Pedro (2026)
Understanding the monthly revenue variations for Airbnb listings in San Pedro is key to maximizing your short term rental income potential. Seasonality significantly impacts earnings. Our analysis, based on data from the past 12 months, shows that the peak revenue month for STRs in San Pedro is typically February, while May often presents the lowest earnings, highlighting opportunities for strategic pricing adjustments during shoulder and low seasons. Explore the typical Airbnb income in San Pedro across different performance tiers:
- Best-in-class properties (Top 10%) achieve $8,866+ monthly, often utilizing dynamic pricing and superior guest experiences.
- Strong performing properties (Top 25%) earn $4,609 or more, indicating effective management and desirable locations/amenities.
- Typical properties (Median) generate around $2,183 per month, representing the average market performance.
- Entry-level properties (Bottom 25%) see earnings around $1,040, often with potential for optimization.
Average Monthly Airbnb Earnings Trend in San Pedro
San Pedro Airbnb Occupancy Rate Trends (2026)
Maximize your bookings by understanding the San Pedro STR occupancy trends. Seasonal demand shifts significantly influence how often properties are booked. Typically, Februarysees the highest demand (peak season occupancy), while May experiences the lowest (low season). Effective strategies, like adjusting minimum stays or offering promotions, can boost occupancy during slower periods. Here's how different property tiers perform in San Pedro:
- Best-in-class properties (Top 10%) achieve 73%+ occupancy, indicating high desirability and potentially optimized availability.
- Strong performing properties (Top 25%) maintain 55% or higher occupancy, suggesting good market fit and guest satisfaction.
- Typical properties (Median) have an occupancy rate around 33%.
- Entry-level properties (Bottom 25%) average 18% occupancy, potentially facing higher vacancy.
Average Monthly Occupancy Rate Trend in San Pedro
Average Daily Rate (ADR) Airbnb Trends in San Pedro (2026)
Effective short term rental pricing strategy in San Pedro involves understanding monthly ADR fluctuations. The Average Daily Rate (ADR) for Airbnb in San Pedro typically peaks in January and dips lowest during August. Leveraging Airbnb dynamic pricing tools or strategies based on this seasonality can significantly boost revenue. Here's a look at the typical nightly rates achieved:
- Best-in-class properties (Top 10%) command rates of $577+ per night, often due to premium features or locations.
- Strong performing properties (Top 25%) achieve nightly rates of $334 or more.
- Typical properties (Median) charge around $218 per night.
- Entry-level properties (Bottom 25%) earn around $133 per night.
Average Daily Rate (ADR) Trend by Month in San Pedro
Get Live San Pedro Market Intelligence 👇

Explore Real-time Analytics
Airbnb Seasonality Analysis & Trends in San Pedro (2026)
Peak Season (February, March, January)
- Revenue averages $4,815 per month
- Occupancy rates average 46.7%
- Daily rates average $303
Shoulder Season
- Revenue averages $3,830 per month
- Occupancy maintains around 37.6%
- Daily rates hold near $280
Low Season (May, September, October)
- Revenue drops to average $2,367 per month
- Occupancy decreases to average 26.4%
- Daily rates adjust to average $274
Seasonality Insights for San Pedro
- The Airbnb seasonality in San Pedro shows highly seasonal trends requiring careful strategy. While the sections above show seasonal averages, it's also insightful to look at the extremes:
- During the high season, the absolute peak month showcases San Pedro's highest earning potential, with monthly revenues capable of climbing to $5,059, occupancy reaching a high of 55.4%, and ADRs peaking at $323.
- Conversely, the slowest single month of the year, typically falling within the low season, marks the market's lowest point. In this month, revenue might dip to $2,138, occupancy could drop to 21.1%, and ADRs may adjust down to $254.
- Understanding both the seasonal averages and these monthly peaks and troughs in revenue, occupancy, and ADR is crucial for maximizing your Airbnb profit potential in San Pedro.
Seasonal Strategies for Maximizing Profit
- Peak Season: Maximize revenue through premium pricing and potentially longer minimum stays. Ensure high availability.
- Low Season: Offer competitive pricing, special promotions (e.g., extended stay discounts), and flexible cancellation policies. Target off-season travelers like remote workers or budget-conscious guests.
- Shoulder Seasons: Implement dynamic pricing that balances peak and low rates. Target weekend travelers or specific events. Offer slightly more flexible terms than peak season.
- Regularly analyze your own performance against these San Pedro seasonality benchmarks and adjust your pricing and availability strategy accordingly.
Best Areas for Airbnb Investment in San Pedro (2026)
Exploring the top neighborhoods for short-term rentals in San Pedro? This section highlights key areas, outlining why they are attractive for hosts and guests, along with notable local attractions. Consider these locations based on your target guest profile and investment strategy.
| Neighborhood / Area | Why Host Here? (Target Guests & Appeal) | Key Attractions & Landmarks |
|---|---|---|
| Corozal Town | The largest town in the Corozal District, attracting tourists for its vibrant culture and proximity to various attractions. Ideal for visitors wanting to explore Belize's northern region. | Corozal Bay, Cerros Mayan Ruins, The Santa Rita Ruins, Corozal Community Museum, Centenary Park |
| Sarteneja | A charming fishing village known for its beautiful beaches and laid-back atmosphere. Perfect for those looking for a peaceful getaway and water activities. | Sarteneja beach, Bird watching, Snorkeling excursions, Local seafood restaurants |
| Copper Bank | A small village that offers visitors a unique glimpse of local life and stunning natural surroundings. Wonderful for eco-tourism and nature enthusiasts. | The Bacalar Chico National Park, Wildlife viewing, Fishing and boating opportunities |
| Paraiso | A tranquil area known for its scenic beauty and close-knit community. Attracts visitors looking for a relaxing experience away from the busy tourist spots. | Nature trails, Local markets, Fishing spots |
| Chan Chen | A Maya village that gives visitors insight into the local culture and traditions. Great for tourists who appreciate cultural heritage and authentic experiences. | Maya ruins nearby, Traditional local crafts, Cultural activities |
| Placencia | Though a bit farther away, many tourists visit for its stunning beaches and vibrant nightlife. Increasingly popular for those who want a mix of relaxation and entertainment. | Placencia Beach, The split, Local bars and restaurants, Water sports |
| Bacalar Chico | This area offers stunning natural beauty and is perfect for ecotourism. Increasing interest from travelers who love nature and outdoor adventures. | Bacalar Chico National Park, Coral reefs, Kayaking and snorkeling |
| Chunox | A quaint village that provides access to both Maya culture and natural wonders. Attracts visitors who want to experience authentic Belizean life. | Mayan ruins, Local cuisine, Nature tours |
Understanding Airbnb License Requirements & STR Laws in San Pedro (2026)
While San Pedro, Corozal District, Belize currently shows low STR regulations, specific Airbnb license requirements might still exist or change. Always verify the latest short term rental regulations and Airbnb license requirements directly with local government authorities for San Pedro to ensure full compliance before hosting.
(Source: AirROI data, 2026, based on 1% licensed listings)
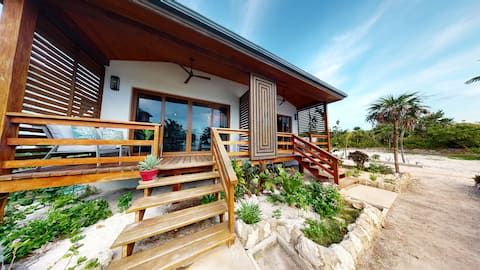
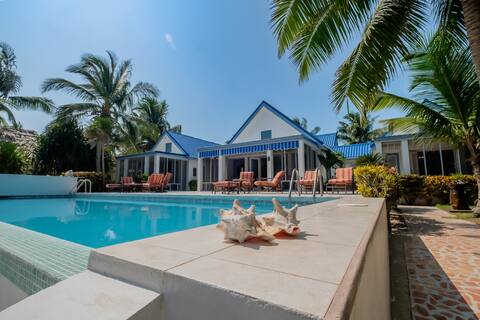
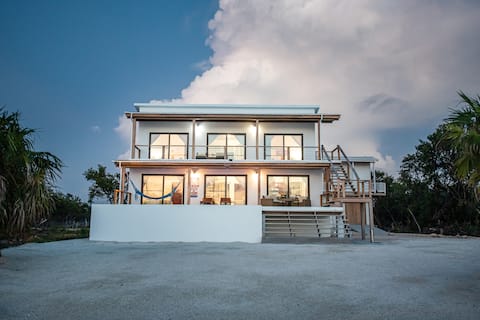
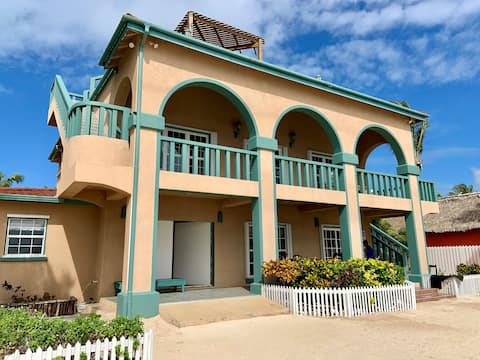
Top Performing Airbnb Properties in San Pedro (2026)
Benchmark your potential! Explore examples of top-performing Airbnb properties in San Pedrobased on Trailing Twelve Month (TTM) revenue. Analyze their characteristics, revenue, occupancy rate, and ADR to understand what drives success in this market.

Casa Nex Ta Sea, All-Inclusive-Private Beach Home
Entire Place • 3 bedrooms
Secluded Oceanfront Private Estate by ALOM
Entire Place • 4 bedrooms
Villa Turquesa: Your Luxurious Caribbean Escape
Entire Place • 7 bedrooms
Eco-Friendly Villa at Secret Beach Belize!
Entire Place • 3 bedrooms
Close to Secret Beach. Kayaks. Bikes. Pool.
Entire Place • 5 bedrooms
Casa Agua Azul & The Pool Club at Mahogany Bay
Entire Place • 4 bedrooms
Note: Performance varies based on location, size, amenities, seasonality, and management quality. Data reflects the past 12 months.
Top Performing Airbnb Hosts in San Pedro (2026)
Learn from the best! This table showcases top-performing Airbnb hosts in San Pedro based on the number of properties managed and estimated total revenue over the past year. Analyze their scale and performance metrics.
| Host Name | Properties | Grossing Revenue | Stay Reviews | Avg Rating |
|---|---|---|---|---|
| M&B Luxury Rentals | 9 | $502,678 | 173 | 4.92/5.0 |
| Azul | 26 | $326,157 | 145 | 4.63/5.0 |
| Sunrise | 4 | $261,661 | 19 | 4.83/5.0 |
| Chad | 2 | $210,115 | 85 | 4.96/5.0 |
| Jason | 1 | $158,101 | 34 | 4.91/5.0 |
| Kelin | 7 | $149,102 | 60 | 4.89/5.0 |
| Brandy | 1 | $126,599 | 134 | 4.96/5.0 |
| StayFloreo | 4 | $96,483 | 34 | 4.83/5.0 |
| Annie | 3 | $82,126 | 67 | 4.59/5.0 |
| Hidden Jewel | 4 | $81,000 | 11 | 4.74/5.0 |
Analyzing the strategies of top hosts, such as their property selection, pricing, and guest communication, can offer valuable lessons for optimizing your own Airbnb operations in San Pedro.
Dive Deeper: Advanced San Pedro STR Market Data (2026)
Ready to unlock more insights? AirROI provides access to advanced metrics and comprehensive Airbnb data for San Pedro. Explore detailed analytics beyond this report to refine your investment strategy, optimize pricing, and maximize your vacation rental profits.
Explore Advanced MetricsSan Pedro Short-Term Rental Market Composition (2026): Property & Room Types
Room Type Distribution
Property Type Distribution
Market Composition Insights for San Pedro
- The San Pedro Airbnb market composition is heavily skewed towards Entire Home/Apt listings, which make up 86.2% of the 94 active rentals. This indicates strong guest preference for privacy and space.
- Looking at the property type distribution in San Pedro, House properties are the most common (47.9%), reflecting the local real estate landscape.
- Houses represent a significant 47.9% portion, catering likely to families or larger groups.
- The presence of 12.8% Hotel/Boutique listings indicates integration with traditional hospitality.
- Smaller segments like outdoor/unique, others, unique stays (combined 4.3%) offer potential for unique stay experiences.
San Pedro Airbnb Room Capacity Analysis (2026): Bedroom Distribution
Distribution of Listings by Number of Bedrooms
Room Capacity Insights for San Pedro
- The dominant room capacity in San Pedro is 1 bedroom listings, making up 44.7% of the market. This suggests a strong demand for properties suitable for couples or solo travelers.
- Together, 1 bedroom and 2 bedrooms properties represent 68.1% of the active Airbnb listings in San Pedro, indicating a high concentration in these sizes.
- A significant 25.5% of listings offer 3+ bedrooms, catering to larger groups and families seeking more space in San Pedro.
San Pedro Vacation Rental Guest Capacity Trends (2026)
Distribution of Listings by Guest Capacity
Guest Capacity Insights for San Pedro
- The most common guest capacity trend in San Pedro vacation rentals is listings accommodating 3 guests (23.4%). This suggests the primary traveler segment is likely small families or groups.
- Properties designed for 3 guests and 2 guests dominate the San Pedro STR market, accounting for 44.7% of listings.
- 33.0% of properties accommodate 6+ guests, serving the market segment for larger families or group travel in San Pedro.
- On average, properties in San Pedro are equipped to host 4.4 guests.
San Pedro Airbnb Booking Patterns (2026): Available vs. Booked Days
Available Days Distribution
Booked Days Distribution
Booking Pattern Insights for San Pedro
- The most common availability pattern in San Pedro falls within the 271-366 days range, representing 63.8% of listings. This suggests many properties have significant open periods on their calendars.
- Approximately 95.7% of listings show high availability (181+ days open annually), indicating potential for increased bookings or specific owner usage patterns.
- For booked days, the 31-90 days range is most frequent in San Pedro (46.8%), reflecting common guest stay durations or potential owner blocking patterns.
- A notable 5.3% of properties secure long booking periods (181+ days booked per year), highlighting successful long-term rental strategies or significant owner usage.
San Pedro Airbnb Minimum Stay Requirements Analysis
Distribution of Listings by Minimum Night Requirement
1 Night
19 listings
20.2% of total
2 Nights
15 listings
16% of total
3 Nights
32 listings
34% of total
4-6 Nights
3 listings
3.2% of total
30+ Nights
25 listings
26.6% of total
Key Insights
- The most prevalent minimum stay requirement in San Pedro is 3 Nights, adopted by 34% of listings. This highlights the market's preference for longer commitments.
- A significant segment (26.6%) caters to monthly stays (30+ nights) in San Pedro, pointing to opportunities in the extended-stay market.
Recommendations
- Align with the market by considering a 3 Nights minimum stay, as 34% of San Pedro hosts use this setting.
- If feasible, allowing 1-night stays, especially midweek or during low season, could capture last-minute bookings, as only 20.2% currently do.
- Explore offering discounts for stays of 30+ nights to attract the 26.6% of the market seeking extended stays.
- Adjust minimum nights based on seasonality – potentially shorter during low season and longer during peak demand periods in San Pedro.
San Pedro Airbnb Cancellation Policy Trends Analysis (2026)
Super Strict 30 Days
37 listings
39.4% of total
Super Strict 60 Days
5 listings
5.3% of total
Flexible
11 listings
11.7% of total
Moderate
9 listings
9.6% of total
Firm
29 listings
30.9% of total
Strict
3 listings
3.2% of total
Cancellation Policy Insights for San Pedro
- The prevailing Airbnb cancellation policy trend in San Pedro is Super Strict 30 Days, used by 39.4% of listings.
- There's a relatively balanced mix between guest-friendly (21.3%) and stricter (34.1%) policies, offering choices for different guest needs.
- Strict cancellation policies are quite rare (3.2%), potentially making listings with this policy less competitive unless justified by high demand or property type.
Recommendations for Hosts
- Consider adopting a Super Strict 30 Days policy to align with the 39.4% market standard in San Pedro.
- Using a Strict policy might deter some guests, as only 3.2% of listings use it. Evaluate if potential revenue protection outweighs possible lower booking rates.
- Regularly review your cancellation policy against competitors and market demand shifts in San Pedro.
San Pedro STR Booking Lead Time Analysis (2026)
Average Booking Lead Time by Month
Booking Lead Time Insights for San Pedro
- The overall average booking lead time for vacation rentals in San Pedro is 66 days.
- Guests book furthest in advance for stays during April (average 82 days), likely coinciding with peak travel demand or local events.
- The shortest booking windows occur for stays in September (average 35 days), indicating more last-minute travel plans during this time.
- Seasonally, Winter (74 days avg.) sees the longest lead times, while Fall (48 days avg.) has the shortest, reflecting typical travel planning cycles.
Recommendations for Hosts
- Use the overall average lead time (66 days) as a baseline for your pricing and availability strategy in San Pedro.
- For April stays, consider implementing length-of-stay discounts or slightly higher rates for bookings made less than 82 days out to capitalize on advance planning.
- Target marketing efforts for the Winter season well in advance (at least 74 days) to capture early planners.
- Monitor your own booking lead times against these San Pedro averages to identify opportunities for dynamic pricing adjustments.
Popular & Essential Airbnb Amenities in San Pedro (2026)
Amenity Prevalence
Amenity Insights for San Pedro
- Essential amenities in San Pedro that guests expect include: Air conditioning, Wifi, Fire extinguisher. Lacking these (any) could significantly impact bookings.
- Popular amenities like Free parking on premises, Coffee maker, Smoke alarm are common but not universal. Offering these can provide a competitive edge.
Recommendations for Hosts
- Ensure your listing includes all essential amenities for San Pedro: Air conditioning, Wifi, Fire extinguisher.
- Prioritize adding missing essentials: Fire extinguisher.
- Consider adding popular differentiators like Free parking on premises or Coffee maker to increase appeal.
- Highlight unique or less common amenities you offer (e.g., hot tub, dedicated workspace, EV charger) in your listing description and photos.
- Regularly check competitor amenities in San Pedro to stay competitive.
San Pedro Airbnb Guest Demographics & Profile Analysis (2026)
Guest Profile Summary for San Pedro
- The typical guest profile for Airbnb in San Pedro consists of predominantly international visitors (98%), with top international origins including Canada, typically belonging to the Post-2000s (Gen Z/Alpha) group (50%), primarily speaking English or Spanish.
- Domestic travelers account for 1.7% of guests.
- Key international markets include United States (83.7%) and Canada (6.4%).
- Top languages spoken are English (66.8%) followed by Spanish (17.1%).
- A significant demographic segment is the Post-2000s (Gen Z/Alpha) group, representing 50% of guests.
Recommendations for Hosts
- Focus marketing internationally, particularly towards travelers from Canada.
- Tailor amenities and listing descriptions to appeal to the dominant Post-2000s (Gen Z/Alpha) demographic (e.g., highlight fast WiFi, smart home features, local guides).
- Highlight unique local experiences or amenities relevant to the primary guest profile.
- Consider seasonal promotions aligned with peak travel times for key origin markets.
Nearby Short-Term Rental Market Comparison
How does the San Pedro Airbnb market stack up against its neighbors? Compare key performance metrics like average monthly revenue, ADR, and occupancy rates in surrounding areas to understand the broader regional STR landscape.
| Market | Active Properties | Monthly Revenue | Daily Rate | Avg. Occupancy |
|---|---|---|---|---|
| Maya Beach | 76 | $4,346 | $421.40 | 38% |
| Seine Bight | 26 | $3,700 | $413.82 | 38% |
| Caribbean Way | 26 | $3,083 | $361.55 | 37% |
| Kate Subdivision | 13 | $2,924 | $346.23 | 37% |
| San Pedro Town | 667 | $2,922 | $324.04 | 37% |
| San Pedro | 44 | $2,911 | $402.68 | 33% |
| Hopkins Village | 67 | $2,814 | $300.89 | 35% |
| Placencia | 297 | $2,167 | $296.42 | 34% |
| West Bay | 42 | $2,130 | $374.23 | 31% |
| Caye Caulker Village | 356 | $1,975 | $173.01 | 42% |