Zedelgem Airbnb Market Analysis 2025: Short Term Rental Data & Vacation Rental Statistics in West Flanders, Belgium
Is Airbnb profitable in Zedelgem in 2025? Explore comprehensive Airbnb analytics for Zedelgem, West Flanders, Belgium to uncover income potential. This 2025 STR market report for Zedelgem, based on AirROI data from November 2024 to October 2025, reveals key trends in the niche market of 43 active listings.
Whether you're considering an Airbnb investment in Zedelgem, optimizing your existing vacation rental, or exploring rental arbitrage opportunities, understanding the Zedelgem Airbnb data is crucial. Leveraging the low regulation environment is key to maximizing your short term rental income potential. Let's dive into the specifics.
Key Zedelgem Airbnb Performance Metrics Overview
Monthly Airbnb Revenue Variations & Income Potential in Zedelgem (2025)
Understanding the monthly revenue variations for Airbnb listings in Zedelgem is key to maximizing your short term rental income potential. Seasonality significantly impacts earnings. Our analysis, based on data from the past 12 months, shows that the peak revenue month for STRs in Zedelgem is typically August, while November often presents the lowest earnings, highlighting opportunities for strategic pricing adjustments during shoulder and low seasons. Explore the typical Airbnb income in Zedelgem across different performance tiers:
- Best-in-class properties (Top 10%) achieve $8,998+ monthly, often utilizing dynamic pricing and superior guest experiences.
- Strong performing properties (Top 25%) earn $3,650 or more, indicating effective management and desirable locations/amenities.
- Typical properties (Median) generate around $2,051 per month, representing the average market performance.
- Entry-level properties (Bottom 25%) see earnings around $1,277, often with potential for optimization.
Average Monthly Airbnb Earnings Trend in Zedelgem
Zedelgem Airbnb Occupancy Rate Trends (2025)
Maximize your bookings by understanding the Zedelgem STR occupancy trends. Seasonal demand shifts significantly influence how often properties are booked. Typically, Augustsees the highest demand (peak season occupancy), while November experiences the lowest (low season). Effective strategies, like adjusting minimum stays or offering promotions, can boost occupancy during slower periods. Here's how different property tiers perform in Zedelgem:
- Best-in-class properties (Top 10%) achieve 80%+ occupancy, indicating high desirability and potentially optimized availability.
- Strong performing properties (Top 25%) maintain 66% or higher occupancy, suggesting good market fit and guest satisfaction.
- Typical properties (Median) have an occupancy rate around 45%.
- Entry-level properties (Bottom 25%) average 26% occupancy, potentially facing higher vacancy.
Average Monthly Occupancy Rate Trend in Zedelgem
Average Daily Rate (ADR) Airbnb Trends in Zedelgem (2025)
Effective short term rental pricing strategy in Zedelgem involves understanding monthly ADR fluctuations. The Average Daily Rate (ADR) for Airbnb in Zedelgem typically peaks in August and dips lowest during February. Leveraging Airbnb dynamic pricing tools or strategies based on this seasonality can significantly boost revenue. Here's a look at the typical nightly rates achieved:
- Best-in-class properties (Top 10%) command rates of $650+ per night, often due to premium features or locations.
- Strong performing properties (Top 25%) achieve nightly rates of $251 or more.
- Typical properties (Median) charge around $126 per night.
- Entry-level properties (Bottom 25%) earn around $97 per night.
Average Daily Rate (ADR) Trend by Month in Zedelgem
Get Live Zedelgem Market Intelligence 👇

Explore Real-time Analytics
Airbnb Seasonality Analysis & Trends in Zedelgem (2025)
Peak Season (August, July, April)
- Revenue averages $4,558 per month
- Occupancy rates average 62.0%
- Daily rates average $252
Shoulder Season
- Revenue averages $3,465 per month
- Occupancy maintains around 44.6%
- Daily rates hold near $240
Low Season (February, June, November)
- Revenue drops to average $2,647 per month
- Occupancy decreases to average 38.5%
- Daily rates adjust to average $236
Seasonality Insights for Zedelgem
- The Airbnb seasonality in Zedelgem shows highly seasonal trends requiring careful strategy. While the sections above show seasonal averages, it's also insightful to look at the extremes:
- During the high season, the absolute peak month showcases Zedelgem's highest earning potential, with monthly revenues capable of climbing to $5,107, occupancy reaching a high of 70.3%, and ADRs peaking at $263.
- Conversely, the slowest single month of the year, typically falling within the low season, marks the market's lowest point. In this month, revenue might dip to $2,193, occupancy could drop to 33.9%, and ADRs may adjust down to $223.
- Understanding both the seasonal averages and these monthly peaks and troughs in revenue, occupancy, and ADR is crucial for maximizing your Airbnb profit potential in Zedelgem.
Seasonal Strategies for Maximizing Profit
- Peak Season: Maximize revenue through premium pricing and potentially longer minimum stays. Ensure high availability.
- Low Season: Offer competitive pricing, special promotions (e.g., extended stay discounts), and flexible cancellation policies. Target off-season travelers like remote workers or budget-conscious guests.
- Shoulder Seasons: Implement dynamic pricing that balances peak and low rates. Target weekend travelers or specific events. Offer slightly more flexible terms than peak season.
- Regularly analyze your own performance against these Zedelgem seasonality benchmarks and adjust your pricing and availability strategy accordingly.
Best Areas for Airbnb Investment in Zedelgem (2025)
Exploring the top neighborhoods for short-term rentals in Zedelgem? This section highlights key areas, outlining why they are attractive for hosts and guests, along with notable local attractions. Consider these locations based on your target guest profile and investment strategy.
| Neighborhood / Area | Why Host Here? (Target Guests & Appeal) | Key Attractions & Landmarks |
|---|---|---|
| Zedelgem Center | The charming heart of Zedelgem, featuring local shops, cafes, and easy access to transportation. Ideal for families and couples looking for a peaceful getaway close to amenities. | Zedelgem Village, Local Markets, St. Joseph's Church, Nearby parks |
| Wijnendale Castle | A historic site offering beautiful surroundings and a peek into Belgian history. Attracts history buffs and those who appreciate picturesque landscapes. | Wijnendale Castle, Castle grounds, Nature walks |
| Loppem | A quaint village known for its castle and serene environment. Perfect for visitors who want a quiet retreat with historical significance. | Kasteel Loppem, Loppem Park, Nearby cycling routes |
| Bruges proximity | Located just a short drive away from the famous medieval city of Bruges. Great for tourists wanting to explore this UNESCO World Heritage site without staying in the busy city center. | Bruges Market Square, Belfry of Bruges, Canals of Bruges, Musea Brugge |
| Oostkamp | Nearby town offering a mix of rural charm and city conveniences. Suitable for those looking to enjoy both nature and urban amenities. | Park of Oostkamp, Local cafes, Bike trails |
| Ichtegem | A peaceful market town surrounded by scenic countryside, ideal for guests seeking a retreat in nature. Attracts nature lovers and families. | Historic center, Local farms, Cycling paths |
| Torhout | Lively town with historical significance, known for its festivals and local culture. Appeals to tourists looking to immerse themselves in local traditions. | Castle of Loppem, Local festivals, Nearby nature reserves |
| Risquons Tout Park | A lovely nearby park in an open natural setting, offering outdoor activities. Attracts families and nature enthusiasts looking for recreational spaces. | Play areas, Walking trails, Picnic spots |
Understanding Airbnb License Requirements & STR Laws in Zedelgem (2025)
While Zedelgem, West Flanders, Belgium currently shows low STR regulations, specific Airbnb license requirements might still exist or change. Always verify the latest short term rental regulations and Airbnb license requirements directly with local government authorities for Zedelgem to ensure full compliance before hosting.
(Source: AirROI data, 2025, finding no licensed listings among those analyzed)
Top Performing Airbnb Properties in Zedelgem (2025)
Benchmark your potential! Explore examples of top-performing Airbnb properties in Zedelgembased on Trailing Twelve Month (TTM) revenue. Analyze their characteristics, revenue, occupancy rate, and ADR to understand what drives success in this market.
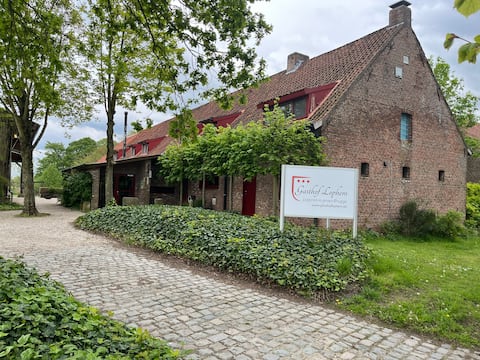
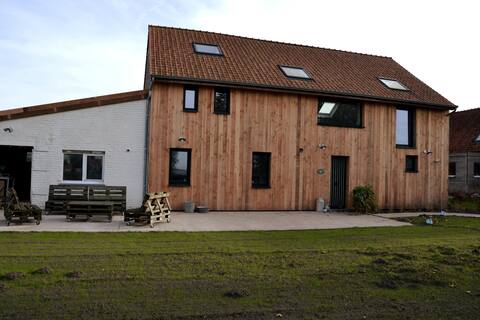
House Lapon, in a green area, on the outskirts of Bruges
Entire Place • 16 bedrooms
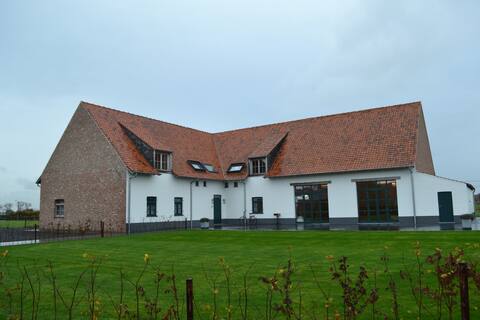
Vacation home Allegambe's Goed - Weekend
Entire Place • 8 bedrooms
Holiday home Hanna Zedelgem
Entire Place • 6 bedrooms
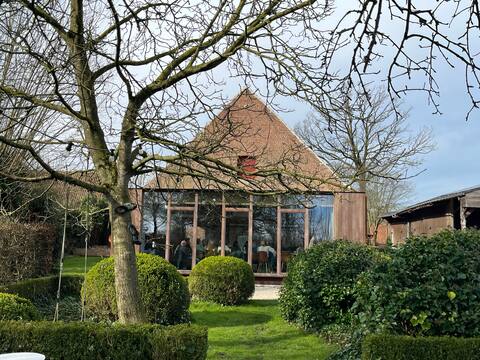
House Pieter, in a green area, on the outskirts of Bruges
Entire Place • 8 bedrooms
Apartment for 10 people
Entire Place • 4 bedrooms
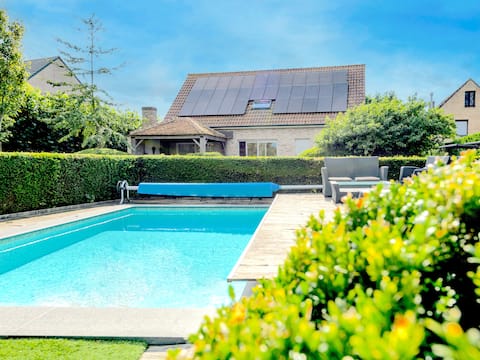
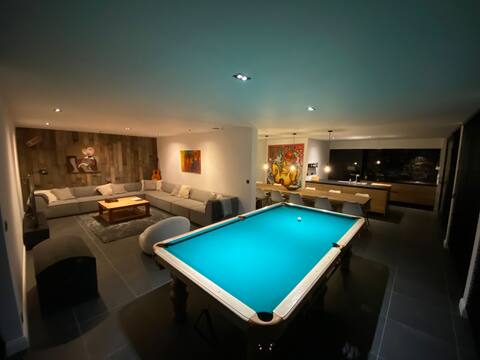
Luxury villa with heated pool and large garden
Entire Place • 4 bedrooms
Note: Performance varies based on location, size, amenities, seasonality, and management quality. Data reflects the past 12 months.
Top Performing Airbnb Hosts in Zedelgem (2025)
Learn from the best! This table showcases top-performing Airbnb hosts in Zedelgem based on the number of properties managed and estimated total revenue over the past year. Analyze their scale and performance metrics.
| Host Name | Properties | Grossing Revenue | Stay Reviews | Avg Rating |
|---|---|---|---|---|
| Nele | 3 | $291,563 | 172 | 4.93/5.0 |
| Cis | 2 | $195,283 | 13 | 5.00/5.0 |
| Ines | 3 | $129,565 | 123 | 4.97/5.0 |
| Chris | 1 | $124,598 | 24 | 5.00/5.0 |
| Pieter | 3 | $67,064 | 230 | 4.87/5.0 |
| Sybrand | 1 | $61,591 | 13 | 4.77/5.0 |
| Aurelie | 2 | $60,404 | 454 | 4.88/5.0 |
| Sally | 1 | $57,928 | 27 | 4.70/5.0 |
| Anna From HUSWELL | 1 | $41,165 | 19 | 4.79/5.0 |
| Katrien | 1 | $38,989 | 120 | 4.98/5.0 |
Analyzing the strategies of top hosts, such as their property selection, pricing, and guest communication, can offer valuable lessons for optimizing your own Airbnb operations in Zedelgem.
Dive Deeper: Advanced Zedelgem STR Market Data (2025)
Ready to unlock more insights? AirROI provides access to advanced metrics and comprehensive Airbnb data for Zedelgem. Explore detailed analytics beyond this report to refine your investment strategy, optimize pricing, and maximize your vacation rental profits.
Explore Advanced MetricsZedelgem Short-Term Rental Market Composition (2025): Property & Room Types
Room Type Distribution
Property Type Distribution
Market Composition Insights for Zedelgem
- The Zedelgem Airbnb market composition is heavily skewed towards Entire Home/Apt listings, which make up 67.4% of the 43 active rentals. This indicates strong guest preference for privacy and space.
- However, a notable 30.2% share for Private Rooms suggests opportunities for budget-conscious travelers or hosts renting out spare rooms.
- Looking at the property type distribution in Zedelgem, House properties are the most common (32.6%), reflecting the local real estate landscape.
- Houses represent a significant 32.6% portion, catering likely to families or larger groups.
- The presence of 25.6% Hotel/Boutique listings indicates integration with traditional hospitality.
- Smaller segments like others (combined 4.7%) offer potential for unique stay experiences.
Zedelgem Airbnb Room Capacity Analysis (2025): Bedroom Distribution
Distribution of Listings by Number of Bedrooms
Room Capacity Insights for Zedelgem
- The dominant room capacity in Zedelgem is 1 bedroom listings, making up 46.5% of the market. This suggests a strong demand for properties suitable for couples or solo travelers.
- Together, 1 bedroom and 5+ bedrooms properties represent 65.1% of the active Airbnb listings in Zedelgem, indicating a high concentration in these sizes.
- A significant 32.6% of listings offer 3+ bedrooms, catering to larger groups and families seeking more space in Zedelgem.
Zedelgem Vacation Rental Guest Capacity Trends (2025)
Distribution of Listings by Guest Capacity
Guest Capacity Insights for Zedelgem
- The most common guest capacity trend in Zedelgem vacation rentals is listings accommodating 8+ guests (32.6%). This suggests the primary traveler segment is likely larger groups.
- Properties designed for 8+ guests and 2 guests dominate the Zedelgem STR market, accounting for 58.2% of listings.
- 34.9% of properties accommodate 6+ guests, serving the market segment for larger families or group travel in Zedelgem.
- On average, properties in Zedelgem are equipped to host 4.5 guests.
Zedelgem Airbnb Booking Patterns (2025): Available vs. Booked Days
Available Days Distribution
Booked Days Distribution
Booking Pattern Insights for Zedelgem
- The most common availability pattern in Zedelgem falls within the 181-270 days range, representing 41.9% of listings. This suggests many properties have significant open periods on their calendars.
- Approximately 74.5% of listings show high availability (181+ days open annually), indicating potential for increased bookings or specific owner usage patterns.
- For booked days, the 91-180 days range is most frequent in Zedelgem (44.2%), reflecting common guest stay durations or potential owner blocking patterns.
- A notable 27.9% of properties secure long booking periods (181+ days booked per year), highlighting successful long-term rental strategies or significant owner usage.
Zedelgem Airbnb Minimum Stay Requirements Analysis
Distribution of Listings by Minimum Night Requirement
1 Night
17 listings
40.5% of total
2 Nights
14 listings
33.3% of total
3 Nights
2 listings
4.8% of total
4-6 Nights
1 listings
2.4% of total
30+ Nights
8 listings
19% of total
Key Insights
- The most prevalent minimum stay requirement in Zedelgem is 1 Night, adopted by 40.5% of listings. This highlights the market's preference for shorter, flexible bookings.
- A strong majority (73.8%) of the Zedelgem Airbnb data shows acceptance of very short stays (1-2 nights), indicating a dynamic, high-turnover market.
- A significant segment (19%) caters to monthly stays (30+ nights) in Zedelgem, pointing to opportunities in the extended-stay market.
Recommendations
- Align with the market by considering a 1 Night minimum stay, as 40.5% of Zedelgem hosts use this setting.
- Explore offering discounts for stays of 30+ nights to attract the 19% of the market seeking extended stays.
- Adjust minimum nights based on seasonality – potentially shorter during low season and longer during peak demand periods in Zedelgem.
Zedelgem Airbnb Cancellation Policy Trends Analysis (2025)
Super Strict 30 Days
1 listings
2.4% of total
Limited
1 listings
2.4% of total
Flexible
10 listings
23.8% of total
Moderate
16 listings
38.1% of total
Firm
9 listings
21.4% of total
Strict
5 listings
11.9% of total
Cancellation Policy Insights for Zedelgem
- The prevailing Airbnb cancellation policy trend in Zedelgem is Moderate, used by 38.1% of listings.
- There's a relatively balanced mix between guest-friendly (61.9%) and stricter (33.3%) policies, offering choices for different guest needs.
Recommendations for Hosts
- Consider adopting a Moderate policy to align with the 38.1% market standard in Zedelgem.
- Using a Strict policy might deter some guests, as only 11.9% of listings use it. Evaluate if potential revenue protection outweighs possible lower booking rates.
- Regularly review your cancellation policy against competitors and market demand shifts in Zedelgem.
Zedelgem STR Booking Lead Time Analysis (2025)
Average Booking Lead Time by Month
Booking Lead Time Insights for Zedelgem
- The overall average booking lead time for vacation rentals in Zedelgem is 79 days.
- Guests book furthest in advance for stays during August (average 97 days), likely coinciding with peak travel demand or local events.
- The shortest booking windows occur for stays in March (average 60 days), indicating more last-minute travel plans during this time.
- Seasonally, Summer (94 days avg.) sees the longest lead times, while Winter (71 days avg.) has the shortest, reflecting typical travel planning cycles.
Recommendations for Hosts
- Use the overall average lead time (79 days) as a baseline for your pricing and availability strategy in Zedelgem.
- For August stays, consider implementing length-of-stay discounts or slightly higher rates for bookings made less than 97 days out to capitalize on advance planning.
- Target marketing efforts for the Summer season well in advance (at least 94 days) to capture early planners.
- Monitor your own booking lead times against these Zedelgem averages to identify opportunities for dynamic pricing adjustments.
Popular & Essential Airbnb Amenities in Zedelgem (2025)
Amenity Prevalence
Amenity Insights for Zedelgem
- Essential amenities in Zedelgem that guests expect include: Wifi. Lacking these (this) could significantly impact bookings.
- Popular amenities like Heating, Hot water, Smoke alarm are common but not universal. Offering these can provide a competitive edge.
Recommendations for Hosts
- Ensure your listing includes all essential amenities for Zedelgem: Wifi.
- Prioritize adding missing essentials: Wifi.
- Consider adding popular differentiators like Heating or Hot water to increase appeal.
- Highlight unique or less common amenities you offer (e.g., hot tub, dedicated workspace, EV charger) in your listing description and photos.
- Regularly check competitor amenities in Zedelgem to stay competitive.
Zedelgem Airbnb Guest Demographics & Profile Analysis (2025)
Guest Profile Summary for Zedelgem
- The typical guest profile for Airbnb in Zedelgem consists of predominantly international visitors (85%), with top international origins including United Kingdom, typically belonging to the Post-2000s (Gen Z/Alpha) group (50%), primarily speaking English or French.
- Domestic travelers account for 14.8% of guests.
- Key international markets include France (24.6%) and United Kingdom (21%).
- Top languages spoken are English (40.3%) followed by French (19.8%).
- A significant demographic segment is the Post-2000s (Gen Z/Alpha) group, representing 50% of guests.
Recommendations for Hosts
- Focus marketing internationally, particularly towards travelers from United Kingdom.
- Tailor amenities and listing descriptions to appeal to the dominant Post-2000s (Gen Z/Alpha) demographic (e.g., highlight fast WiFi, smart home features, local guides).
- Highlight unique local experiences or amenities relevant to the primary guest profile.
- Consider seasonal promotions aligned with peak travel times for key origin markets.
Nearby Short-Term Rental Market Comparison
How does the Zedelgem Airbnb market stack up against its neighbors? Compare key performance metrics like average monthly revenue, ADR, and occupancy rates in surrounding areas to understand the broader regional STR landscape.
| Market | Active Properties | Monthly Revenue | Daily Rate | Avg. Occupancy |
|---|---|---|---|---|
| Raamsdonksveer | 15 | $8,168 | $763.87 | 41% |
| Kockengen | 12 | $6,659 | $474.07 | 55% |
| Lo-Reninge | 13 | $6,374 | $463.83 | 44% |
| Mont-de-l'Enclus | 11 | $6,158 | $383.23 | 38% |
| Merksplas | 12 | $5,498 | $374.43 | 42% |
| Bentveld | 13 | $4,922 | $455.16 | 51% |
| Anzegem | 10 | $4,649 | $463.76 | 37% |
| Oud Ade | 17 | $4,595 | $293.49 | 54% |
| Zerkegem | 10 | $4,556 | $444.32 | 54% |
| Wormer | 10 | $4,518 | $235.34 | 63% |