Ypres Airbnb Market Analysis 2026: Short Term Rental Data & Vacation Rental Statistics in West Flanders, Belgium
Is Airbnb profitable in Ypres in 2026? Explore comprehensive Airbnb analytics for Ypres, West Flanders, Belgium to uncover income potential. This 2026 STR market report for Ypres, based on AirROI data from February 2025 to January 2026, reveals key trends in the niche market of 93 active listings.
Whether you're considering an Airbnb investment in Ypres, optimizing your existing vacation rental, or exploring rental arbitrage opportunities, understanding the Ypres Airbnb data is crucial. Leveraging the low regulation environment is key to maximizing your short term rental income potential. Let's dive into the specifics.
Key Ypres Airbnb Performance Metrics Overview
Monthly Airbnb Revenue Variations & Income Potential in Ypres (2026)
Understanding the monthly revenue variations for Airbnb listings in Ypres is key to maximizing your short term rental income potential. Seasonality significantly impacts earnings. Our analysis, based on data from the past 12 months, shows that the peak revenue month for STRs in Ypres is typically July, while January often presents the lowest earnings, highlighting opportunities for strategic pricing adjustments during shoulder and low seasons. Explore the typical Airbnb income in Ypres across different performance tiers:
- Best-in-class properties (Top 10%) achieve $6,472+ monthly, often utilizing dynamic pricing and superior guest experiences.
- Strong performing properties (Top 25%) earn $4,077 or more, indicating effective management and desirable locations/amenities.
- Typical properties (Median) generate around $2,524 per month, representing the average market performance.
- Entry-level properties (Bottom 25%) see earnings around $1,309, often with potential for optimization.
Average Monthly Airbnb Earnings Trend in Ypres
Ypres Airbnb Occupancy Rate Trends (2026)
Maximize your bookings by understanding the Ypres STR occupancy trends. Seasonal demand shifts significantly influence how often properties are booked. Typically, Julysees the highest demand (peak season occupancy), while January experiences the lowest (low season). Effective strategies, like adjusting minimum stays or offering promotions, can boost occupancy during slower periods. Here's how different property tiers perform in Ypres:
- Best-in-class properties (Top 10%) achieve 73%+ occupancy, indicating high desirability and potentially optimized availability.
- Strong performing properties (Top 25%) maintain 56% or higher occupancy, suggesting good market fit and guest satisfaction.
- Typical properties (Median) have an occupancy rate around 35%.
- Entry-level properties (Bottom 25%) average 20% occupancy, potentially facing higher vacancy.
Average Monthly Occupancy Rate Trend in Ypres
Average Daily Rate (ADR) Airbnb Trends in Ypres (2026)
Effective short term rental pricing strategy in Ypres involves understanding monthly ADR fluctuations. The Average Daily Rate (ADR) for Airbnb in Ypres typically peaks in December and dips lowest during February. Leveraging Airbnb dynamic pricing tools or strategies based on this seasonality can significantly boost revenue. Here's a look at the typical nightly rates achieved:
- Best-in-class properties (Top 10%) command rates of $479+ per night, often due to premium features or locations.
- Strong performing properties (Top 25%) achieve nightly rates of $313 or more.
- Typical properties (Median) charge around $199 per night.
- Entry-level properties (Bottom 25%) earn around $144 per night.
Average Daily Rate (ADR) Trend by Month in Ypres
Get Live Ypres Market Intelligence 👇

Explore Real-time Analytics
Airbnb Seasonality Analysis & Trends in Ypres (2026)
Peak Season (July, August, October)
- Revenue averages $3,808 per month
- Occupancy rates average 44.4%
- Daily rates average $261
Shoulder Season
- Revenue averages $3,402 per month
- Occupancy maintains around 40.6%
- Daily rates hold near $262
Low Season (January, February, March)
- Revenue drops to average $2,483 per month
- Occupancy decreases to average 29.6%
- Daily rates adjust to average $249
Seasonality Insights for Ypres
- The Airbnb seasonality in Ypres shows moderate seasonality with distinct peak and low periods. While the sections above show seasonal averages, it's also insightful to look at the extremes:
- During the high season, the absolute peak month showcases Ypres's highest earning potential, with monthly revenues capable of climbing to $3,915, occupancy reaching a high of 48.0%, and ADRs peaking at $279.
- Conversely, the slowest single month of the year, typically falling within the low season, marks the market's lowest point. In this month, revenue might dip to $2,134, occupancy could drop to 22.6%, and ADRs may adjust down to $235.
- Understanding both the seasonal averages and these monthly peaks and troughs in revenue, occupancy, and ADR is crucial for maximizing your Airbnb profit potential in Ypres.
Seasonal Strategies for Maximizing Profit
- Peak Season: Maximize revenue through premium pricing and potentially longer minimum stays. Ensure high availability.
- Low Season: Offer competitive pricing, special promotions (e.g., extended stay discounts), and flexible cancellation policies. Target off-season travelers like remote workers or budget-conscious guests.
- Shoulder Seasons: Implement dynamic pricing that balances peak and low rates. Target weekend travelers or specific events. Offer slightly more flexible terms than peak season.
- Regularly analyze your own performance against these Ypres seasonality benchmarks and adjust your pricing and availability strategy accordingly.
Best Areas for Airbnb Investment in Ypres (2026)
Exploring the top neighborhoods for short-term rentals in Ypres? This section highlights key areas, outlining why they are attractive for hosts and guests, along with notable local attractions. Consider these locations based on your target guest profile and investment strategy.
| Neighborhood / Area | Why Host Here? (Target Guests & Appeal) | Key Attractions & Landmarks |
|---|---|---|
| Ypres City Center | The historical heart of Ypres, known for its beautiful architecture and charming market square. It attracts tourists interested in World War I history and local culture, making it an ideal area for Airbnb. | Menin Gate Memorial, Ypres Cloth Hall, In Flanders Fields Museum, Market Square, St. George's Memorial Church |
| Zonnebeke | Located just outside Ypres, Zonnebeke is home to significant WWI memorial sites and cemeteries. A great location for those wanting to explore the battlefield history while enjoying a peaceful environment. | Passchendaele Memorial Park, Tyne Cot Cemetery, Zonnebeke Château, Flanders Fields Museum |
| Langemark | Another area rich in World War I history, Langemark offers unique cultural experiences and is less touristy, attracting niche visitors interested in memorials and the war's impact. | German War Cemetery, Langemark-Poelkapelle Historical Site, Langemark Church |
| Wieltje | A small village near Ypres known for its WWI history and countryside charm. Offers a tranquil retreat for guests looking for a quieter stay near historical sites. | Wieltje Cemetery, Battlefield Tours, Trench Systems |
| Ieperlee | Located alongside the river, Ieperlee provides scenic views and opportunities for outdoor activities, appealing to nature-loving tourists and those who appreciate quiet relaxation. | Ieperlee River, Walking and cycling paths, Parks and Green Areas |
| Dikkebus | This area is known for its historical significance during the war and offers a rural setting, perfect for guests looking to escape the hustle and bustle and explore the scenic West Flanders countryside. | Dikkebus Church, Historical Battlefields, Nature reserves |
| Hollebeke | Hollebeke is famous for its connections to the war, and is a peaceful area for guests who want to explore local history and memorials without the crowds. | Hollebeke Battlefield, Local Memorials, Countryside Trails |
| Zillebeke | A picturesque village that is closely linked to the battles of WWI, Zillebeke attracts history enthusiasts who want to experience the rural charm of West Flanders with historical significance. | Zillebeke Lake, Local Historical Sites, Scenic Walks |
Understanding Airbnb License Requirements & STR Laws in Ypres (2026)
While Ypres, West Flanders, Belgium currently shows low STR regulations, specific Airbnb license requirements might still exist or change. Always verify the latest short term rental regulations and Airbnb license requirements directly with local government authorities for Ypres to ensure full compliance before hosting.
(Source: AirROI data, 2026, finding no licensed listings among those analyzed)
Top Performing Airbnb Properties in Ypres (2026)
Benchmark your potential! Explore examples of top-performing Airbnb properties in Ypresbased on Trailing Twelve Month (TTM) revenue. Analyze their characteristics, revenue, occupancy rate, and ADR to understand what drives success in this market.
Vacation home Hoeve C
Entire Place • 3 bedrooms
Apartment on the market of Ypres (max. 10 pers.)
Entire Place • 5 bedrooms

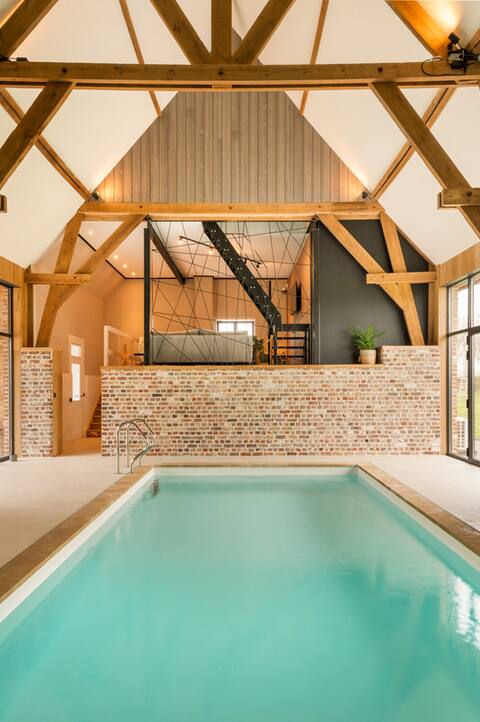
Luxury home between the fields with hot tub (winter)
Entire Place • 4 bedrooms
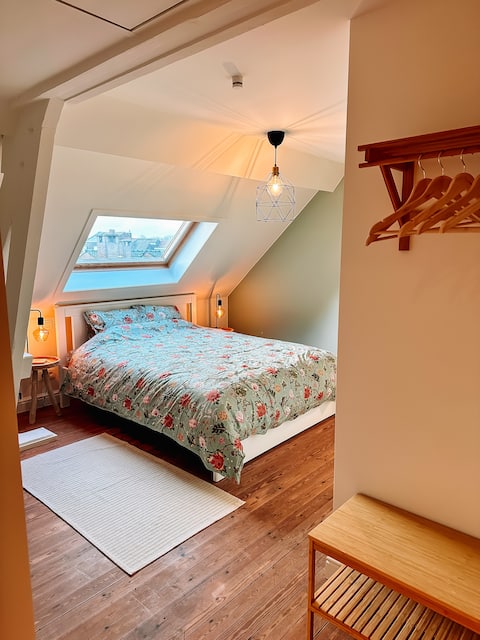
Maison Madeleine, pure comfort in the center of Ypres
Entire Place • 5 bedrooms

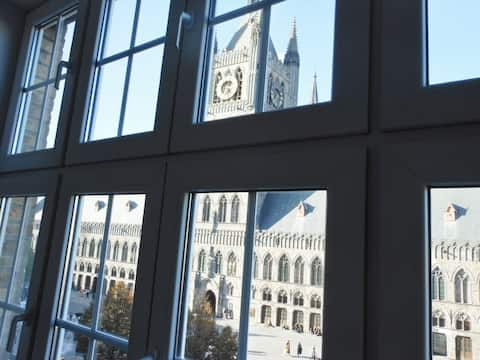
Villa Ernest 5* holiday home in historic centre.
Entire Place • 3 bedrooms

Maison Remy, a charming house with a spacious courtyard
Entire Place • 3 bedrooms
Note: Performance varies based on location, size, amenities, seasonality, and management quality. Data reflects the past 12 months.
Top Performing Airbnb Hosts in Ypres (2026)
Learn from the best! This table showcases top-performing Airbnb hosts in Ypres based on the number of properties managed and estimated total revenue over the past year. Analyze their scale and performance metrics.
| Host Name | Properties | Grossing Revenue | Stay Reviews | Avg Rating |
|---|---|---|---|---|
| Din | 3 | $205,224 | 44 | 4.89/5.0 |
| Jolien | 1 | $195,958 | 15 | 5.00/5.0 |
| Evelyne | 1 | $122,746 | 49 | 4.94/5.0 |
| Sofie | 1 | $113,008 | 12 | 5.00/5.0 |
| Carmen | 1 | $103,286 | 93 | 4.99/5.0 |
| Steven | 2 | $93,358 | 58 | 5.00/5.0 |
| Anna From HUSWELL | 5 | $93,183 | 35 | 4.33/5.0 |
| Giovanni | 1 | $76,498 | 33 | 4.97/5.0 |
| Ann | 2 | $71,484 | 396 | 4.84/5.0 |
| Thomas | 1 | $70,973 | 42 | 4.98/5.0 |
Analyzing the strategies of top hosts, such as their property selection, pricing, and guest communication, can offer valuable lessons for optimizing your own Airbnb operations in Ypres.
Dive Deeper: Advanced Ypres STR Market Data (2026)
Ready to unlock more insights? AirROI provides access to advanced metrics and comprehensive Airbnb data for Ypres. Explore detailed analytics beyond this report to refine your investment strategy, optimize pricing, and maximize your vacation rental profits.
Explore Advanced MetricsYpres Short-Term Rental Market Composition (2026): Property & Room Types
Room Type Distribution
Property Type Distribution
Market Composition Insights for Ypres
- The Ypres Airbnb market composition is heavily skewed towards Entire Home/Apt listings, which make up 89.2% of the 93 active rentals. This indicates strong guest preference for privacy and space.
- Looking at the property type distribution in Ypres, House properties are the most common (54.8%), reflecting the local real estate landscape.
- Houses represent a significant 54.8% portion, catering likely to families or larger groups.
- The presence of 10.8% Hotel/Boutique listings indicates integration with traditional hospitality.
- Smaller segments like outdoor/unique, others (combined 4.3%) offer potential for unique stay experiences.
Ypres Airbnb Room Capacity Analysis (2026): Bedroom Distribution
Distribution of Listings by Number of Bedrooms
Room Capacity Insights for Ypres
- The dominant room capacity in Ypres is 3 bedrooms listings, making up 25.8% of the market. This suggests a strong demand for properties suitable for families or small groups.
- Together, 3 bedrooms and 2 bedrooms properties represent 49.5% of the active Airbnb listings in Ypres, indicating a high concentration in these sizes.
- A significant 48.4% of listings offer 3+ bedrooms, catering to larger groups and families seeking more space in Ypres.
Ypres Vacation Rental Guest Capacity Trends (2026)
Distribution of Listings by Guest Capacity
Guest Capacity Insights for Ypres
- The most common guest capacity trend in Ypres vacation rentals is listings accommodating 8+ guests (29%). This suggests the primary traveler segment is likely larger groups.
- Properties designed for 8+ guests and 4 guests dominate the Ypres STR market, accounting for 52.7% of listings.
- 52.7% of properties accommodate 6+ guests, serving the market segment for larger families or group travel in Ypres.
- On average, properties in Ypres are equipped to host 5.1 guests.
Ypres Airbnb Booking Patterns (2026): Available vs. Booked Days
Available Days Distribution
Booked Days Distribution
Booking Pattern Insights for Ypres
- The most common availability pattern in Ypres falls within the 271-366 days range, representing 47.3% of listings. This suggests many properties have significant open periods on their calendars.
- Approximately 79.6% of listings show high availability (181+ days open annually), indicating potential for increased bookings or specific owner usage patterns.
- For booked days, the 31-90 days range is most frequent in Ypres (35.5%), reflecting common guest stay durations or potential owner blocking patterns.
- A notable 20.5% of properties secure long booking periods (181+ days booked per year), highlighting successful long-term rental strategies or significant owner usage.
Ypres Airbnb Minimum Stay Requirements Analysis
Distribution of Listings by Minimum Night Requirement
1 Night
22 listings
23.7% of total
2 Nights
39 listings
41.9% of total
3 Nights
6 listings
6.5% of total
30+ Nights
26 listings
28% of total
Key Insights
- The most prevalent minimum stay requirement in Ypres is 2 Nights, adopted by 41.9% of listings. This highlights the market's preference for shorter, flexible bookings.
- A strong majority (65.6%) of the Ypres Airbnb data shows acceptance of very short stays (1-2 nights), indicating a dynamic, high-turnover market.
- A significant segment (28%) caters to monthly stays (30+ nights) in Ypres, pointing to opportunities in the extended-stay market.
Recommendations
- Align with the market by considering a 2 Nights minimum stay, as 41.9% of Ypres hosts use this setting.
- If feasible, allowing 1-night stays, especially midweek or during low season, could capture last-minute bookings, as only 23.7% currently do.
- Explore offering discounts for stays of 30+ nights to attract the 28% of the market seeking extended stays.
- Adjust minimum nights based on seasonality – potentially shorter during low season and longer during peak demand periods in Ypres.
Ypres Airbnb Cancellation Policy Trends Analysis (2026)
Super Strict 60 Days
3 listings
3.2% of total
Super Strict 30 Days
2 listings
2.2% of total
Flexible
20 listings
21.5% of total
Moderate
30 listings
32.3% of total
Firm
31 listings
33.3% of total
Strict
7 listings
7.5% of total
Cancellation Policy Insights for Ypres
- The prevailing Airbnb cancellation policy trend in Ypres is Firm, used by 33.3% of listings.
- There's a relatively balanced mix between guest-friendly (53.8%) and stricter (40.8%) policies, offering choices for different guest needs.
- Strict cancellation policies are quite rare (7.5%), potentially making listings with this policy less competitive unless justified by high demand or property type.
Recommendations for Hosts
- Consider adopting a Firm policy to align with the 33.3% market standard in Ypres.
- Using a Strict policy might deter some guests, as only 7.5% of listings use it. Evaluate if potential revenue protection outweighs possible lower booking rates.
- Regularly review your cancellation policy against competitors and market demand shifts in Ypres.
Ypres STR Booking Lead Time Analysis (2026)
Average Booking Lead Time by Month
Booking Lead Time Insights for Ypres
- The overall average booking lead time for vacation rentals in Ypres is 76 days.
- Guests book furthest in advance for stays during May (average 98 days), likely coinciding with peak travel demand or local events.
- The shortest booking windows occur for stays in February (average 42 days), indicating more last-minute travel plans during this time.
- Seasonally, Fall (88 days avg.) sees the longest lead times, while Winter (53 days avg.) has the shortest, reflecting typical travel planning cycles.
Recommendations for Hosts
- Use the overall average lead time (76 days) as a baseline for your pricing and availability strategy in Ypres.
- For May stays, consider implementing length-of-stay discounts or slightly higher rates for bookings made less than 98 days out to capitalize on advance planning.
- Target marketing efforts for the Fall season well in advance (at least 88 days) to capture early planners.
- Monitor your own booking lead times against these Ypres averages to identify opportunities for dynamic pricing adjustments.
Popular & Essential Airbnb Amenities in Ypres (2026)
Amenity Prevalence
Amenity Insights for Ypres
- Essential amenities in Ypres that guests expect include: Wifi, TV. Lacking these (any) could significantly impact bookings.
- Popular amenities like Smoke alarm, Kitchen, Heating are common but not universal. Offering these can provide a competitive edge.
Recommendations for Hosts
- Ensure your listing includes all essential amenities for Ypres: Wifi, TV.
- Prioritize adding missing essentials: TV.
- Consider adding popular differentiators like Smoke alarm or Kitchen to increase appeal.
- Highlight unique or less common amenities you offer (e.g., hot tub, dedicated workspace, EV charger) in your listing description and photos.
- Regularly check competitor amenities in Ypres to stay competitive.
Ypres Airbnb Guest Demographics & Profile Analysis (2026)
Guest Profile Summary for Ypres
- The typical guest profile for Airbnb in Ypres consists of predominantly international visitors (86%), with top international origins including Belgium, typically belonging to the Post-2000s (Gen Z/Alpha) group (50%), primarily speaking English or French.
- Domestic travelers account for 13.6% of guests.
- Key international markets include United Kingdom (51.8%) and Belgium (13.6%).
- Top languages spoken are English (51.8%) followed by French (16.6%).
- A significant demographic segment is the Post-2000s (Gen Z/Alpha) group, representing 50% of guests.
Recommendations for Hosts
- Focus marketing internationally, particularly towards travelers from Belgium.
- Tailor amenities and listing descriptions to appeal to the dominant Post-2000s (Gen Z/Alpha) demographic (e.g., highlight fast WiFi, smart home features, local guides).
- Highlight unique local experiences or amenities relevant to the primary guest profile.
- Consider seasonal promotions aligned with peak travel times for key origin markets.
Nearby Short-Term Rental Market Comparison
How does the Ypres Airbnb market stack up against its neighbors? Compare key performance metrics like average monthly revenue, ADR, and occupancy rates in surrounding areas to understand the broader regional STR landscape.
| Market | Active Properties | Monthly Revenue | Daily Rate | Avg. Occupancy |
|---|---|---|---|---|
| Lo-Reninge | 13 | $5,989 | $454.03 | 42% |
| Mont-de-l'Enclus | 10 | $5,398 | $407.81 | 36% |
| Zerkegem | 10 | $4,846 | $437.72 | 57% |
| Anzegem | 10 | $4,425 | $460.61 | 35% |
| Dizy | 11 | $4,106 | $250.48 | 49% |
| Ronse - Renaix | 18 | $3,878 | $411.21 | 35% |
| Ellezelles | 15 | $3,752 | $277.86 | 44% |
| Rosoy-en-Multien | 15 | $3,680 | $347.93 | 47% |
| Kluisbergen | 19 | $3,524 | $394.17 | 36% |
| Beernem | 25 | $3,515 | $313.01 | 41% |