Ruddervoorde Airbnb Market Analysis 2026: Short Term Rental Data & Vacation Rental Statistics in West Flanders, Belgium
Is Airbnb profitable in Ruddervoorde in 2026? Explore comprehensive Airbnb analytics for Ruddervoorde, West Flanders, Belgium to uncover income potential. This 2026 STR market report for Ruddervoorde, based on AirROI data from February 2025 to January 2026, reveals key trends in the niche market of 21 active listings.
Whether you're considering an Airbnb investment in Ruddervoorde, optimizing your existing vacation rental, or exploring rental arbitrage opportunities, understanding the Ruddervoorde Airbnb data is crucial. Leveraging the low regulation environment is key to maximizing your short term rental income potential. Let's dive into the specifics.
Key Ruddervoorde Airbnb Performance Metrics Overview
Monthly Airbnb Revenue Variations & Income Potential in Ruddervoorde (2026)
Understanding the monthly revenue variations for Airbnb listings in Ruddervoorde is key to maximizing your short term rental income potential. Seasonality significantly impacts earnings. Our analysis, based on data from the past 12 months, shows that the peak revenue month for STRs in Ruddervoorde is typically December, while February often presents the lowest earnings, highlighting opportunities for strategic pricing adjustments during shoulder and low seasons. Explore the typical Airbnb income in Ruddervoorde across different performance tiers:
- Best-in-class properties (Top 10%) achieve $5,473+ monthly, often utilizing dynamic pricing and superior guest experiences.
- Strong performing properties (Top 25%) earn $3,316 or more, indicating effective management and desirable locations/amenities.
- Typical properties (Median) generate around $1,839 per month, representing the average market performance.
- Entry-level properties (Bottom 25%) see earnings around $1,055, often with potential for optimization.
Average Monthly Airbnb Earnings Trend in Ruddervoorde
Ruddervoorde Airbnb Occupancy Rate Trends (2026)
Maximize your bookings by understanding the Ruddervoorde STR occupancy trends. Seasonal demand shifts significantly influence how often properties are booked. Typically, Decembersees the highest demand (peak season occupancy), while January experiences the lowest (low season). Effective strategies, like adjusting minimum stays or offering promotions, can boost occupancy during slower periods. Here's how different property tiers perform in Ruddervoorde:
- Best-in-class properties (Top 10%) achieve 78%+ occupancy, indicating high desirability and potentially optimized availability.
- Strong performing properties (Top 25%) maintain 49% or higher occupancy, suggesting good market fit and guest satisfaction.
- Typical properties (Median) have an occupancy rate around 35%.
- Entry-level properties (Bottom 25%) average 20% occupancy, potentially facing higher vacancy.
Average Monthly Occupancy Rate Trend in Ruddervoorde
Average Daily Rate (ADR) Airbnb Trends in Ruddervoorde (2026)
Effective short term rental pricing strategy in Ruddervoorde involves understanding monthly ADR fluctuations. The Average Daily Rate (ADR) for Airbnb in Ruddervoorde typically peaks in December and dips lowest during February. Leveraging Airbnb dynamic pricing tools or strategies based on this seasonality can significantly boost revenue. Here's a look at the typical nightly rates achieved:
- Best-in-class properties (Top 10%) command rates of $330+ per night, often due to premium features or locations.
- Strong performing properties (Top 25%) achieve nightly rates of $217 or more.
- Typical properties (Median) charge around $152 per night.
- Entry-level properties (Bottom 25%) earn around $139 per night.
Average Daily Rate (ADR) Trend by Month in Ruddervoorde
Get Live Ruddervoorde Market Intelligence 👇

Explore Real-time Analytics
Airbnb Seasonality Analysis & Trends in Ruddervoorde (2026)
Peak Season (December, September, October)
- Revenue averages $3,745 per month
- Occupancy rates average 46.7%
- Daily rates average $203
Shoulder Season
- Revenue averages $2,225 per month
- Occupancy maintains around 39.0%
- Daily rates hold near $185
Low Season (January, February, April)
- Revenue drops to average $1,739 per month
- Occupancy decreases to average 31.0%
- Daily rates adjust to average $180
Seasonality Insights for Ruddervoorde
- The Airbnb seasonality in Ruddervoorde shows highly seasonal trends requiring careful strategy. While the sections above show seasonal averages, it's also insightful to look at the extremes:
- During the high season, the absolute peak month showcases Ruddervoorde's highest earning potential, with monthly revenues capable of climbing to $5,002, occupancy reaching a high of 52.3%, and ADRs peaking at $221.
- Conversely, the slowest single month of the year, typically falling within the low season, marks the market's lowest point. In this month, revenue might dip to $1,686, occupancy could drop to 20.3%, and ADRs may adjust down to $166.
- Understanding both the seasonal averages and these monthly peaks and troughs in revenue, occupancy, and ADR is crucial for maximizing your Airbnb profit potential in Ruddervoorde.
Seasonal Strategies for Maximizing Profit
- Peak Season: Maximize revenue through premium pricing and potentially longer minimum stays. Ensure high availability.
- Low Season: Offer competitive pricing, special promotions (e.g., extended stay discounts), and flexible cancellation policies. Target off-season travelers like remote workers or budget-conscious guests.
- Shoulder Seasons: Implement dynamic pricing that balances peak and low rates. Target weekend travelers or specific events. Offer slightly more flexible terms than peak season.
- Regularly analyze your own performance against these Ruddervoorde seasonality benchmarks and adjust your pricing and availability strategy accordingly.
Best Areas for Airbnb Investment in Ruddervoorde (2026)
Exploring the top neighborhoods for short-term rentals in Ruddervoorde? This section highlights key areas, outlining why they are attractive for hosts and guests, along with notable local attractions. Consider these locations based on your target guest profile and investment strategy.
| Neighborhood / Area | Why Host Here? (Target Guests & Appeal) | Key Attractions & Landmarks |
|---|---|---|
| Ruddervoorde Center | The heart of Ruddervoorde offers a charming village atmosphere with easy access to local shops and restaurants. It's ideal for travelers wanting a peaceful stay close to nature and local culture. | St. Peter's Church, Ruddervoorde Park, Local markets, Village festivals, Cycling routes |
| Nearby Bruges | A short drive from Ruddervoorde, Bruges is a UNESCO World Heritage site known for its medieval architecture and canals, attracting millions of tourists each year. | Bruges Historic Center, Belfry of Bruges, Canal Tours, Market Square, Basilica of the Holy Blood |
| Knokke-Heist | Considered one of the most upscale coastal destinations in Belgium, Knokke-Heist attracts beachgoers and luxury travelers looking for beautiful seaside experiences. | Knokke Beach, Zoute Golf Club, Royal Zoute Sporting Club, Shopping in Knokke, Art galleries |
| Oostende | A vibrant seaside city offering an array of beach activities, cultural events, and a lively nightlife, perfect for holidaymakers looking for a lively beachfront experience. | Oostende Beach, Fort Napoleon, Royal Gallery of Oostende, Mu.ZEE, Oostende's Casino |
| Ypres | Famous for its World War I history, Ypres attracts visitors interested in historical tourism and remembrance sites, making it ideal for hosting guests interested in history. | Menin Gate, In Flanders Fields Museum, Ypres Salient, Saint George's Memorial Church, Ramparts |
| Damme | Known for its picturesque scenery and medieval charm, Damme is a perfect spot for guests who enjoy biking and serene environments nearby Ruddervoorde’s nature. | Damme Canal, Biking trails, Historic buildings, Damme Book Town, Windmills |
| Roeselare | A growing town with a mix of modern development and traditional culture, Roeselare is an attractive option for visitors looking for convenient amenities and cultural experiences. | Roeselare City Park, Saint Michael's Church, Museum of Roeselare, Local breweries, Shopping streets |
| Tielt | A charming town known for its beautiful surroundings and friendly atmosphere, Tielt offers potential for visitors seeking a relaxed, welcoming experience near nature. | Tielt City Park, Historic City Center, Local events, Cycling paths, Market square |
Understanding Airbnb License Requirements & STR Laws in Ruddervoorde (2026)
While Ruddervoorde, West Flanders, Belgium currently shows low STR regulations, specific Airbnb license requirements might still exist or change. Always verify the latest short term rental regulations and Airbnb license requirements directly with local government authorities for Ruddervoorde to ensure full compliance before hosting.
(Source: AirROI data, 2026, finding no licensed listings among those analyzed)
Top Performing Airbnb Properties in Ruddervoorde (2026)
Benchmark your potential! Explore examples of top-performing Airbnb properties in Ruddervoordebased on Trailing Twelve Month (TTM) revenue. Analyze their characteristics, revenue, occupancy rate, and ADR to understand what drives success in this market.

Holiday Home Sint Hubertus
Entire Place • 6 bedrooms
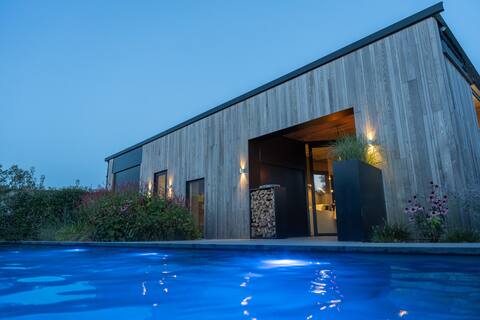
Industrial loft with sauna & pool
Entire Place • 1 bedroom
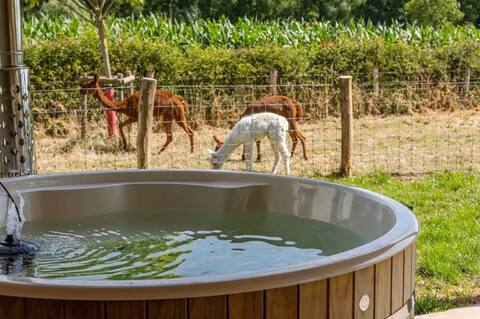
Alpaca Farm in the countryside "De Lentschoorhoeve"
Entire Place • 4 bedrooms

Maison Baillie with jacuzzi
Entire Place • 1 bedroom

Casa Leontine luxury Bruges with Jacuzzi/parking
Private Room • N/A

Sweet Suite Bruges
Private Room • N/A
Note: Performance varies based on location, size, amenities, seasonality, and management quality. Data reflects the past 12 months.
Top Performing Airbnb Hosts in Ruddervoorde (2026)
Learn from the best! This table showcases top-performing Airbnb hosts in Ruddervoorde based on the number of properties managed and estimated total revenue over the past year. Analyze their scale and performance metrics.
| Host Name | Properties | Grossing Revenue | Stay Reviews | Avg Rating |
|---|---|---|---|---|
| Nick | 2 | $116,212 | 148 | 4.66/5.0 |
| Pedro | 1 | $62,211 | 131 | 4.98/5.0 |
| Hanne | 9 | $44,807 | 50 | 4.40/5.0 |
| Grietje | 2 | $40,195 | 281 | 4.92/5.0 |
| Carl | 1 | $30,116 | 128 | 4.88/5.0 |
| Lieve | 1 | $19,426 | 211 | 4.93/5.0 |
| Jean-Paul From HUSWELL | 1 | $15,555 | 18 | 3.89/5.0 |
| Tim | 1 | $15,381 | 10 | 3.80/5.0 |
| Turs | 1 | $8,790 | 5 | 4.80/5.0 |
| Annelore | 1 | $3,130 | 83 | 4.82/5.0 |
Analyzing the strategies of top hosts, such as their property selection, pricing, and guest communication, can offer valuable lessons for optimizing your own Airbnb operations in Ruddervoorde.
Dive Deeper: Advanced Ruddervoorde STR Market Data (2026)
Ready to unlock more insights? AirROI provides access to advanced metrics and comprehensive Airbnb data for Ruddervoorde. Explore detailed analytics beyond this report to refine your investment strategy, optimize pricing, and maximize your vacation rental profits.
Explore Advanced MetricsRuddervoorde Short-Term Rental Market Composition (2026): Property & Room Types
Room Type Distribution
Property Type Distribution
Market Composition Insights for Ruddervoorde
- The Ruddervoorde Airbnb market composition is heavily skewed towards Private Room listings, which make up 61.9% of the 21 active rentals. This indicates strong guest preference for privacy and space.
- Looking at the property type distribution in Ruddervoorde, Unique Stays properties are the most common (33.3%), reflecting the local real estate landscape.
- Houses represent a significant 33.3% portion, catering likely to families or larger groups.
- Smaller segments like hotel/boutique (combined 4.8%) offer potential for unique stay experiences.
Ruddervoorde Airbnb Room Capacity Analysis (2026): Bedroom Distribution
Distribution of Listings by Number of Bedrooms
Room Capacity Insights for Ruddervoorde
- The dominant room capacity in Ruddervoorde is 1 bedroom listings, making up 61.9% of the market. This suggests a strong demand for properties suitable for couples or solo travelers.
- Together, 1 bedroom and 3 bedrooms properties represent 71.4% of the active Airbnb listings in Ruddervoorde, indicating a high concentration in these sizes.
- With over half the market (61.9%) consisting of studios or 1-bedroom units, Ruddervoorde is particularly well-suited for individuals or couples.
Ruddervoorde Vacation Rental Guest Capacity Trends (2026)
Distribution of Listings by Guest Capacity
Guest Capacity Insights for Ruddervoorde
- The most common guest capacity trend in Ruddervoorde vacation rentals is listings accommodating 2 guests (52.4%). This suggests the primary traveler segment is likely couples or solo travelers.
- Properties designed for 2 guests and 6 guests dominate the Ruddervoorde STR market, accounting for 61.9% of listings.
- A significant 52.4% of listings cater specifically to 1-2 guests, highlighting strong demand from couples and solo travelers in Ruddervoorde.
- 19.0% of properties accommodate 6+ guests, serving the market segment for larger families or group travel in Ruddervoorde.
- On average, properties in Ruddervoorde are equipped to host 2.8 guests.
Ruddervoorde Airbnb Booking Patterns (2026): Available vs. Booked Days
Available Days Distribution
Booked Days Distribution
Booking Pattern Insights for Ruddervoorde
- The most common availability pattern in Ruddervoorde falls within the 271-366 days range, representing 71.4% of listings. This suggests many properties have significant open periods on their calendars.
- Approximately 90.4% of listings show high availability (181+ days open annually), indicating potential for increased bookings or specific owner usage patterns.
- For booked days, the 31-90 days range is most frequent in Ruddervoorde (42.9%), reflecting common guest stay durations or potential owner blocking patterns.
- A notable 19.1% of properties secure long booking periods (181+ days booked per year), highlighting successful long-term rental strategies or significant owner usage.
Ruddervoorde Airbnb Minimum Stay Requirements Analysis
Distribution of Listings by Minimum Night Requirement
1 Night
11 listings
52.4% of total
2 Nights
3 listings
14.3% of total
30+ Nights
7 listings
33.3% of total
Key Insights
- The most prevalent minimum stay requirement in Ruddervoorde is 1 Night, adopted by 52.4% of listings. This highlights the market's preference for shorter, flexible bookings.
- A strong majority (66.7%) of the Ruddervoorde Airbnb data shows acceptance of very short stays (1-2 nights), indicating a dynamic, high-turnover market.
- A significant segment (33.3%) caters to monthly stays (30+ nights) in Ruddervoorde, pointing to opportunities in the extended-stay market.
Recommendations
- Align with the market by considering a 1 Night minimum stay, as 52.4% of Ruddervoorde hosts use this setting.
- Explore offering discounts for stays of 30+ nights to attract the 33.3% of the market seeking extended stays.
- Adjust minimum nights based on seasonality – potentially shorter during low season and longer during peak demand periods in Ruddervoorde.
Ruddervoorde Airbnb Cancellation Policy Trends Analysis (2026)
Limited
1 listings
4.8% of total
Flexible
4 listings
19% of total
Moderate
4 listings
19% of total
Firm
5 listings
23.8% of total
Strict
7 listings
33.3% of total
Cancellation Policy Insights for Ruddervoorde
- The prevailing Airbnb cancellation policy trend in Ruddervoorde is Strict, used by 33.3% of listings.
- A majority (57.1%) of hosts in Ruddervoorde utilize Firm or Strict policies, indicating a market where hosts prioritize booking security.
Recommendations for Hosts
- Consider adopting a Strict policy to align with the 33.3% market standard in Ruddervoorde.
- With 33.3% using Strict terms, this is a viable option in Ruddervoorde, particularly for high-value properties or during peak demand periods.
- Regularly review your cancellation policy against competitors and market demand shifts in Ruddervoorde.
Ruddervoorde STR Booking Lead Time Analysis (2026)
Average Booking Lead Time by Month
Booking Lead Time Insights for Ruddervoorde
- The overall average booking lead time for vacation rentals in Ruddervoorde is 66 days.
- Guests book furthest in advance for stays during January (average 132 days), likely coinciding with peak travel demand or local events.
- The shortest booking windows occur for stays in May (average 45 days), indicating more last-minute travel plans during this time.
- Seasonally, Winter (93 days avg.) sees the longest lead times, while Summer (57 days avg.) has the shortest, reflecting typical travel planning cycles.
Recommendations for Hosts
- Use the overall average lead time (66 days) as a baseline for your pricing and availability strategy in Ruddervoorde.
- For January stays, consider implementing length-of-stay discounts or slightly higher rates for bookings made less than 132 days out to capitalize on advance planning.
- Target marketing efforts for the Winter season well in advance (at least 93 days) to capture early planners.
- Monitor your own booking lead times against these Ruddervoorde averages to identify opportunities for dynamic pricing adjustments.
Popular & Essential Airbnb Amenities in Ruddervoorde (2026)
Amenity Prevalence
Amenity Insights for Ruddervoorde
- Essential amenities in Ruddervoorde that guests expect include: Free parking on premises, Smoke alarm. Lacking these (any) could significantly impact bookings.
- Popular amenities like Hot water, Fire extinguisher, Essentials are common but not universal. Offering these can provide a competitive edge.
Recommendations for Hosts
- Ensure your listing includes all essential amenities for Ruddervoorde: Free parking on premises, Smoke alarm.
- Prioritize adding missing essentials: Smoke alarm.
- Consider adding popular differentiators like Hot water or Fire extinguisher to increase appeal.
- Highlight unique or less common amenities you offer (e.g., hot tub, dedicated workspace, EV charger) in your listing description and photos.
- Regularly check competitor amenities in Ruddervoorde to stay competitive.
Ruddervoorde Airbnb Guest Demographics & Profile Analysis (2026)
Guest Profile Summary for Ruddervoorde
- The typical guest profile for Airbnb in Ruddervoorde consists of predominantly international visitors (73%), with top international origins including France, typically belonging to the Post-2000s (Gen Z/Alpha) group (50%), primarily speaking English or French.
- Domestic travelers account for 27.4% of guests.
- Key international markets include Belgium (27.4%) and France (20.7%).
- Top languages spoken are English (39.1%) followed by French (17.2%).
- A significant demographic segment is the Post-2000s (Gen Z/Alpha) group, representing 50% of guests.
Recommendations for Hosts
- Focus marketing internationally, particularly towards travelers from France.
- Tailor amenities and listing descriptions to appeal to the dominant Post-2000s (Gen Z/Alpha) demographic (e.g., highlight fast WiFi, smart home features, local guides).
- Highlight unique local experiences or amenities relevant to the primary guest profile.
- Consider seasonal promotions aligned with peak travel times for key origin markets.
Nearby Short-Term Rental Market Comparison
How does the Ruddervoorde Airbnb market stack up against its neighbors? Compare key performance metrics like average monthly revenue, ADR, and occupancy rates in surrounding areas to understand the broader regional STR landscape.
| Market | Active Properties | Monthly Revenue | Daily Rate | Avg. Occupancy |
|---|---|---|---|---|
| Raamsdonksveer | 16 | $7,756 | $736.17 | 38% |
| Kockengen | 11 | $6,027 | $485.77 | 53% |
| Lo-Reninge | 13 | $5,989 | $454.03 | 42% |
| Mont-de-l'Enclus | 10 | $5,398 | $407.81 | 36% |
| Merksplas | 12 | $5,367 | $356.64 | 43% |
| Zerkegem | 10 | $4,846 | $437.71 | 57% |
| Bentveld | 15 | $4,727 | $517.02 | 50% |
| Anzegem | 10 | $4,425 | $460.61 | 35% |
| Incourt | 13 | $4,412 | $303.48 | 52% |
| Zwanenburg | 22 | $4,111 | $255.87 | 61% |