Middelkerke Airbnb Market Analysis 2026: Short Term Rental Data & Vacation Rental Statistics in West Flanders, Belgium
Is Airbnb profitable in Middelkerke in 2026? Explore comprehensive Airbnb analytics for Middelkerke, West Flanders, Belgium to uncover income potential. This 2026 STR market report for Middelkerke, based on AirROI data from February 2025 to January 2026, reveals key trends in the market of 435 active listings.
Whether you're considering an Airbnb investment in Middelkerke, optimizing your existing vacation rental, or exploring rental arbitrage opportunities, understanding the Middelkerke Airbnb data is crucial. Leveraging the low regulation environment is key to maximizing your short term rental income potential. Let's dive into the specifics.
Key Middelkerke Airbnb Performance Metrics Overview
Monthly Airbnb Revenue Variations & Income Potential in Middelkerke (2026)
Understanding the monthly revenue variations for Airbnb listings in Middelkerke is key to maximizing your short term rental income potential. Seasonality significantly impacts earnings. Our analysis, based on data from the past 12 months, shows that the peak revenue month for STRs in Middelkerke is typically August, while January often presents the lowest earnings, highlighting opportunities for strategic pricing adjustments during shoulder and low seasons. Explore the typical Airbnb income in Middelkerke across different performance tiers:
- Best-in-class properties (Top 10%) achieve $3,953+ monthly, often utilizing dynamic pricing and superior guest experiences.
- Strong performing properties (Top 25%) earn $2,688 or more, indicating effective management and desirable locations/amenities.
- Typical properties (Median) generate around $1,671 per month, representing the average market performance.
- Entry-level properties (Bottom 25%) see earnings around $975, often with potential for optimization.
Average Monthly Airbnb Earnings Trend in Middelkerke
Middelkerke Airbnb Occupancy Rate Trends (2026)
Maximize your bookings by understanding the Middelkerke STR occupancy trends. Seasonal demand shifts significantly influence how often properties are booked. Typically, Augustsees the highest demand (peak season occupancy), while January experiences the lowest (low season). Effective strategies, like adjusting minimum stays or offering promotions, can boost occupancy during slower periods. Here's how different property tiers perform in Middelkerke:
- Best-in-class properties (Top 10%) achieve 79%+ occupancy, indicating high desirability and potentially optimized availability.
- Strong performing properties (Top 25%) maintain 60% or higher occupancy, suggesting good market fit and guest satisfaction.
- Typical properties (Median) have an occupancy rate around 38%.
- Entry-level properties (Bottom 25%) average 21% occupancy, potentially facing higher vacancy.
Average Monthly Occupancy Rate Trend in Middelkerke
Average Daily Rate (ADR) Airbnb Trends in Middelkerke (2026)
Effective short term rental pricing strategy in Middelkerke involves understanding monthly ADR fluctuations. The Average Daily Rate (ADR) for Airbnb in Middelkerke typically peaks in July and dips lowest during February. Leveraging Airbnb dynamic pricing tools or strategies based on this seasonality can significantly boost revenue. Here's a look at the typical nightly rates achieved:
- Best-in-class properties (Top 10%) command rates of $299+ per night, often due to premium features or locations.
- Strong performing properties (Top 25%) achieve nightly rates of $203 or more.
- Typical properties (Median) charge around $139 per night.
- Entry-level properties (Bottom 25%) earn around $104 per night.
Average Daily Rate (ADR) Trend by Month in Middelkerke
Get Live Middelkerke Market Intelligence 👇

Explore Real-time Analytics
Airbnb Seasonality Analysis & Trends in Middelkerke (2026)
Peak Season (August, July, June)
- Revenue averages $3,256 per month
- Occupancy rates average 58.4%
- Daily rates average $189
Shoulder Season
- Revenue averages $1,989 per month
- Occupancy maintains around 39.8%
- Daily rates hold near $174
Low Season (January, February, March)
- Revenue drops to average $1,193 per month
- Occupancy decreases to average 27.9%
- Daily rates adjust to average $162
Seasonality Insights for Middelkerke
- The Airbnb seasonality in Middelkerke shows highly seasonal trends requiring careful strategy. While the sections above show seasonal averages, it's also insightful to look at the extremes:
- During the high season, the absolute peak month showcases Middelkerke's highest earning potential, with monthly revenues capable of climbing to $3,763, occupancy reaching a high of 66.2%, and ADRs peaking at $192.
- Conversely, the slowest single month of the year, typically falling within the low season, marks the market's lowest point. In this month, revenue might dip to $910, occupancy could drop to 20.1%, and ADRs may adjust down to $158.
- Understanding both the seasonal averages and these monthly peaks and troughs in revenue, occupancy, and ADR is crucial for maximizing your Airbnb profit potential in Middelkerke.
Seasonal Strategies for Maximizing Profit
- Peak Season: Maximize revenue through premium pricing and potentially longer minimum stays. Ensure high availability.
- Low Season: Offer competitive pricing, special promotions (e.g., extended stay discounts), and flexible cancellation policies. Target off-season travelers like remote workers or budget-conscious guests.
- Shoulder Seasons: Implement dynamic pricing that balances peak and low rates. Target weekend travelers or specific events. Offer slightly more flexible terms than peak season.
- Regularly analyze your own performance against these Middelkerke seasonality benchmarks and adjust your pricing and availability strategy accordingly.
Best Areas for Airbnb Investment in Middelkerke (2026)
Exploring the top neighborhoods for short-term rentals in Middelkerke? This section highlights key areas, outlining why they are attractive for hosts and guests, along with notable local attractions. Consider these locations based on your target guest profile and investment strategy.
| Neighborhood / Area | Why Host Here? (Target Guests & Appeal) | Key Attractions & Landmarks |
|---|---|---|
| Oostende | A vibrant coastal city known for its sandy beaches and lively promenade, perfect for tourists looking for a classic beach experience with various dining and entertainment options. | Oostende Beach, Maria-Hendrikapark, The Mercator, Fort Napoleon, The Lange Nelle Lighthouse |
| Nieuwpoort | A charming town known for its marina and beautiful beach, offers a quieter and more relaxed atmosphere for families and couples. | Nieuwpoort Beach, The Nieuport Marina, The West Coast Tram, The Oosterstaketsel, The historical town center |
| Westende | A serene coastal village ideal for those looking to escape the hustle and bustle, featuring quaint beach houses and calm surroundings. | Westende Beach, Beachfront promenade, East End Museum, Local markets, Cycling routes |
| Middelkerke Centro | The central area of Middelkerke offers direct beach access and a range of shops and restaurants, making it a popular spot for vacationers. | Middelkerke Beach, Casino Middelkerke, The cultural center, Parks and gardens, Local cafes |
| Bredene | Known for its laid-back vibe and family-friendly atmosphere, this area appeals to those looking for quiet beaches and recreational activities. | Bredene Beach, The coast tram, Nature reserve De Uitkerkse Polder, Cycle routes, Familiepark Plopsaland |
| De Haan | Famous for its eco-friendly tourism and unspoiled nature, attracts nature lovers and those looking for a peaceful retreat by the sea. | De Haan Beach, The nature reserve, Walking paths, Local boutiques, Historic architecture |
| Zeebrugge | A vibrant destination with a port and marina, known for its seafood and local events, popular with tourists and locals alike. | Zeebrugge Beach, The fishing port, Belfry of Bruges, Sea Life Blankenberge, St. Kitts Church |
| Knokke-Heist | An upscale beachfront destination known for its high-end shops and dining, attracts a well-to-do crowd looking for luxury and leisure. | Knokke-Heist Beach, Zoute Golf Club, Sincfala Museum, The promenade, Local art galleries |
Understanding Airbnb License Requirements & STR Laws in Middelkerke (2026)
While Middelkerke, West Flanders, Belgium currently shows low STR regulations, specific Airbnb license requirements might still exist or change. Always verify the latest short term rental regulations and Airbnb license requirements directly with local government authorities for Middelkerke to ensure full compliance before hosting.
(Source: AirROI data, 2026, based on 0% licensed listings)
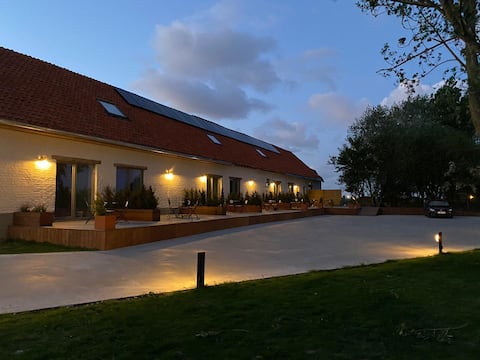
Top Performing Airbnb Properties in Middelkerke (2026)
Benchmark your potential! Explore examples of top-performing Airbnb properties in Middelkerkebased on Trailing Twelve Month (TTM) revenue. Analyze their characteristics, revenue, occupancy rate, and ADR to understand what drives success in this market.
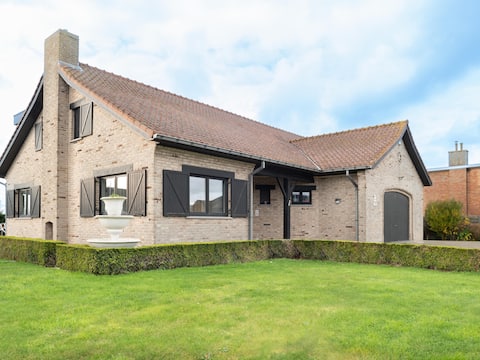
Beautiful villa with spa a stone's throw from th
Entire Place • 5 bedrooms
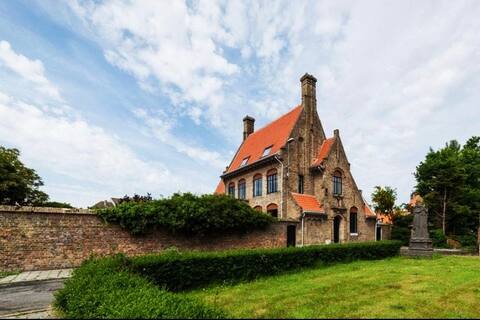
Unique renovated rectory, dating from 1923.
Entire Place • 6 bedrooms
Belcasa Sea House
Entire Place • 5 bedrooms

All the benefits of a farm, close to the sea!
Entire Place • 4 bedrooms
Handbooghoeve, Leffinge
Entire Place • 4 bedrooms

Villa Sealise - spacious house by the dunes
Entire Place • 5 bedrooms
Note: Performance varies based on location, size, amenities, seasonality, and management quality. Data reflects the past 12 months.
Top Performing Airbnb Hosts in Middelkerke (2026)
Learn from the best! This table showcases top-performing Airbnb hosts in Middelkerke based on the number of properties managed and estimated total revenue over the past year. Analyze their scale and performance metrics.
| Host Name | Properties | Grossing Revenue | Stay Reviews | Avg Rating |
|---|---|---|---|---|
| Anna From HUSWELL | 22 | $429,129 | 252 | 4.44/5.0 |
| Rentus | 20 | $421,736 | 184 | 4.49/5.0 |
| Asbl Service Social Du Personn | 29 | $351,813 | 1137 | 4.31/5.0 |
| Belgium Casas | 3 | $205,852 | 31 | 4.68/5.0 |
| Sybrand | 2 | $167,004 | 24 | 4.60/5.0 |
| Isabelle | 1 | $132,750 | 44 | 4.98/5.0 |
| Holiday Suites | 9 | $123,268 | 666 | 4.34/5.0 |
| Chantal Villa For You | 3 | $122,490 | 47 | 4.38/5.0 |
| Windy Dewaele | 2 | $100,113 | 98 | 4.67/5.0 |
| Katrien | 1 | $94,245 | 72 | 4.85/5.0 |
Analyzing the strategies of top hosts, such as their property selection, pricing, and guest communication, can offer valuable lessons for optimizing your own Airbnb operations in Middelkerke.
Dive Deeper: Advanced Middelkerke STR Market Data (2026)
Ready to unlock more insights? AirROI provides access to advanced metrics and comprehensive Airbnb data for Middelkerke. Explore detailed analytics beyond this report to refine your investment strategy, optimize pricing, and maximize your vacation rental profits.
Explore Advanced MetricsMiddelkerke Short-Term Rental Market Composition (2026): Property & Room Types
Room Type Distribution
Property Type Distribution
Market Composition Insights for Middelkerke
- The Middelkerke Airbnb market composition is heavily skewed towards Entire Home/Apt listings, which make up 96.3% of the 435 active rentals. This indicates strong guest preference for privacy and space.
- Looking at the property type distribution in Middelkerke, Apartment/Condo properties are the most common (70.1%), reflecting the local real estate landscape.
- Houses represent a significant 22.3% portion, catering likely to families or larger groups.
- Smaller segments like outdoor/unique, hotel/boutique, others (combined 7.6%) offer potential for unique stay experiences.
Middelkerke Airbnb Room Capacity Analysis (2026): Bedroom Distribution
Distribution of Listings by Number of Bedrooms
Room Capacity Insights for Middelkerke
- The dominant room capacity in Middelkerke is 2 bedrooms listings, making up 36.1% of the market. This suggests a strong demand for properties suitable for couples or solo travelers.
- Together, 2 bedrooms and 1 bedroom properties represent 60.9% of the active Airbnb listings in Middelkerke, indicating a high concentration in these sizes.
- A significant 24.0% of listings offer 3+ bedrooms, catering to larger groups and families seeking more space in Middelkerke.
Middelkerke Vacation Rental Guest Capacity Trends (2026)
Distribution of Listings by Guest Capacity
Guest Capacity Insights for Middelkerke
- The most common guest capacity trend in Middelkerke vacation rentals is listings accommodating 4 guests (33.6%). This suggests the primary traveler segment is likely small families or groups.
- Properties designed for 4 guests and 6 guests dominate the Middelkerke STR market, accounting for 58.0% of listings.
- 41.4% of properties accommodate 6+ guests, serving the market segment for larger families or group travel in Middelkerke.
- On average, properties in Middelkerke are equipped to host 4.9 guests.
Middelkerke Airbnb Booking Patterns (2026): Available vs. Booked Days
Available Days Distribution
Booked Days Distribution
Booking Pattern Insights for Middelkerke
- The most common availability pattern in Middelkerke falls within the 271-366 days range, representing 43% of listings. This suggests many properties have significant open periods on their calendars.
- Approximately 77.5% of listings show high availability (181+ days open annually), indicating potential for increased bookings or specific owner usage patterns.
- For booked days, the 91-180 days range is most frequent in Middelkerke (34.9%), reflecting common guest stay durations or potential owner blocking patterns.
- A notable 24.6% of properties secure long booking periods (181+ days booked per year), highlighting successful long-term rental strategies or significant owner usage.
Middelkerke Airbnb Minimum Stay Requirements Analysis
Distribution of Listings by Minimum Night Requirement
1 Night
51 listings
11.8% of total
2 Nights
101 listings
23.3% of total
3 Nights
32 listings
7.4% of total
4-6 Nights
26 listings
6% of total
7-29 Nights
4 listings
0.9% of total
30+ Nights
220 listings
50.7% of total
Key Insights
- The most prevalent minimum stay requirement in Middelkerke is 30+ Nights, adopted by 50.7% of listings. This highlights the market's preference for longer commitments.
- A significant segment (50.7%) caters to monthly stays (30+ nights) in Middelkerke, pointing to opportunities in the extended-stay market.
Recommendations
- Align with the market by considering a 30+ Nights minimum stay, as 50.7% of Middelkerke hosts use this setting.
- If feasible, allowing 1-night stays, especially midweek or during low season, could capture last-minute bookings, as only 11.8% currently do.
- Explore offering discounts for stays of 30+ nights to attract the 50.7% of the market seeking extended stays.
- Adjust minimum nights based on seasonality – potentially shorter during low season and longer during peak demand periods in Middelkerke.
Middelkerke Airbnb Cancellation Policy Trends Analysis (2026)
Super Strict 30 Days
31 listings
7.2% of total
Limited
3 listings
0.7% of total
Super Strict 60 Days
6 listings
1.4% of total
Flexible
72 listings
16.7% of total
Moderate
108 listings
25% of total
Firm
153 listings
35.4% of total
Strict
59 listings
13.7% of total
Cancellation Policy Insights for Middelkerke
- The prevailing Airbnb cancellation policy trend in Middelkerke is Firm, used by 35.4% of listings.
- There's a relatively balanced mix between guest-friendly (41.7%) and stricter (49.1%) policies, offering choices for different guest needs.
Recommendations for Hosts
- Consider adopting a Firm policy to align with the 35.4% market standard in Middelkerke.
- Using a Strict policy might deter some guests, as only 13.7% of listings use it. Evaluate if potential revenue protection outweighs possible lower booking rates.
- Regularly review your cancellation policy against competitors and market demand shifts in Middelkerke.
Middelkerke STR Booking Lead Time Analysis (2026)
Average Booking Lead Time by Month
Booking Lead Time Insights for Middelkerke
- The overall average booking lead time for vacation rentals in Middelkerke is 62 days.
- Guests book furthest in advance for stays during August (average 102 days), likely coinciding with peak travel demand or local events.
- The shortest booking windows occur for stays in February (average 32 days), indicating more last-minute travel plans during this time.
- Seasonally, Summer (86 days avg.) sees the longest lead times, while Winter (43 days avg.) has the shortest, reflecting typical travel planning cycles.
Recommendations for Hosts
- Use the overall average lead time (62 days) as a baseline for your pricing and availability strategy in Middelkerke.
- For August stays, consider implementing length-of-stay discounts or slightly higher rates for bookings made less than 102 days out to capitalize on advance planning.
- Target marketing efforts for the Summer season well in advance (at least 86 days) to capture early planners.
- Monitor your own booking lead times against these Middelkerke averages to identify opportunities for dynamic pricing adjustments.
Popular & Essential Airbnb Amenities in Middelkerke (2026)
Amenity Prevalence
Amenity Insights for Middelkerke
- Essential amenities in Middelkerke that guests expect include: Kitchen, TV. Lacking these (any) could significantly impact bookings.
- Popular amenities like Heating, Wifi, Smoke alarm are common but not universal. Offering these can provide a competitive edge.
- Warning: Wifi is not universally provided but is considered essential globally. Ensure reliable Wifi is offered.
Recommendations for Hosts
- Ensure your listing includes all essential amenities for Middelkerke: Kitchen, TV.
- Prioritize adding missing essentials: Kitchen, TV.
- Consider adding popular differentiators like Heating or Wifi to increase appeal.
- Highlight unique or less common amenities you offer (e.g., hot tub, dedicated workspace, EV charger) in your listing description and photos.
- Regularly check competitor amenities in Middelkerke to stay competitive.
Middelkerke Airbnb Guest Demographics & Profile Analysis (2026)
Guest Profile Summary for Middelkerke
- The typical guest profile for Airbnb in Middelkerke consists of a mix of domestic (48%) and international guests, with top international origins including Germany, typically belonging to the Post-2000s (Gen Z/Alpha) group (50%), primarily speaking English or French.
- Domestic travelers account for 47.6% of guests.
- Key international markets include Belgium (47.6%) and Germany (26.6%).
- Top languages spoken are English (33.9%) followed by French (23.8%).
- A significant demographic segment is the Post-2000s (Gen Z/Alpha) group, representing 50% of guests.
Recommendations for Hosts
- Balance marketing efforts between domestic and international channels based on the guest mix.
- Tailor amenities and listing descriptions to appeal to the dominant Post-2000s (Gen Z/Alpha) demographic (e.g., highlight fast WiFi, smart home features, local guides).
- Highlight unique local experiences or amenities relevant to the primary guest profile.
- Consider seasonal promotions aligned with peak travel times for key origin markets.
Nearby Short-Term Rental Market Comparison
How does the Middelkerke Airbnb market stack up against its neighbors? Compare key performance metrics like average monthly revenue, ADR, and occupancy rates in surrounding areas to understand the broader regional STR landscape.
| Market | Active Properties | Monthly Revenue | Daily Rate | Avg. Occupancy |
|---|---|---|---|---|
| Lo-Reninge | 13 | $5,989 | $454.03 | 42% |
| Mont-de-l'Enclus | 10 | $5,398 | $407.81 | 36% |
| Zerkegem | 10 | $4,846 | $437.72 | 57% |
| Anzegem | 10 | $4,425 | $460.61 | 35% |
| Ronse - Renaix | 18 | $3,878 | $411.21 | 35% |
| Ellezelles | 15 | $3,752 | $277.86 | 44% |
| Kluisbergen | 19 | $3,524 | $394.17 | 36% |
| Beernem | 25 | $3,515 | $313.01 | 41% |
| Heuvelland | 56 | $3,348 | $367.19 | 36% |
| Noordwelle | 10 | $3,287 | $271.14 | 39% |