Havelange Airbnb Market Analysis 2026: Short Term Rental Data & Vacation Rental Statistics in Namur, Belgium
Is Airbnb profitable in Havelange in 2026? Explore comprehensive Airbnb analytics for Havelange, Namur, Belgium to uncover income potential. This 2026 STR market report for Havelange, based on AirROI data from February 2025 to January 2026, reveals key trends in the niche market of 23 active listings.
Whether you're considering an Airbnb investment in Havelange, optimizing your existing vacation rental, or exploring rental arbitrage opportunities, understanding the Havelange Airbnb data is crucial. Leveraging the low regulation environment is key to maximizing your short term rental income potential. Let's dive into the specifics.
Key Havelange Airbnb Performance Metrics Overview
Monthly Airbnb Revenue Variations & Income Potential in Havelange (2026)
Understanding the monthly revenue variations for Airbnb listings in Havelange is key to maximizing your short term rental income potential. Seasonality significantly impacts earnings. Our analysis, based on data from the past 12 months, shows that the peak revenue month for STRs in Havelange is typically August, while January often presents the lowest earnings, highlighting opportunities for strategic pricing adjustments during shoulder and low seasons. Explore the typical Airbnb income in Havelange across different performance tiers:
- Best-in-class properties (Top 10%) achieve $6,671+ monthly, often utilizing dynamic pricing and superior guest experiences.
- Strong performing properties (Top 25%) earn $3,762 or more, indicating effective management and desirable locations/amenities.
- Typical properties (Median) generate around $2,039 per month, representing the average market performance.
- Entry-level properties (Bottom 25%) see earnings around $955, often with potential for optimization.
Average Monthly Airbnb Earnings Trend in Havelange
Havelange Airbnb Occupancy Rate Trends (2026)
Maximize your bookings by understanding the Havelange STR occupancy trends. Seasonal demand shifts significantly influence how often properties are booked. Typically, Junesees the highest demand (peak season occupancy), while January experiences the lowest (low season). Effective strategies, like adjusting minimum stays or offering promotions, can boost occupancy during slower periods. Here's how different property tiers perform in Havelange:
- Best-in-class properties (Top 10%) achieve 72%+ occupancy, indicating high desirability and potentially optimized availability.
- Strong performing properties (Top 25%) maintain 55% or higher occupancy, suggesting good market fit and guest satisfaction.
- Typical properties (Median) have an occupancy rate around 31%.
- Entry-level properties (Bottom 25%) average 15% occupancy, potentially facing higher vacancy.
Average Monthly Occupancy Rate Trend in Havelange
Average Daily Rate (ADR) Airbnb Trends in Havelange (2026)
Effective short term rental pricing strategy in Havelange involves understanding monthly ADR fluctuations. The Average Daily Rate (ADR) for Airbnb in Havelange typically peaks in December and dips lowest during March. Leveraging Airbnb dynamic pricing tools or strategies based on this seasonality can significantly boost revenue. Here's a look at the typical nightly rates achieved:
- Best-in-class properties (Top 10%) command rates of $428+ per night, often due to premium features or locations.
- Strong performing properties (Top 25%) achieve nightly rates of $287 or more.
- Typical properties (Median) charge around $160 per night.
- Entry-level properties (Bottom 25%) earn around $122 per night.
Average Daily Rate (ADR) Trend by Month in Havelange
Get Live Havelange Market Intelligence 👇

Explore Real-time Analytics
Airbnb Seasonality Analysis & Trends in Havelange (2026)
Peak Season (August, June, May)
- Revenue averages $3,877 per month
- Occupancy rates average 45.8%
- Daily rates average $224
Shoulder Season
- Revenue averages $2,900 per month
- Occupancy maintains around 36.7%
- Daily rates hold near $228
Low Season (January, February, March)
- Revenue drops to average $1,862 per month
- Occupancy decreases to average 27.8%
- Daily rates adjust to average $213
Seasonality Insights for Havelange
- The Airbnb seasonality in Havelange shows highly seasonal trends requiring careful strategy. While the sections above show seasonal averages, it's also insightful to look at the extremes:
- During the high season, the absolute peak month showcases Havelange's highest earning potential, with monthly revenues capable of climbing to $4,002, occupancy reaching a high of 47.5%, and ADRs peaking at $240.
- Conversely, the slowest single month of the year, typically falling within the low season, marks the market's lowest point. In this month, revenue might dip to $1,306, occupancy could drop to 15.4%, and ADRs may adjust down to $204.
- Understanding both the seasonal averages and these monthly peaks and troughs in revenue, occupancy, and ADR is crucial for maximizing your Airbnb profit potential in Havelange.
Seasonal Strategies for Maximizing Profit
- Peak Season: Maximize revenue through premium pricing and potentially longer minimum stays. Ensure high availability.
- Low Season: Offer competitive pricing, special promotions (e.g., extended stay discounts), and flexible cancellation policies. Target off-season travelers like remote workers or budget-conscious guests.
- Shoulder Seasons: Implement dynamic pricing that balances peak and low rates. Target weekend travelers or specific events. Offer slightly more flexible terms than peak season.
- Regularly analyze your own performance against these Havelange seasonality benchmarks and adjust your pricing and availability strategy accordingly.
Best Areas for Airbnb Investment in Havelange (2026)
Exploring the top neighborhoods for short-term rentals in Havelange? This section highlights key areas, outlining why they are attractive for hosts and guests, along with notable local attractions. Consider these locations based on your target guest profile and investment strategy.
| Neighborhood / Area | Why Host Here? (Target Guests & Appeal) | Key Attractions & Landmarks |
|---|---|---|
| Durbuy | Known as the smallest city in the world, Durbuy offers a charming medieval atmosphere with beautiful cobblestone streets and picturesque scenery, perfect for romantic getaways and nature enthusiasts. | Durbuy Adventure, Topiary Park, Castle of Durbuy, River Ourthe, Durbuy Golf Club |
| La Roche-en-Ardenne | A captivating town surrounded by nature, famous for its outdoor activities like hiking and kayaking, appealing to adventure seekers and nature lovers. | La Roche Castle, Ourthe River activities, Adventure Valley, The Ardennes Museum, La Roche-en-Ardenne Tourist Office |
| Han-sur-Lesse | Home to the famous Han Caves, this area attracts tourists interested in nature, exploration and adventure, along with beautiful landscapes. | Han Caves, Wildlife Park, River Lesse, Historical site of the Cave, Walking trails |
| Marche-en-Famenne | A vibrant town with rich history and culture, it's a great starting point for exploring the Ardennes, appealing to families and cultural enthusiasts. | Town Hall of Marche, Marche-en-Famenne Museum, Saint-Etienne Church, Local Markets, Outdoor festivals |
| Namur | The capital of Wallonia, known for its historical sites, vibrant city life, and cultural events, making it attractive for urban tourism. | Citadel of Namur, St. Aubin's Cathedral, Namur Museum of Fine Arts, Felicien Rops Museum, Meuse River |
| Ciney | Renowned for its beer culture and charming town center, Ciney is perfect for tourists looking for a more local experience with good food and drink. | Ciney Brewery, Saint-Bertin Church, Ciney Local Market, Rochefort Abbey, Nearby hiking trails |
| Ohey | A tranquil village known for its rural charm and nature walks, attracting visitors looking for peace and outdoor activities away from city life. | Ohey's Local Parks, Nature Walks, Historical Mill, Children's Playgrounds, Local Artisan Markets |
| Profondeville | Nestled along the Meuse River, this area offers scenic views and riverside activities, appealing to those seeking relaxation in nature. | Meuse River walks, Profondeville Castle, Local Bistros, Scenic viewpoints, Cycling paths |
Understanding Airbnb License Requirements & STR Laws in Havelange (2026)
While Havelange, Namur, Belgium currently shows low STR regulations, specific Airbnb license requirements might still exist or change. Always verify the latest short term rental regulations and Airbnb license requirements directly with local government authorities for Havelange to ensure full compliance before hosting.
(Source: AirROI data, 2026, finding no licensed listings among those analyzed)
Top Performing Airbnb Properties in Havelange (2026)
Benchmark your potential! Explore examples of top-performing Airbnb properties in Havelangebased on Trailing Twelve Month (TTM) revenue. Analyze their characteristics, revenue, occupancy rate, and ADR to understand what drives success in this market.
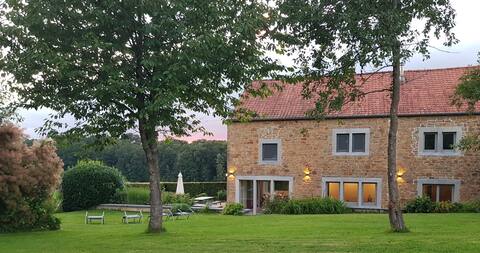
Country cottage '21 good reasons' - Ossogne
Entire Place • 4 bedrooms
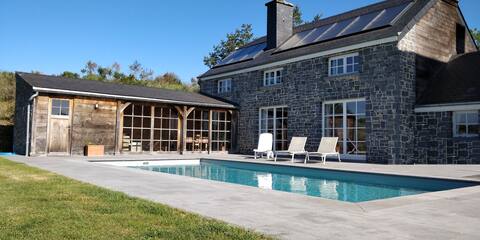
La Girouette des Ardennes
Entire Place • 3 bedrooms
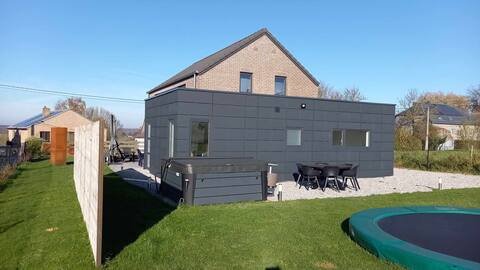
House in Porcheresse (Havelange) for 6 people
Entire Place • 3 bedrooms

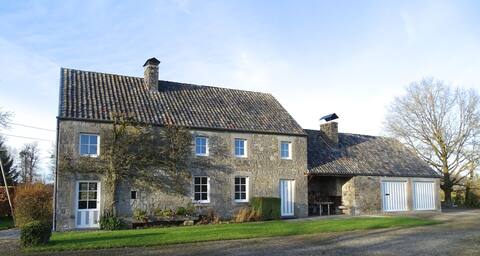
Comfortable country cottage
Entire Place • 3 bedrooms

Stone house, warm, with pond
Entire Place • 3 bedrooms
The Little House of Bormenville
Entire Place • 6 bedrooms
Note: Performance varies based on location, size, amenities, seasonality, and management quality. Data reflects the past 12 months.
Top Performing Airbnb Hosts in Havelange (2026)
Learn from the best! This table showcases top-performing Airbnb hosts in Havelange based on the number of properties managed and estimated total revenue over the past year. Analyze their scale and performance metrics.
| Host Name | Properties | Grossing Revenue | Stay Reviews | Avg Rating |
|---|---|---|---|---|
| Froidefontaine | 4 | $78,295 | 130 | 4.77/5.0 |
| Christophe | 1 | $76,712 | 60 | 4.90/5.0 |
| François | 1 | $65,998 | 132 | 4.91/5.0 |
| Geneviève | 2 | $59,959 | 211 | 4.87/5.0 |
| Nadia | 1 | $57,108 | 15 | 4.80/5.0 |
| Christine | 1 | $42,814 | 47 | 4.83/5.0 |
| Annick | 1 | $42,390 | 78 | 4.60/5.0 |
| Jacqueline | 1 | $27,210 | 27 | 4.89/5.0 |
| Pierre | 1 | $25,731 | 6 | 5.00/5.0 |
| Fabrice | 1 | $17,038 | 104 | 4.68/5.0 |
Analyzing the strategies of top hosts, such as their property selection, pricing, and guest communication, can offer valuable lessons for optimizing your own Airbnb operations in Havelange.
Dive Deeper: Advanced Havelange STR Market Data (2026)
Ready to unlock more insights? AirROI provides access to advanced metrics and comprehensive Airbnb data for Havelange. Explore detailed analytics beyond this report to refine your investment strategy, optimize pricing, and maximize your vacation rental profits.
Explore Advanced MetricsHavelange Short-Term Rental Market Composition (2026): Property & Room Types
Room Type Distribution
Property Type Distribution
Market Composition Insights for Havelange
- The Havelange Airbnb market composition is heavily skewed towards Entire Home/Apt listings, which make up 91.3% of the 23 active rentals. This indicates strong guest preference for privacy and space.
- Looking at the property type distribution in Havelange, House properties are the most common (65.2%), reflecting the local real estate landscape.
- Houses represent a significant 65.2% portion, catering likely to families or larger groups.
- The presence of 8.7% Hotel/Boutique listings indicates integration with traditional hospitality.
- Smaller segments like outdoor/unique, apartment/condo (combined 8.6%) offer potential for unique stay experiences.
Havelange Airbnb Room Capacity Analysis (2026): Bedroom Distribution
Distribution of Listings by Number of Bedrooms
Room Capacity Insights for Havelange
- The dominant room capacity in Havelange is 1 bedroom listings, making up 39.1% of the market. This suggests a strong demand for properties suitable for couples or solo travelers.
- Together, 1 bedroom and 3 bedrooms properties represent 65.2% of the active Airbnb listings in Havelange, indicating a high concentration in these sizes.
- A significant 60.8% of listings offer 3+ bedrooms, catering to larger groups and families seeking more space in Havelange.
Havelange Vacation Rental Guest Capacity Trends (2026)
Distribution of Listings by Guest Capacity
Guest Capacity Insights for Havelange
- The most common guest capacity trend in Havelange vacation rentals is listings accommodating 8+ guests (34.8%). This suggests the primary traveler segment is likely larger groups.
- Properties designed for 8+ guests and 2 guests dominate the Havelange STR market, accounting for 52.2% of listings.
- 47.8% of properties accommodate 6+ guests, serving the market segment for larger families or group travel in Havelange.
- On average, properties in Havelange are equipped to host 5.0 guests.
Havelange Airbnb Booking Patterns (2026): Available vs. Booked Days
Available Days Distribution
Booked Days Distribution
Booking Pattern Insights for Havelange
- The most common availability pattern in Havelange falls within the 271-366 days range, representing 56.5% of listings. This suggests many properties have significant open periods on their calendars.
- Approximately 86.9% of listings show high availability (181+ days open annually), indicating potential for increased bookings or specific owner usage patterns.
- For booked days, the 31-90 days range is most frequent in Havelange (39.1%), reflecting common guest stay durations or potential owner blocking patterns.
- A notable 17.3% of properties secure long booking periods (181+ days booked per year), highlighting successful long-term rental strategies or significant owner usage.
Havelange Airbnb Minimum Stay Requirements Analysis
Distribution of Listings by Minimum Night Requirement
1 Night
4 listings
17.4% of total
2 Nights
15 listings
65.2% of total
30+ Nights
4 listings
17.4% of total
Key Insights
- The most prevalent minimum stay requirement in Havelange is 2 Nights, adopted by 65.2% of listings. This highlights the market's preference for shorter, flexible bookings.
- A strong majority (82.6%) of the Havelange Airbnb data shows acceptance of very short stays (1-2 nights), indicating a dynamic, high-turnover market.
- A significant segment (17.4%) caters to monthly stays (30+ nights) in Havelange, pointing to opportunities in the extended-stay market.
Recommendations
- Align with the market by considering a 2 Nights minimum stay, as 65.2% of Havelange hosts use this setting.
- If feasible, allowing 1-night stays, especially midweek or during low season, could capture last-minute bookings, as only 17.4% currently do.
- A 2-night minimum appears standard (65.2%). Consider this for weekends or peak periods.
- Explore offering discounts for stays of 30+ nights to attract the 17.4% of the market seeking extended stays.
- Adjust minimum nights based on seasonality – potentially shorter during low season and longer during peak demand periods in Havelange.
Havelange Airbnb Cancellation Policy Trends Analysis (2026)
Super Strict 30 Days
2 listings
8.7% of total
Flexible
1 listings
4.3% of total
Moderate
2 listings
8.7% of total
Firm
16 listings
69.6% of total
Strict
2 listings
8.7% of total
Cancellation Policy Insights for Havelange
- The prevailing Airbnb cancellation policy trend in Havelange is Firm, used by 69.6% of listings.
- A majority (78.3%) of hosts in Havelange utilize Firm or Strict policies, indicating a market where hosts prioritize booking security.
- Strict cancellation policies are quite rare (8.7%), potentially making listings with this policy less competitive unless justified by high demand or property type.
Recommendations for Hosts
- Consider adopting a Firm policy to align with the 69.6% market standard in Havelange.
- Using a Strict policy might deter some guests, as only 8.7% of listings use it. Evaluate if potential revenue protection outweighs possible lower booking rates.
- Regularly review your cancellation policy against competitors and market demand shifts in Havelange.
Havelange STR Booking Lead Time Analysis (2026)
Average Booking Lead Time by Month
Booking Lead Time Insights for Havelange
- The overall average booking lead time for vacation rentals in Havelange is 73 days.
- Guests book furthest in advance for stays during July (average 91 days), likely coinciding with peak travel demand or local events.
- The shortest booking windows occur for stays in March (average 42 days), indicating more last-minute travel plans during this time.
- Seasonally, Summer (83 days avg.) sees the longest lead times, while Winter (61 days avg.) has the shortest, reflecting typical travel planning cycles.
Recommendations for Hosts
- Use the overall average lead time (73 days) as a baseline for your pricing and availability strategy in Havelange.
- For July stays, consider implementing length-of-stay discounts or slightly higher rates for bookings made less than 91 days out to capitalize on advance planning.
- Target marketing efforts for the Summer season well in advance (at least 83 days) to capture early planners.
- Monitor your own booking lead times against these Havelange averages to identify opportunities for dynamic pricing adjustments.
Popular & Essential Airbnb Amenities in Havelange (2026)
Amenity Prevalence
Amenity Insights for Havelange
- Essential amenities in Havelange that guests expect include: Heating. Lacking these (this) could significantly impact bookings.
- Popular amenities like Kitchen, Smoke alarm, Coffee maker are common but not universal. Offering these can provide a competitive edge.
- Warning: Wifi is not universally provided but is considered essential globally. Ensure reliable Wifi is offered.
Recommendations for Hosts
- Ensure your listing includes all essential amenities for Havelange: Heating.
- Prioritize adding missing essentials: Heating.
- Consider adding popular differentiators like Kitchen or Smoke alarm to increase appeal.
- Highlight unique or less common amenities you offer (e.g., hot tub, dedicated workspace, EV charger) in your listing description and photos.
- Regularly check competitor amenities in Havelange to stay competitive.
Havelange Airbnb Guest Demographics & Profile Analysis (2026)
Guest Profile Summary for Havelange
- The typical guest profile for Airbnb in Havelange consists of a mix of domestic (46%) and international guests, with top international origins including Netherlands, typically belonging to the Post-2000s (Gen Z/Alpha) group (50%), primarily speaking English or Dutch.
- Domestic travelers account for 45.6% of guests.
- Key international markets include Belgium (45.6%) and Netherlands (33.3%).
- Top languages spoken are English (36%) followed by Dutch (28%).
- A significant demographic segment is the Post-2000s (Gen Z/Alpha) group, representing 50% of guests.
Recommendations for Hosts
- Balance marketing efforts between domestic and international channels based on the guest mix.
- Tailor amenities and listing descriptions to appeal to the dominant Post-2000s (Gen Z/Alpha) demographic (e.g., highlight fast WiFi, smart home features, local guides).
- Highlight unique local experiences or amenities relevant to the primary guest profile.
- Consider seasonal promotions aligned with peak travel times for key origin markets.
Nearby Short-Term Rental Market Comparison
How does the Havelange Airbnb market stack up against its neighbors? Compare key performance metrics like average monthly revenue, ADR, and occupancy rates in surrounding areas to understand the broader regional STR landscape.
| Market | Active Properties | Monthly Revenue | Daily Rate | Avg. Occupancy |
|---|---|---|---|---|
| Raamsdonksveer | 16 | $7,756 | $736.17 | 38% |
| Haghorst | 11 | $5,995 | $480.40 | 40% |
| Baarlo | 20 | $5,442 | $332.61 | 51% |
| Merksplas | 12 | $5,367 | $356.64 | 43% |
| Incourt | 13 | $4,412 | $303.48 | 52% |
| Wellin | 12 | $4,365 | $446.64 | 42% |
| Aubel | 26 | $4,191 | $283.88 | 46% |
| Dion | 12 | $4,104 | $270.32 | 50% |
| Bertogne | 26 | $3,839 | $325.90 | 42% |
| Mettet | 21 | $3,771 | $283.66 | 42% |