Dinant Airbnb Market Analysis 2026: Short Term Rental Data & Vacation Rental Statistics in Namur, Belgium
Is Airbnb profitable in Dinant in 2026? Explore comprehensive Airbnb analytics for Dinant, Namur, Belgium to uncover income potential. This 2026 STR market report for Dinant, based on AirROI data from February 2025 to January 2026, reveals key trends in the niche market of 129 active listings.
Whether you're considering an Airbnb investment in Dinant, optimizing your existing vacation rental, or exploring rental arbitrage opportunities, understanding the Dinant Airbnb data is crucial. Leveraging the low regulation environment is key to maximizing your short term rental income potential. Let's dive into the specifics.
Key Dinant Airbnb Performance Metrics Overview
Monthly Airbnb Revenue Variations & Income Potential in Dinant (2026)
Understanding the monthly revenue variations for Airbnb listings in Dinant is key to maximizing your short term rental income potential. Seasonality significantly impacts earnings. Our analysis, based on data from the past 12 months, shows that the peak revenue month for STRs in Dinant is typically August, while January often presents the lowest earnings, highlighting opportunities for strategic pricing adjustments during shoulder and low seasons. Explore the typical Airbnb income in Dinant across different performance tiers:
- Best-in-class properties (Top 10%) achieve $5,354+ monthly, often utilizing dynamic pricing and superior guest experiences.
- Strong performing properties (Top 25%) earn $3,065 or more, indicating effective management and desirable locations/amenities.
- Typical properties (Median) generate around $1,945 per month, representing the average market performance.
- Entry-level properties (Bottom 25%) see earnings around $1,079, often with potential for optimization.
Average Monthly Airbnb Earnings Trend in Dinant
Dinant Airbnb Occupancy Rate Trends (2026)
Maximize your bookings by understanding the Dinant STR occupancy trends. Seasonal demand shifts significantly influence how often properties are booked. Typically, Augustsees the highest demand (peak season occupancy), while January experiences the lowest (low season). Effective strategies, like adjusting minimum stays or offering promotions, can boost occupancy during slower periods. Here's how different property tiers perform in Dinant:
- Best-in-class properties (Top 10%) achieve 76%+ occupancy, indicating high desirability and potentially optimized availability.
- Strong performing properties (Top 25%) maintain 60% or higher occupancy, suggesting good market fit and guest satisfaction.
- Typical properties (Median) have an occupancy rate around 42%.
- Entry-level properties (Bottom 25%) average 24% occupancy, potentially facing higher vacancy.
Average Monthly Occupancy Rate Trend in Dinant
Average Daily Rate (ADR) Airbnb Trends in Dinant (2026)
Effective short term rental pricing strategy in Dinant involves understanding monthly ADR fluctuations. The Average Daily Rate (ADR) for Airbnb in Dinant typically peaks in September and dips lowest during February. Leveraging Airbnb dynamic pricing tools or strategies based on this seasonality can significantly boost revenue. Here's a look at the typical nightly rates achieved:
- Best-in-class properties (Top 10%) command rates of $320+ per night, often due to premium features or locations.
- Strong performing properties (Top 25%) achieve nightly rates of $211 or more.
- Typical properties (Median) charge around $148 per night.
- Entry-level properties (Bottom 25%) earn around $109 per night.
Average Daily Rate (ADR) Trend by Month in Dinant
Get Live Dinant Market Intelligence 👇

Explore Real-time Analytics
Airbnb Seasonality Analysis & Trends in Dinant (2026)
Peak Season (August, July, October)
- Revenue averages $3,420 per month
- Occupancy rates average 53.6%
- Daily rates average $193
Shoulder Season
- Revenue averages $2,721 per month
- Occupancy maintains around 43.1%
- Daily rates hold near $187
Low Season (January, February, March)
- Revenue drops to average $1,956 per month
- Occupancy decreases to average 33.9%
- Daily rates adjust to average $175
Seasonality Insights for Dinant
- The Airbnb seasonality in Dinant shows highly seasonal trends requiring careful strategy. While the sections above show seasonal averages, it's also insightful to look at the extremes:
- During the high season, the absolute peak month showcases Dinant's highest earning potential, with monthly revenues capable of climbing to $3,718, occupancy reaching a high of 57.3%, and ADRs peaking at $196.
- Conversely, the slowest single month of the year, typically falling within the low season, marks the market's lowest point. In this month, revenue might dip to $1,817, occupancy could drop to 24.0%, and ADRs may adjust down to $168.
- Understanding both the seasonal averages and these monthly peaks and troughs in revenue, occupancy, and ADR is crucial for maximizing your Airbnb profit potential in Dinant.
Seasonal Strategies for Maximizing Profit
- Peak Season: Maximize revenue through premium pricing and potentially longer minimum stays. Ensure high availability.
- Low Season: Offer competitive pricing, special promotions (e.g., extended stay discounts), and flexible cancellation policies. Target off-season travelers like remote workers or budget-conscious guests.
- Shoulder Seasons: Implement dynamic pricing that balances peak and low rates. Target weekend travelers or specific events. Offer slightly more flexible terms than peak season.
- Regularly analyze your own performance against these Dinant seasonality benchmarks and adjust your pricing and availability strategy accordingly.
Best Areas for Airbnb Investment in Dinant (2026)
Exploring the top neighborhoods for short-term rentals in Dinant? This section highlights key areas, outlining why they are attractive for hosts and guests, along with notable local attractions. Consider these locations based on your target guest profile and investment strategy.
| Neighborhood / Area | Why Host Here? (Target Guests & Appeal) | Key Attractions & Landmarks |
|---|---|---|
| Dinant City Center | The heart of Dinant, offering stunning views of the Meuse River and historical landmarks. Perfect for tourists visiting the Collegiate Church of Notre Dame and the Citadel. | Collegiate Church of Notre Dame, Dinant Citadel, Leffe Beer Museum, Maison de la Pataphonie, Meuse River |
| Bocq Valley | A picturesque valley ideal for nature lovers and those seeking outdoor activities. Attracts visitors for hiking, biking, and local breweries. | Bocq Brewery, Hiking Trails, Kayaking on the Bocq River, Scenic Nature Views |
| Château de Freÿr | A beautiful historic castle located near Dinant, offering cultural experiences and gorgeous gardens. Great for tourists interested in history and architecture. | Château de Freÿr, Gardens of Freÿr |
| Climbing Sites | Dinant is renowned for its outdoor climbing and adventure sports, attracting thrill-seekers and sport enthusiasts all year round. | Outdoor Climbing Walls, Adventure Sports Companies, Rock Climbing Routes |
| Botanical Garden of Meise | A short drive from Dinant, this expansive botanical garden is perfect for families and nature lovers looking to explore plant diversity. | Botanical Garden Trails, Themed Plant Collections, Family-Friendly Activities |
| River Meuse | The River Meuse offers scenic riverside activities and a tranquil escape. Visitors appreciate boat trips, cycling paths, and relaxing views. | Boat Tours, Cycling along the Meuse, Riverside Cafés |
| Les Jardins d'Annevoie | These stunning gardens are a hidden gem known for their beautiful water features and intricate landscaping. Attracts visitors interested in horticulture and photography. | Annevoie Gardens, Water Features, Landscapes |
| Local Breweries | Dinant is home to a variety of local breweries producing unique beers. Beer enthusiasts come for tours and tastings, making it a great spot for culinary tourism. | Dinant Beer Factory, Local Breweries Tours, Beer Tastings |
Understanding Airbnb License Requirements & STR Laws in Dinant (2026)
While Dinant, Namur, Belgium currently shows low STR regulations, specific Airbnb license requirements might still exist or change. Always verify the latest short term rental regulations and Airbnb license requirements directly with local government authorities for Dinant to ensure full compliance before hosting.
(Source: AirROI data, 2026, finding no licensed listings among those analyzed)
Top Performing Airbnb Properties in Dinant (2026)
Benchmark your potential! Explore examples of top-performing Airbnb properties in Dinantbased on Trailing Twelve Month (TTM) revenue. Analyze their characteristics, revenue, occupancy rate, and ADR to understand what drives success in this market.
The hideout in the orchard
Entire Place • 5 bedrooms

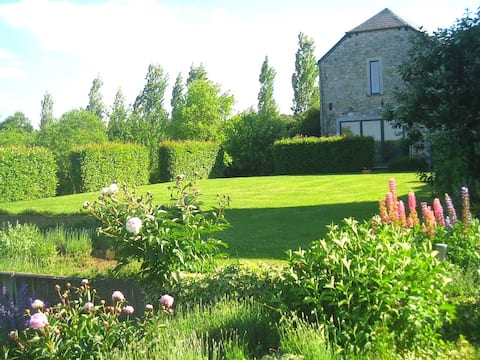
House with a view near Lesse, Maas and Freyr
Entire Place • 6 bedrooms

L'Amont des Cascatelles. Sauna and jacuzzi
Entire Place • 4 bedrooms
La Ferme de Meez
Entire Place • 6 bedrooms
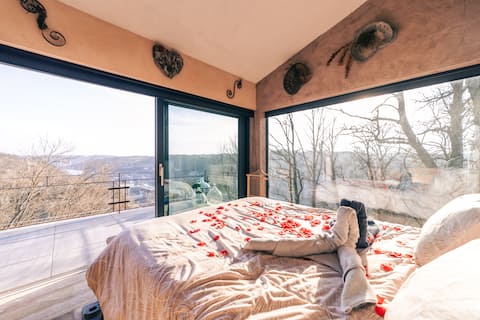
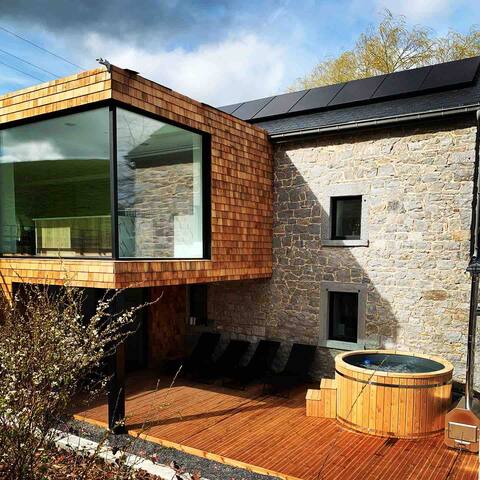
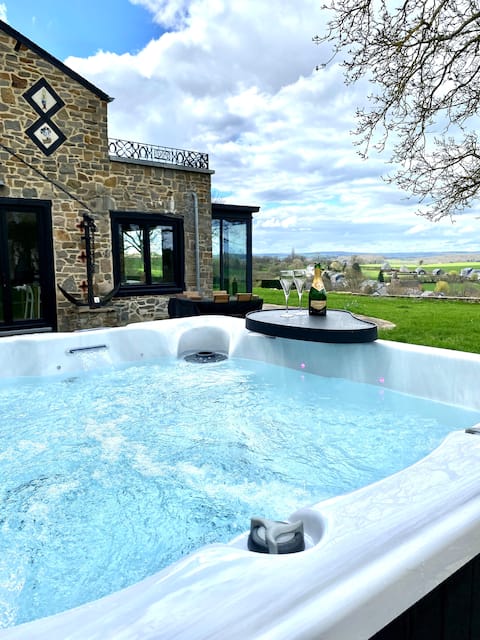
Unique Cottage w/ Amazing View & Private Wellness
Entire Place • 1 bedroom
Character house on the heights of Dinant
Entire Place • 5 bedrooms
Note: Performance varies based on location, size, amenities, seasonality, and management quality. Data reflects the past 12 months.
Top Performing Airbnb Hosts in Dinant (2026)
Learn from the best! This table showcases top-performing Airbnb hosts in Dinant based on the number of properties managed and estimated total revenue over the past year. Analyze their scale and performance metrics.
| Host Name | Properties | Grossing Revenue | Stay Reviews | Avg Rating |
|---|---|---|---|---|
| Michael | 1 | $234,550 | 47 | 5.00/5.0 |
| Frederik | 1 | $151,664 | 95 | 4.77/5.0 |
| Marie | 4 | $147,548 | 276 | 4.92/5.0 |
| Laurence Et Olivier | 1 | $139,235 | 131 | 4.99/5.0 |
| Noëlle | 1 | $129,279 | 22 | 4.86/5.0 |
| Grégory | 1 | $109,985 | 130 | 4.99/5.0 |
| Gilles | 6 | $104,260 | 126 | 4.84/5.0 |
| Pascal | 3 | $101,433 | 721 | 4.84/5.0 |
| Jean-Michel | 3 | $99,100 | 248 | 4.64/5.0 |
| Laura Et Noam | 1 | $81,881 | 51 | 4.86/5.0 |
Analyzing the strategies of top hosts, such as their property selection, pricing, and guest communication, can offer valuable lessons for optimizing your own Airbnb operations in Dinant.
Dive Deeper: Advanced Dinant STR Market Data (2026)
Ready to unlock more insights? AirROI provides access to advanced metrics and comprehensive Airbnb data for Dinant. Explore detailed analytics beyond this report to refine your investment strategy, optimize pricing, and maximize your vacation rental profits.
Explore Advanced MetricsDinant Short-Term Rental Market Composition (2026): Property & Room Types
Room Type Distribution
Property Type Distribution
Market Composition Insights for Dinant
- The Dinant Airbnb market composition is heavily skewed towards Entire Home/Apt listings, which make up 83.7% of the 129 active rentals. This indicates strong guest preference for privacy and space.
- Looking at the property type distribution in Dinant, Apartment/Condo properties are the most common (45.7%), reflecting the local real estate landscape.
- Houses represent a significant 38.8% portion, catering likely to families or larger groups.
- The presence of 8.5% Hotel/Boutique listings indicates integration with traditional hospitality.
- Smaller segments like outdoor/unique, unique stays (combined 7.0%) offer potential for unique stay experiences.
Dinant Airbnb Room Capacity Analysis (2026): Bedroom Distribution
Distribution of Listings by Number of Bedrooms
Room Capacity Insights for Dinant
- The dominant room capacity in Dinant is 1 bedroom listings, making up 44.2% of the market. This suggests a strong demand for properties suitable for couples or solo travelers.
- Together, 1 bedroom and 2 bedrooms properties represent 62.8% of the active Airbnb listings in Dinant, indicating a high concentration in these sizes.
- A significant 28.7% of listings offer 3+ bedrooms, catering to larger groups and families seeking more space in Dinant.
Dinant Vacation Rental Guest Capacity Trends (2026)
Distribution of Listings by Guest Capacity
Guest Capacity Insights for Dinant
- The most common guest capacity trend in Dinant vacation rentals is listings accommodating 2 guests (28.7%). This suggests the primary traveler segment is likely couples or solo travelers.
- Properties designed for 2 guests and 4 guests dominate the Dinant STR market, accounting for 52.0% of listings.
- 27.2% of properties accommodate 6+ guests, serving the market segment for larger families or group travel in Dinant.
- On average, properties in Dinant are equipped to host 3.8 guests.
Dinant Airbnb Booking Patterns (2026): Available vs. Booked Days
Available Days Distribution
Booked Days Distribution
Booking Pattern Insights for Dinant
- The most common availability pattern in Dinant falls within the 181-270 days range, representing 38.8% of listings. This suggests many properties have significant open periods on their calendars.
- Approximately 72.1% of listings show high availability (181+ days open annually), indicating potential for increased bookings or specific owner usage patterns.
- For booked days, the 91-180 days range is most frequent in Dinant (38.8%), reflecting common guest stay durations or potential owner blocking patterns.
- A notable 28.7% of properties secure long booking periods (181+ days booked per year), highlighting successful long-term rental strategies or significant owner usage.
Dinant Airbnb Minimum Stay Requirements Analysis
Distribution of Listings by Minimum Night Requirement
1 Night
48 listings
37.2% of total
2 Nights
45 listings
34.9% of total
3 Nights
4 listings
3.1% of total
4-6 Nights
1 listings
0.8% of total
30+ Nights
31 listings
24% of total
Key Insights
- The most prevalent minimum stay requirement in Dinant is 1 Night, adopted by 37.2% of listings. This highlights the market's preference for shorter, flexible bookings.
- A strong majority (72.1%) of the Dinant Airbnb data shows acceptance of very short stays (1-2 nights), indicating a dynamic, high-turnover market.
- A significant segment (24%) caters to monthly stays (30+ nights) in Dinant, pointing to opportunities in the extended-stay market.
Recommendations
- Align with the market by considering a 1 Night minimum stay, as 37.2% of Dinant hosts use this setting.
- Explore offering discounts for stays of 30+ nights to attract the 24% of the market seeking extended stays.
- Adjust minimum nights based on seasonality – potentially shorter during low season and longer during peak demand periods in Dinant.
Dinant Airbnb Cancellation Policy Trends Analysis (2026)
Limited
2 listings
1.6% of total
Flexible
37 listings
28.7% of total
Moderate
49 listings
38% of total
Firm
32 listings
24.8% of total
Strict
9 listings
7% of total
Cancellation Policy Insights for Dinant
- The prevailing Airbnb cancellation policy trend in Dinant is Moderate, used by 38% of listings.
- There's a relatively balanced mix between guest-friendly (66.7%) and stricter (31.8%) policies, offering choices for different guest needs.
- Strict cancellation policies are quite rare (7%), potentially making listings with this policy less competitive unless justified by high demand or property type.
Recommendations for Hosts
- Consider adopting a Moderate policy to align with the 38% market standard in Dinant.
- Using a Strict policy might deter some guests, as only 7% of listings use it. Evaluate if potential revenue protection outweighs possible lower booking rates.
- Regularly review your cancellation policy against competitors and market demand shifts in Dinant.
Dinant STR Booking Lead Time Analysis (2026)
Average Booking Lead Time by Month
Booking Lead Time Insights for Dinant
- The overall average booking lead time for vacation rentals in Dinant is 51 days.
- Guests book furthest in advance for stays during May (average 66 days), likely coinciding with peak travel demand or local events.
- The shortest booking windows occur for stays in February (average 32 days), indicating more last-minute travel plans during this time.
- Seasonally, Summer (59 days avg.) sees the longest lead times, while Winter (47 days avg.) has the shortest, reflecting typical travel planning cycles.
Recommendations for Hosts
- Use the overall average lead time (51 days) as a baseline for your pricing and availability strategy in Dinant.
- For May stays, consider implementing length-of-stay discounts or slightly higher rates for bookings made less than 66 days out to capitalize on advance planning.
- Target marketing efforts for the Summer season well in advance (at least 59 days) to capture early planners.
- Monitor your own booking lead times against these Dinant averages to identify opportunities for dynamic pricing adjustments.
Popular & Essential Airbnb Amenities in Dinant (2026)
Amenity Prevalence
Amenity Insights for Dinant
- Essential amenities in Dinant that guests expect include: Wifi. Lacking these (this) could significantly impact bookings.
- Popular amenities like Heating, Smoke alarm, Hot water are common but not universal. Offering these can provide a competitive edge.
Recommendations for Hosts
- Ensure your listing includes all essential amenities for Dinant: Wifi.
- Prioritize adding missing essentials: Wifi.
- Consider adding popular differentiators like Heating or Smoke alarm to increase appeal.
- Highlight unique or less common amenities you offer (e.g., hot tub, dedicated workspace, EV charger) in your listing description and photos.
- Regularly check competitor amenities in Dinant to stay competitive.
Dinant Airbnb Guest Demographics & Profile Analysis (2026)
Guest Profile Summary for Dinant
- The typical guest profile for Airbnb in Dinant consists of predominantly international visitors (74%), with top international origins including France, typically belonging to the Post-2000s (Gen Z/Alpha) group (50%), primarily speaking English or French.
- Domestic travelers account for 25.8% of guests.
- Key international markets include Belgium (25.8%) and France (19.3%).
- Top languages spoken are English (35.8%) followed by French (22.2%).
- A significant demographic segment is the Post-2000s (Gen Z/Alpha) group, representing 50% of guests.
Recommendations for Hosts
- Focus marketing internationally, particularly towards travelers from France.
- Tailor amenities and listing descriptions to appeal to the dominant Post-2000s (Gen Z/Alpha) demographic (e.g., highlight fast WiFi, smart home features, local guides).
- Highlight unique local experiences or amenities relevant to the primary guest profile.
- Consider seasonal promotions aligned with peak travel times for key origin markets.
Nearby Short-Term Rental Market Comparison
How does the Dinant Airbnb market stack up against its neighbors? Compare key performance metrics like average monthly revenue, ADR, and occupancy rates in surrounding areas to understand the broader regional STR landscape.
| Market | Active Properties | Monthly Revenue | Daily Rate | Avg. Occupancy |
|---|---|---|---|---|
| Raamsdonksveer | 16 | $7,756 | $736.17 | 38% |
| Haghorst | 11 | $5,995 | $480.40 | 40% |
| Mont-de-l'Enclus | 10 | $5,398 | $407.81 | 36% |
| Merksplas | 12 | $5,367 | $356.64 | 43% |
| Zerkegem | 10 | $4,846 | $437.71 | 57% |
| Anzegem | 10 | $4,425 | $460.61 | 35% |
| Incourt | 13 | $4,412 | $303.48 | 52% |
| Wellin | 12 | $4,365 | $446.64 | 42% |
| Aubel | 26 | $4,191 | $283.88 | 46% |
| Dizy | 11 | $4,106 | $250.48 | 49% |