Bièvre Airbnb Market Analysis 2026: Short Term Rental Data & Vacation Rental Statistics in Namur, Belgium
Is Airbnb profitable in Bièvre in 2026? Explore comprehensive Airbnb analytics for Bièvre, Namur, Belgium to uncover income potential. This 2026 STR market report for Bièvre, based on AirROI data from February 2025 to January 2026, reveals key trends in the niche market of 33 active listings.
Whether you're considering an Airbnb investment in Bièvre, optimizing your existing vacation rental, or exploring rental arbitrage opportunities, understanding the Bièvre Airbnb data is crucial. Leveraging the low regulation environment is key to maximizing your short term rental income potential. Let's dive into the specifics.
Key Bièvre Airbnb Performance Metrics Overview
Monthly Airbnb Revenue Variations & Income Potential in Bièvre (2026)
Understanding the monthly revenue variations for Airbnb listings in Bièvre is key to maximizing your short term rental income potential. Seasonality significantly impacts earnings. Our analysis, based on data from the past 12 months, shows that the peak revenue month for STRs in Bièvre is typically August, while January often presents the lowest earnings, highlighting opportunities for strategic pricing adjustments during shoulder and low seasons. Explore the typical Airbnb income in Bièvre across different performance tiers:
- Best-in-class properties (Top 10%) achieve $6,909+ monthly, often utilizing dynamic pricing and superior guest experiences.
- Strong performing properties (Top 25%) earn $3,464 or more, indicating effective management and desirable locations/amenities.
- Typical properties (Median) generate around $1,928 per month, representing the average market performance.
- Entry-level properties (Bottom 25%) see earnings around $1,050, often with potential for optimization.
Average Monthly Airbnb Earnings Trend in Bièvre
Bièvre Airbnb Occupancy Rate Trends (2026)
Maximize your bookings by understanding the Bièvre STR occupancy trends. Seasonal demand shifts significantly influence how often properties are booked. Typically, Augustsees the highest demand (peak season occupancy), while January experiences the lowest (low season). Effective strategies, like adjusting minimum stays or offering promotions, can boost occupancy during slower periods. Here's how different property tiers perform in Bièvre:
- Best-in-class properties (Top 10%) achieve 74%+ occupancy, indicating high desirability and potentially optimized availability.
- Strong performing properties (Top 25%) maintain 57% or higher occupancy, suggesting good market fit and guest satisfaction.
- Typical properties (Median) have an occupancy rate around 38%.
- Entry-level properties (Bottom 25%) average 23% occupancy, potentially facing higher vacancy.
Average Monthly Occupancy Rate Trend in Bièvre
Average Daily Rate (ADR) Airbnb Trends in Bièvre (2026)
Effective short term rental pricing strategy in Bièvre involves understanding monthly ADR fluctuations. The Average Daily Rate (ADR) for Airbnb in Bièvre typically peaks in July and dips lowest during November. Leveraging Airbnb dynamic pricing tools or strategies based on this seasonality can significantly boost revenue. Here's a look at the typical nightly rates achieved:
- Best-in-class properties (Top 10%) command rates of $505+ per night, often due to premium features or locations.
- Strong performing properties (Top 25%) achieve nightly rates of $353 or more.
- Typical properties (Median) charge around $169 per night.
- Entry-level properties (Bottom 25%) earn around $107 per night.
Average Daily Rate (ADR) Trend by Month in Bièvre
Get Live Bièvre Market Intelligence 👇

Explore Real-time Analytics
Airbnb Seasonality Analysis & Trends in Bièvre (2026)
Peak Season (August, July, October)
- Revenue averages $4,391 per month
- Occupancy rates average 54.8%
- Daily rates average $268
Shoulder Season
- Revenue averages $2,905 per month
- Occupancy maintains around 39.8%
- Daily rates hold near $264
Low Season (January, February, March)
- Revenue drops to average $1,875 per month
- Occupancy decreases to average 30.0%
- Daily rates adjust to average $256
Seasonality Insights for Bièvre
- The Airbnb seasonality in Bièvre shows highly seasonal trends requiring careful strategy. While the sections above show seasonal averages, it's also insightful to look at the extremes:
- During the high season, the absolute peak month showcases Bièvre's highest earning potential, with monthly revenues capable of climbing to $4,953, occupancy reaching a high of 60.3%, and ADRs peaking at $280.
- Conversely, the slowest single month of the year, typically falling within the low season, marks the market's lowest point. In this month, revenue might dip to $1,507, occupancy could drop to 25.7%, and ADRs may adjust down to $246.
- Understanding both the seasonal averages and these monthly peaks and troughs in revenue, occupancy, and ADR is crucial for maximizing your Airbnb profit potential in Bièvre.
Seasonal Strategies for Maximizing Profit
- Peak Season: Maximize revenue through premium pricing and potentially longer minimum stays. Ensure high availability.
- Low Season: Offer competitive pricing, special promotions (e.g., extended stay discounts), and flexible cancellation policies. Target off-season travelers like remote workers or budget-conscious guests.
- Shoulder Seasons: Implement dynamic pricing that balances peak and low rates. Target weekend travelers or specific events. Offer slightly more flexible terms than peak season.
- Regularly analyze your own performance against these Bièvre seasonality benchmarks and adjust your pricing and availability strategy accordingly.
Best Areas for Airbnb Investment in Bièvre (2026)
Exploring the top neighborhoods for short-term rentals in Bièvre? This section highlights key areas, outlining why they are attractive for hosts and guests, along with notable local attractions. Consider these locations based on your target guest profile and investment strategy.
| Neighborhood / Area | Why Host Here? (Target Guests & Appeal) | Key Attractions & Landmarks |
|---|---|---|
| Namur City Center | The heart of Namur, offering historical attractions and vibrant city life. Ideal for tourists looking to explore local culture, shops, and restaurants. | Citadel of Namur, St. Aubin's Cathedral, Namur's Old Town, The Meuse River Promenade, Theatre Royal, Museum of Arts |
| Dinant | A picturesque town located along the Meuse River, famed for its stunning views and rich history. Popular among tourists for its scenic beauty and outdoor activities. | Dinant Citadel, Collegiate Church of Notre Dame, Bayard Rock, Les Jardins d'Annevoie, Adventure Park, River Meuse canoeing |
| Yvoir | A charming town known for its natural beauty and proximity to outdoor activities. Great for those seeking tranquility and nature-centric experiences. | Yvoir Castle, Meuse Valley, Forest of Anseremme, Cycling paths, Kayaking on the Meuse, Chateau de La Hulpe |
| Namur Citadel | Tourists flock to the ancient citadel for breathtaking views and history. A great place for those interested in culture and heritage tourism. | Citadel of Namur, Fortifications, War Museum, Guided tours, Panoramic views of Namur, Scenic pathways |
| Sambreville | An under-the-radar area that's gaining popularity among visitors seeking a local experience. Offers access to nature and cultural sites. | Parc de la Sambre, Sambre River activities, Historical sites, Local markets, Nature walks, Cycling trails |
| Gembloux | A vibrant town known for its agriculture and rich landscapes. Ideal for those interested in a rural yet charming ambiance. | Gembloux Abbey, Botanical Garden, Rural hiking trails, Local farms, Cycling paths, Cultural Heritage sites |
| Château de Flawinne | An area surrounded by nature and history, perfect for leisure travelers who appreciate heritage and peaceful surroundings. | Château de Flawinne, Gardens, Nature walks, Historical tours, Bird watching, Local wildlife |
| Hastière | Beautifully located by the Meuse, this area offers opportunities for water sports and nature experiences. A gem for adventure seekers. | Hastière's nature reserve, Kayaking, Cycling paths, Visit local breweries, Scenic viewpoints, Walking trails along the river |
Understanding Airbnb License Requirements & STR Laws in Bièvre (2026)
While Bièvre, Namur, Belgium currently shows low STR regulations, specific Airbnb license requirements might still exist or change. Always verify the latest short term rental regulations and Airbnb license requirements directly with local government authorities for Bièvre to ensure full compliance before hosting.
(Source: AirROI data, 2026, finding no licensed listings among those analyzed)
Top Performing Airbnb Properties in Bièvre (2026)
Benchmark your potential! Explore examples of top-performing Airbnb properties in Bièvrebased on Trailing Twelve Month (TTM) revenue. Analyze their characteristics, revenue, occupancy rate, and ADR to understand what drives success in this market.

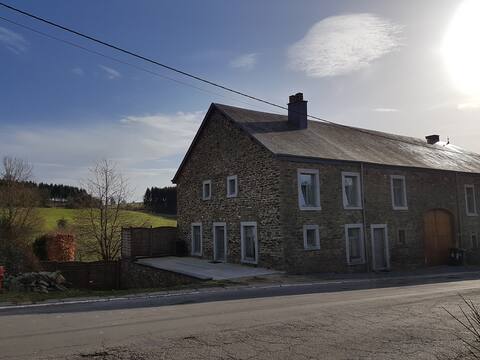
La Cahoute – Ardennes house
Entire Place • 5 bedrooms

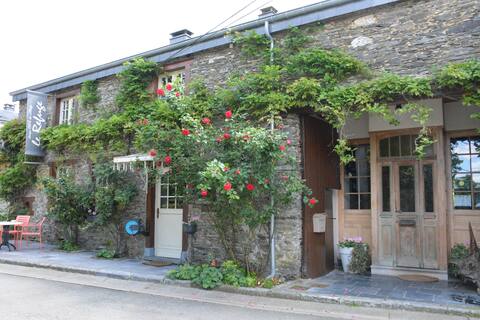
Les Moineaux, holiday home in Ardennes style!
Entire Place • 8 bedrooms
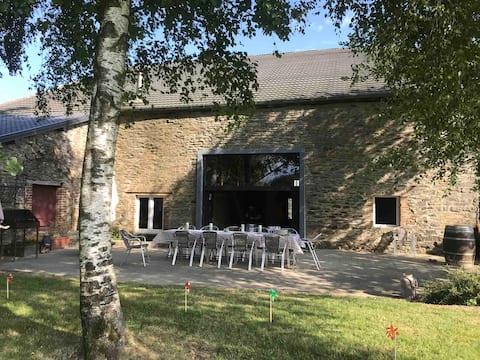
The Reeds
Entire Place • 4 bedrooms
Holiday Home in Biטvre with Terrace
Entire Place • 9 bedrooms

Vacation home in one of the most beautiful Ardennes villages
Entire Place • 6 bedrooms
La Ferme du Grand Frêne
Entire Place • 4 bedrooms
Note: Performance varies based on location, size, amenities, seasonality, and management quality. Data reflects the past 12 months.
Top Performing Airbnb Hosts in Bièvre (2026)
Learn from the best! This table showcases top-performing Airbnb hosts in Bièvre based on the number of properties managed and estimated total revenue over the past year. Analyze their scale and performance metrics.
| Host Name | Properties | Grossing Revenue | Stay Reviews | Avg Rating |
|---|---|---|---|---|
| Julien | 3 | $213,096 | 133 | 4.77/5.0 |
| Amber - BELVILLA | 4 | $104,758 | 57 | 4.76/5.0 |
| Ann | 2 | $83,475 | 456 | 4.70/5.0 |
| Johnny | 1 | $81,925 | 115 | 4.89/5.0 |
| Pascal | 2 | $80,679 | 28 | 4.86/5.0 |
| Pierre | 1 | $45,668 | 97 | 4.56/5.0 |
| Maaike | 1 | $39,195 | 28 | 4.96/5.0 |
| Frederika | 1 | $37,675 | 51 | 4.84/5.0 |
| Géraldine | 1 | $36,969 | 53 | 4.92/5.0 |
| Fabienne | 2 | $35,780 | 8 | 4.57/5.0 |
Analyzing the strategies of top hosts, such as their property selection, pricing, and guest communication, can offer valuable lessons for optimizing your own Airbnb operations in Bièvre.
Dive Deeper: Advanced Bièvre STR Market Data (2026)
Ready to unlock more insights? AirROI provides access to advanced metrics and comprehensive Airbnb data for Bièvre. Explore detailed analytics beyond this report to refine your investment strategy, optimize pricing, and maximize your vacation rental profits.
Explore Advanced MetricsBièvre Short-Term Rental Market Composition (2026): Property & Room Types
Room Type Distribution
Property Type Distribution
Market Composition Insights for Bièvre
- The Bièvre Airbnb market composition is heavily skewed towards Entire Home/Apt listings, which make up 87.9% of the 33 active rentals. This indicates strong guest preference for privacy and space.
- Looking at the property type distribution in Bièvre, House properties are the most common (72.7%), reflecting the local real estate landscape.
- Houses represent a significant 72.7% portion, catering likely to families or larger groups.
- The presence of 6.1% Hotel/Boutique listings indicates integration with traditional hospitality.
Bièvre Airbnb Room Capacity Analysis (2026): Bedroom Distribution
Distribution of Listings by Number of Bedrooms
Room Capacity Insights for Bièvre
- The dominant room capacity in Bièvre is 1 bedroom listings, making up 30.3% of the market. This suggests a strong demand for properties suitable for couples or solo travelers.
- Together, 1 bedroom and 4 bedrooms properties represent 51.5% of the active Airbnb listings in Bièvre, indicating a high concentration in these sizes.
- A significant 57.6% of listings offer 3+ bedrooms, catering to larger groups and families seeking more space in Bièvre.
Bièvre Vacation Rental Guest Capacity Trends (2026)
Distribution of Listings by Guest Capacity
Guest Capacity Insights for Bièvre
- The most common guest capacity trend in Bièvre vacation rentals is listings accommodating 8+ guests (39.4%). This suggests the primary traveler segment is likely larger groups.
- Properties designed for 8+ guests and 2 guests dominate the Bièvre STR market, accounting for 66.7% of listings.
- 54.5% of properties accommodate 6+ guests, serving the market segment for larger families or group travel in Bièvre.
- On average, properties in Bièvre are equipped to host 5.2 guests.
Bièvre Airbnb Booking Patterns (2026): Available vs. Booked Days
Available Days Distribution
Booked Days Distribution
Booking Pattern Insights for Bièvre
- The most common availability pattern in Bièvre falls within the 271-366 days range, representing 39.4% of listings. This suggests many properties have significant open periods on their calendars.
- Approximately 75.8% of listings show high availability (181+ days open annually), indicating potential for increased bookings or specific owner usage patterns.
- For booked days, the 91-180 days range is most frequent in Bièvre (36.4%), reflecting common guest stay durations or potential owner blocking patterns.
- A notable 24.3% of properties secure long booking periods (181+ days booked per year), highlighting successful long-term rental strategies or significant owner usage.
Bièvre Airbnb Minimum Stay Requirements Analysis
Distribution of Listings by Minimum Night Requirement
1 Night
6 listings
18.2% of total
2 Nights
18 listings
54.5% of total
30+ Nights
9 listings
27.3% of total
Key Insights
- The most prevalent minimum stay requirement in Bièvre is 2 Nights, adopted by 54.5% of listings. This highlights the market's preference for shorter, flexible bookings.
- A strong majority (72.7%) of the Bièvre Airbnb data shows acceptance of very short stays (1-2 nights), indicating a dynamic, high-turnover market.
- A significant segment (27.3%) caters to monthly stays (30+ nights) in Bièvre, pointing to opportunities in the extended-stay market.
Recommendations
- Align with the market by considering a 2 Nights minimum stay, as 54.5% of Bièvre hosts use this setting.
- If feasible, allowing 1-night stays, especially midweek or during low season, could capture last-minute bookings, as only 18.2% currently do.
- A 2-night minimum appears standard (54.5%). Consider this for weekends or peak periods.
- Explore offering discounts for stays of 30+ nights to attract the 27.3% of the market seeking extended stays.
- Adjust minimum nights based on seasonality – potentially shorter during low season and longer during peak demand periods in Bièvre.
Bièvre Airbnb Cancellation Policy Trends Analysis (2026)
Super Strict 30 Days
1 listings
3% of total
Flexible
4 listings
12.1% of total
Moderate
9 listings
27.3% of total
Firm
14 listings
42.4% of total
Strict
5 listings
15.2% of total
Cancellation Policy Insights for Bièvre
- The prevailing Airbnb cancellation policy trend in Bièvre is Firm, used by 42.4% of listings.
- A majority (57.6%) of hosts in Bièvre utilize Firm or Strict policies, indicating a market where hosts prioritize booking security.
Recommendations for Hosts
- Consider adopting a Firm policy to align with the 42.4% market standard in Bièvre.
- Regularly review your cancellation policy against competitors and market demand shifts in Bièvre.
Bièvre STR Booking Lead Time Analysis (2026)
Average Booking Lead Time by Month
Booking Lead Time Insights for Bièvre
- The overall average booking lead time for vacation rentals in Bièvre is 81 days.
- Guests book furthest in advance for stays during August (average 93 days), likely coinciding with peak travel demand or local events.
- The shortest booking windows occur for stays in February (average 33 days), indicating more last-minute travel plans during this time.
- Seasonally, Summer (85 days avg.) sees the longest lead times, while Winter (54 days avg.) has the shortest, reflecting typical travel planning cycles.
Recommendations for Hosts
- Use the overall average lead time (81 days) as a baseline for your pricing and availability strategy in Bièvre.
- For August stays, consider implementing length-of-stay discounts or slightly higher rates for bookings made less than 93 days out to capitalize on advance planning.
- Target marketing efforts for the Summer season well in advance (at least 85 days) to capture early planners.
- Monitor your own booking lead times against these Bièvre averages to identify opportunities for dynamic pricing adjustments.
Popular & Essential Airbnb Amenities in Bièvre (2026)
Amenity Prevalence
Amenity Insights for Bièvre
- Essential amenities in Bièvre that guests expect include: Heating. Lacking these (this) could significantly impact bookings.
- Popular amenities like Wifi, Coffee maker, Kitchen are common but not universal. Offering these can provide a competitive edge.
- Warning: Wifi is not universally provided but is considered essential globally. Ensure reliable Wifi is offered.
Recommendations for Hosts
- Ensure your listing includes all essential amenities for Bièvre: Heating.
- Prioritize adding missing essentials: Heating.
- Consider adding popular differentiators like Wifi or Coffee maker to increase appeal.
- Highlight unique or less common amenities you offer (e.g., hot tub, dedicated workspace, EV charger) in your listing description and photos.
- Regularly check competitor amenities in Bièvre to stay competitive.
Bièvre Airbnb Guest Demographics & Profile Analysis (2026)
Guest Profile Summary for Bièvre
- The typical guest profile for Airbnb in Bièvre consists of a mix of domestic (54%) and international guests, often arriving from nearby Antwerp, typically belonging to the Post-2000s (Gen Z/Alpha) group (50%), primarily speaking English or French.
- Domestic travelers account for 54.0% of guests.
- Key international markets include Belgium (54%) and Netherlands (20%).
- Top languages spoken are English (35.4%) followed by French (22.9%).
- A significant demographic segment is the Post-2000s (Gen Z/Alpha) group, representing 50% of guests.
Recommendations for Hosts
- Balance marketing efforts between domestic and international channels based on the guest mix.
- Tailor amenities and listing descriptions to appeal to the dominant Post-2000s (Gen Z/Alpha) demographic (e.g., highlight fast WiFi, smart home features, local guides).
- Highlight unique local experiences or amenities relevant to the primary guest profile.
- Consider seasonal promotions aligned with peak travel times for key origin markets.
Nearby Short-Term Rental Market Comparison
How does the Bièvre Airbnb market stack up against its neighbors? Compare key performance metrics like average monthly revenue, ADR, and occupancy rates in surrounding areas to understand the broader regional STR landscape.
| Market | Active Properties | Monthly Revenue | Daily Rate | Avg. Occupancy |
|---|---|---|---|---|
| Incourt | 13 | $4,412 | $303.48 | 52% |
| Wellin | 12 | $4,365 | $446.64 | 42% |
| Aubel | 26 | $4,191 | $283.88 | 46% |
| Dion | 12 | $4,104 | $270.32 | 50% |
| Bertogne | 26 | $3,839 | $325.90 | 42% |
| Mettet | 21 | $3,771 | $283.66 | 42% |
| Samrée | 18 | $3,497 | $375.75 | 31% |
| Momignies | 12 | $3,451 | $311.61 | 42% |
| Heers | 30 | $3,405 | $294.43 | 39% |
| Chiny | 21 | $3,403 | $261.76 | 40% |