Vielsalm Airbnb Market Analysis 2026: Short Term Rental Data & Vacation Rental Statistics in Luxembourg, Belgium
Is Airbnb profitable in Vielsalm in 2026? Explore comprehensive Airbnb analytics for Vielsalm, Luxembourg, Belgium to uncover income potential. This 2026 STR market report for Vielsalm, based on AirROI data from February 2025 to January 2026, reveals key trends in the niche market of 98 active listings.
Whether you're considering an Airbnb investment in Vielsalm, optimizing your existing vacation rental, or exploring rental arbitrage opportunities, understanding the Vielsalm Airbnb data is crucial. Leveraging the low regulation environment is key to maximizing your short term rental income potential. Let's dive into the specifics.
Key Vielsalm Airbnb Performance Metrics Overview
Monthly Airbnb Revenue Variations & Income Potential in Vielsalm (2026)
Understanding the monthly revenue variations for Airbnb listings in Vielsalm is key to maximizing your short term rental income potential. Seasonality significantly impacts earnings. Our analysis, based on data from the past 12 months, shows that the peak revenue month for STRs in Vielsalm is typically August, while January often presents the lowest earnings, highlighting opportunities for strategic pricing adjustments during shoulder and low seasons. Explore the typical Airbnb income in Vielsalm across different performance tiers:
- Best-in-class properties (Top 10%) achieve $7,316+ monthly, often utilizing dynamic pricing and superior guest experiences.
- Strong performing properties (Top 25%) earn $4,091 or more, indicating effective management and desirable locations/amenities.
- Typical properties (Median) generate around $2,169 per month, representing the average market performance.
- Entry-level properties (Bottom 25%) see earnings around $1,126, often with potential for optimization.
Average Monthly Airbnb Earnings Trend in Vielsalm
Vielsalm Airbnb Occupancy Rate Trends (2026)
Maximize your bookings by understanding the Vielsalm STR occupancy trends. Seasonal demand shifts significantly influence how often properties are booked. Typically, Augustsees the highest demand (peak season occupancy), while January experiences the lowest (low season). Effective strategies, like adjusting minimum stays or offering promotions, can boost occupancy during slower periods. Here's how different property tiers perform in Vielsalm:
- Best-in-class properties (Top 10%) achieve 77%+ occupancy, indicating high desirability and potentially optimized availability.
- Strong performing properties (Top 25%) maintain 59% or higher occupancy, suggesting good market fit and guest satisfaction.
- Typical properties (Median) have an occupancy rate around 38%.
- Entry-level properties (Bottom 25%) average 20% occupancy, potentially facing higher vacancy.
Average Monthly Occupancy Rate Trend in Vielsalm
Average Daily Rate (ADR) Airbnb Trends in Vielsalm (2026)
Effective short term rental pricing strategy in Vielsalm involves understanding monthly ADR fluctuations. The Average Daily Rate (ADR) for Airbnb in Vielsalm typically peaks in July and dips lowest during March. Leveraging Airbnb dynamic pricing tools or strategies based on this seasonality can significantly boost revenue. Here's a look at the typical nightly rates achieved:
- Best-in-class properties (Top 10%) command rates of $627+ per night, often due to premium features or locations.
- Strong performing properties (Top 25%) achieve nightly rates of $329 or more.
- Typical properties (Median) charge around $192 per night.
- Entry-level properties (Bottom 25%) earn around $123 per night.
Average Daily Rate (ADR) Trend by Month in Vielsalm
Get Live Vielsalm Market Intelligence 👇

Explore Real-time Analytics
Airbnb Seasonality Analysis & Trends in Vielsalm (2026)
Peak Season (August, October, July)
- Revenue averages $4,483 per month
- Occupancy rates average 55.5%
- Daily rates average $320
Shoulder Season
- Revenue averages $3,284 per month
- Occupancy maintains around 40.7%
- Daily rates hold near $309
Low Season (January, February, March)
- Revenue drops to average $2,188 per month
- Occupancy decreases to average 28.7%
- Daily rates adjust to average $295
Seasonality Insights for Vielsalm
- The Airbnb seasonality in Vielsalm shows highly seasonal trends requiring careful strategy. While the sections above show seasonal averages, it's also insightful to look at the extremes:
- During the high season, the absolute peak month showcases Vielsalm's highest earning potential, with monthly revenues capable of climbing to $4,818, occupancy reaching a high of 60.7%, and ADRs peaking at $327.
- Conversely, the slowest single month of the year, typically falling within the low season, marks the market's lowest point. In this month, revenue might dip to $1,945, occupancy could drop to 21.4%, and ADRs may adjust down to $286.
- Understanding both the seasonal averages and these monthly peaks and troughs in revenue, occupancy, and ADR is crucial for maximizing your Airbnb profit potential in Vielsalm.
Seasonal Strategies for Maximizing Profit
- Peak Season: Maximize revenue through premium pricing and potentially longer minimum stays. Ensure high availability.
- Low Season: Offer competitive pricing, special promotions (e.g., extended stay discounts), and flexible cancellation policies. Target off-season travelers like remote workers or budget-conscious guests.
- Shoulder Seasons: Implement dynamic pricing that balances peak and low rates. Target weekend travelers or specific events. Offer slightly more flexible terms than peak season.
- Regularly analyze your own performance against these Vielsalm seasonality benchmarks and adjust your pricing and availability strategy accordingly.
Best Areas for Airbnb Investment in Vielsalm (2026)
Exploring the top neighborhoods for short-term rentals in Vielsalm? This section highlights key areas, outlining why they are attractive for hosts and guests, along with notable local attractions. Consider these locations based on your target guest profile and investment strategy.
| Neighborhood / Area | Why Host Here? (Target Guests & Appeal) | Key Attractions & Landmarks |
|---|---|---|
| Vielsalm Center | The heart of Vielsalm offers charming local shops, cafes, and restaurants. Ideal for tourists wanting to explore the cultural and historical aspects of the town. | Vielsalm Museum, The Church of St. Peter, Castle of Vielsalm, Local markets, Salm River |
| Baugnez | Famous for its historical significance during World War II, Baugnez attracts history buffs. A peaceful countryside location with a rich heritage. | Baugnez 44 Historical Center, Battle of the Bulge sites, Countryside walks, Scenic viewpoints |
| La Vôge | Known for its stunning natural landscapes, ideal for outdoor enthusiasts looking to hike, bike, or enjoy nature retreats. | Hiking trails, Jalhay Forest, La Vôge Nature Park, Scenic drives, Wildlife spotting |
| Lac de la Gileppe | A beautiful lake surrounded by nature, perfect for water sports and relaxations. Popular for families and vacationers seeking a serene spot. | Lac de la Gileppe, Water sports activities, Picnic areas, Walking paths |
| Salmchâteau | A picturesque village that offers a tranquil setting and is close to nature, making it a hidden gem for visitors seeking peace. | Salmchâteau Castle ruins, Nature trails, Village charm, Local history |
| Hautes Fagnes | Part of a protected natural park, this area is perfect for hiking and nature observation. Great for eco-tourists and adventure seekers. | Hautes Fagnes Nature Reserve, Hiking and biking paths, Biodiversity spots |
| Malmédy | A lively town known for its festivals and events throughout the year, attracting tourists interested in local culture and celebrations. | Malmédy Cathedral, Historical town center, Local festivals, Art galleries |
| Stavelot | Rich in history and culture, Stavelot is home to several museums and is close to famous natural sites. Attracts culture enthusiasts. | Stavelot Abbey, Museum of the Potato, Beautiful countryside |
Understanding Airbnb License Requirements & STR Laws in Vielsalm (2026)
While Vielsalm, Luxembourg, Belgium currently shows low STR regulations, specific Airbnb license requirements might still exist or change. Always verify the latest short term rental regulations and Airbnb license requirements directly with local government authorities for Vielsalm to ensure full compliance before hosting.
(Source: AirROI data, 2026, based on 1% licensed listings)
Top Performing Airbnb Properties in Vielsalm (2026)
Benchmark your potential! Explore examples of top-performing Airbnb properties in Vielsalmbased on Trailing Twelve Month (TTM) revenue. Analyze their characteristics, revenue, occupancy rate, and ADR to understand what drives success in this market.
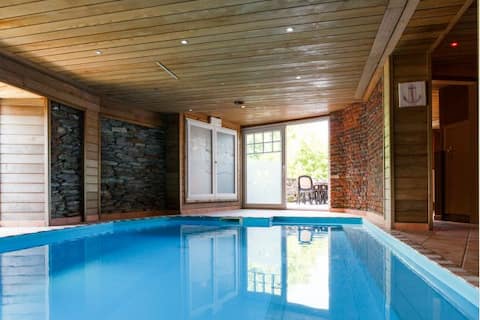
Beautiful cottage with pool, sauna and jacuzzi
Entire Place • 3 bedrooms
Gîte - Li Badet 19 people - Jacuzzi - Sauna
Entire Place • 8 bedrooms

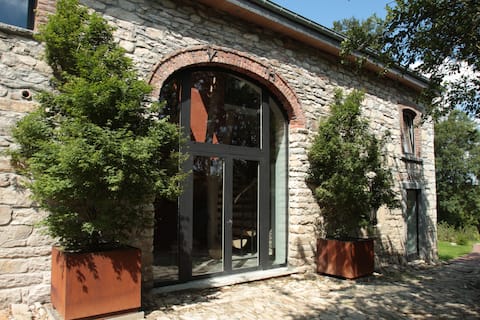
House close to Vielsalm with beautiful views
Entire Place • 4 bedrooms

Luxurious chalet with bar near Baraque de Fraiture
Entire Place • 4 bedrooms
Villa BelleVue Wellness & Jardin
Entire Place • 17 bedrooms

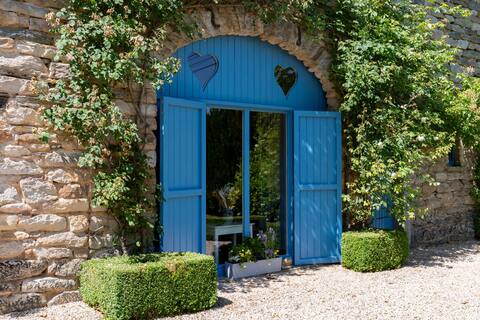
Spacious family house with garden, recreation & beautiful view
Entire Place • 7 bedrooms
Note: Performance varies based on location, size, amenities, seasonality, and management quality. Data reflects the past 12 months.
Top Performing Airbnb Hosts in Vielsalm (2026)
Learn from the best! This table showcases top-performing Airbnb hosts in Vielsalm based on the number of properties managed and estimated total revenue over the past year. Analyze their scale and performance metrics.
| Host Name | Properties | Grossing Revenue | Stay Reviews | Avg Rating |
|---|---|---|---|---|
| Corinne | 2 | $293,915 | 106 | 4.86/5.0 |
| Michel Et Isabelle | 2 | $177,719 | 165 | 4.75/5.0 |
| Anouk - BELVILLA | 14 | $151,971 | 219 | 4.48/5.0 |
| Katrien | 1 | $124,525 | 37 | 4.95/5.0 |
| Kristof | 1 | $108,863 | 57 | 4.93/5.0 |
| Lara | 1 | $104,769 | 20 | 4.30/5.0 |
| Jelle | 1 | $100,414 | 101 | 4.78/5.0 |
| Sybrand | 1 | $81,889 | 6 | 4.50/5.0 |
| Gorik | 1 | $74,440 | 54 | 4.74/5.0 |
| Edwina | 1 | $74,129 | 13 | 5.00/5.0 |
Analyzing the strategies of top hosts, such as their property selection, pricing, and guest communication, can offer valuable lessons for optimizing your own Airbnb operations in Vielsalm.
Dive Deeper: Advanced Vielsalm STR Market Data (2026)
Ready to unlock more insights? AirROI provides access to advanced metrics and comprehensive Airbnb data for Vielsalm. Explore detailed analytics beyond this report to refine your investment strategy, optimize pricing, and maximize your vacation rental profits.
Explore Advanced MetricsVielsalm Short-Term Rental Market Composition (2026): Property & Room Types
Room Type Distribution
Property Type Distribution
Market Composition Insights for Vielsalm
- The Vielsalm Airbnb market composition is heavily skewed towards Entire Home/Apt listings, which make up 90.8% of the 98 active rentals. This indicates strong guest preference for privacy and space.
- Looking at the property type distribution in Vielsalm, House properties are the most common (76.5%), reflecting the local real estate landscape.
- Houses represent a significant 76.5% portion, catering likely to families or larger groups.
- Smaller segments like outdoor/unique, hotel/boutique, others (combined 9.2%) offer potential for unique stay experiences.
Vielsalm Airbnb Room Capacity Analysis (2026): Bedroom Distribution
Distribution of Listings by Number of Bedrooms
Room Capacity Insights for Vielsalm
- The dominant room capacity in Vielsalm is 2 bedrooms listings, making up 20.4% of the market. This suggests a strong demand for properties suitable for couples or solo travelers.
- Together, 2 bedrooms and 3 bedrooms properties represent 39.8% of the active Airbnb listings in Vielsalm, indicating a high concentration in these sizes.
- A significant 55.1% of listings offer 3+ bedrooms, catering to larger groups and families seeking more space in Vielsalm.
Vielsalm Vacation Rental Guest Capacity Trends (2026)
Distribution of Listings by Guest Capacity
Guest Capacity Insights for Vielsalm
- The most common guest capacity trend in Vielsalm vacation rentals is listings accommodating 8+ guests (40.8%). This suggests the primary traveler segment is likely larger groups.
- Properties designed for 8+ guests and 6 guests dominate the Vielsalm STR market, accounting for 57.1% of listings.
- 59.1% of properties accommodate 6+ guests, serving the market segment for larger families or group travel in Vielsalm.
- On average, properties in Vielsalm are equipped to host 5.6 guests.
Vielsalm Airbnb Booking Patterns (2026): Available vs. Booked Days
Available Days Distribution
Booked Days Distribution
Booking Pattern Insights for Vielsalm
- The most common availability pattern in Vielsalm falls within the 271-366 days range, representing 45.9% of listings. This suggests many properties have significant open periods on their calendars.
- Approximately 73.5% of listings show high availability (181+ days open annually), indicating potential for increased bookings or specific owner usage patterns.
- For booked days, the 91-180 days range is most frequent in Vielsalm (27.6%), reflecting common guest stay durations or potential owner blocking patterns.
- A notable 27.5% of properties secure long booking periods (181+ days booked per year), highlighting successful long-term rental strategies or significant owner usage.
Vielsalm Airbnb Minimum Stay Requirements Analysis
Distribution of Listings by Minimum Night Requirement
1 Night
18 listings
18.6% of total
2 Nights
43 listings
44.3% of total
3 Nights
1 listings
1% of total
30+ Nights
35 listings
36.1% of total
Key Insights
- The most prevalent minimum stay requirement in Vielsalm is 2 Nights, adopted by 44.3% of listings. This highlights the market's preference for shorter, flexible bookings.
- A strong majority (62.9%) of the Vielsalm Airbnb data shows acceptance of very short stays (1-2 nights), indicating a dynamic, high-turnover market.
- A significant segment (36.1%) caters to monthly stays (30+ nights) in Vielsalm, pointing to opportunities in the extended-stay market.
Recommendations
- Align with the market by considering a 2 Nights minimum stay, as 44.3% of Vielsalm hosts use this setting.
- If feasible, allowing 1-night stays, especially midweek or during low season, could capture last-minute bookings, as only 18.6% currently do.
- A 2-night minimum appears standard (44.3%). Consider this for weekends or peak periods.
- Explore offering discounts for stays of 30+ nights to attract the 36.1% of the market seeking extended stays.
- Adjust minimum nights based on seasonality – potentially shorter during low season and longer during peak demand periods in Vielsalm.
Vielsalm Airbnb Cancellation Policy Trends Analysis (2026)
Super Strict 60 Days
3 listings
3.1% of total
Super Strict 30 Days
2 listings
2.1% of total
Limited
3 listings
3.1% of total
Flexible
10 listings
10.3% of total
Moderate
24 listings
24.7% of total
Firm
41 listings
42.3% of total
Strict
14 listings
14.4% of total
Cancellation Policy Insights for Vielsalm
- The prevailing Airbnb cancellation policy trend in Vielsalm is Firm, used by 42.3% of listings.
- A majority (56.7%) of hosts in Vielsalm utilize Firm or Strict policies, indicating a market where hosts prioritize booking security.
Recommendations for Hosts
- Consider adopting a Firm policy to align with the 42.3% market standard in Vielsalm.
- Using a Strict policy might deter some guests, as only 14.4% of listings use it. Evaluate if potential revenue protection outweighs possible lower booking rates.
- Regularly review your cancellation policy against competitors and market demand shifts in Vielsalm.
Vielsalm STR Booking Lead Time Analysis (2026)
Average Booking Lead Time by Month
Booking Lead Time Insights for Vielsalm
- The overall average booking lead time for vacation rentals in Vielsalm is 79 days.
- Guests book furthest in advance for stays during July (average 115 days), likely coinciding with peak travel demand or local events.
- The shortest booking windows occur for stays in February (average 43 days), indicating more last-minute travel plans during this time.
- Seasonally, Summer (97 days avg.) sees the longest lead times, while Winter (66 days avg.) has the shortest, reflecting typical travel planning cycles.
Recommendations for Hosts
- Use the overall average lead time (79 days) as a baseline for your pricing and availability strategy in Vielsalm.
- For July stays, consider implementing length-of-stay discounts or slightly higher rates for bookings made less than 115 days out to capitalize on advance planning.
- Target marketing efforts for the Summer season well in advance (at least 97 days) to capture early planners.
- Monitor your own booking lead times against these Vielsalm averages to identify opportunities for dynamic pricing adjustments.
Popular & Essential Airbnb Amenities in Vielsalm (2026)
Amenity Prevalence
Amenity Insights for Vielsalm
- Popular amenities like Kitchen, Heating, Wifi are common but not universal. Offering these can provide a competitive edge.
- Warning: Wifi is not universally provided but is considered essential globally. Ensure reliable Wifi is offered.
Recommendations for Hosts
- Consider adding popular differentiators like Kitchen or Heating to increase appeal.
- Highlight unique or less common amenities you offer (e.g., hot tub, dedicated workspace, EV charger) in your listing description and photos.
- Regularly check competitor amenities in Vielsalm to stay competitive.
Vielsalm Airbnb Guest Demographics & Profile Analysis (2026)
Guest Profile Summary for Vielsalm
- The typical guest profile for Airbnb in Vielsalm consists of a mix of domestic (38%) and international guests, with top international origins including Netherlands, typically belonging to the Post-2000s (Gen Z/Alpha) group (50%), primarily speaking English or Dutch.
- Domestic travelers account for 38.3% of guests.
- Key international markets include Belgium (38.3%) and Netherlands (29.2%).
- Top languages spoken are English (36.3%) followed by Dutch (20.6%).
- A significant demographic segment is the Post-2000s (Gen Z/Alpha) group, representing 50% of guests.
Recommendations for Hosts
- Focus marketing internationally, particularly towards travelers from Netherlands.
- Tailor amenities and listing descriptions to appeal to the dominant Post-2000s (Gen Z/Alpha) demographic (e.g., highlight fast WiFi, smart home features, local guides).
- Highlight unique local experiences or amenities relevant to the primary guest profile.
- Consider seasonal promotions aligned with peak travel times for key origin markets.
Nearby Short-Term Rental Market Comparison
How does the Vielsalm Airbnb market stack up against its neighbors? Compare key performance metrics like average monthly revenue, ADR, and occupancy rates in surrounding areas to understand the broader regional STR landscape.
| Market | Active Properties | Monthly Revenue | Daily Rate | Avg. Occupancy |
|---|---|---|---|---|
| Raamsdonksveer | 16 | $7,756 | $736.17 | 38% |
| Haghorst | 11 | $5,995 | $480.40 | 40% |
| Baarlo | 20 | $5,442 | $332.61 | 51% |
| Merksplas | 12 | $5,367 | $356.64 | 43% |
| Incourt | 13 | $4,412 | $303.48 | 52% |
| Wellin | 12 | $4,365 | $446.64 | 42% |
| Aubel | 26 | $4,191 | $283.88 | 46% |
| Dion | 12 | $4,104 | $270.32 | 50% |
| Bertogne | 26 | $3,839 | $325.90 | 42% |
| Mettet | 21 | $3,771 | $283.66 | 42% |