Nassogne Airbnb Market Analysis 2026: Short Term Rental Data & Vacation Rental Statistics in Luxembourg, Belgium
Is Airbnb profitable in Nassogne in 2026? Explore comprehensive Airbnb analytics for Nassogne, Luxembourg, Belgium to uncover income potential. This 2026 STR market report for Nassogne, based on AirROI data from February 2025 to January 2026, reveals key trends in the niche market of 38 active listings.
Whether you're considering an Airbnb investment in Nassogne, optimizing your existing vacation rental, or exploring rental arbitrage opportunities, understanding the Nassogne Airbnb data is crucial. Leveraging the low regulation environment is key to maximizing your short term rental income potential. Let's dive into the specifics.
Key Nassogne Airbnb Performance Metrics Overview
Monthly Airbnb Revenue Variations & Income Potential in Nassogne (2026)
Understanding the monthly revenue variations for Airbnb listings in Nassogne is key to maximizing your short term rental income potential. Seasonality significantly impacts earnings. Our analysis, based on data from the past 12 months, shows that the peak revenue month for STRs in Nassogne is typically August, while January often presents the lowest earnings, highlighting opportunities for strategic pricing adjustments during shoulder and low seasons. Explore the typical Airbnb income in Nassogne across different performance tiers:
- Best-in-class properties (Top 10%) achieve $4,897+ monthly, often utilizing dynamic pricing and superior guest experiences.
- Strong performing properties (Top 25%) earn $2,975 or more, indicating effective management and desirable locations/amenities.
- Typical properties (Median) generate around $1,649 per month, representing the average market performance.
- Entry-level properties (Bottom 25%) see earnings around $857, often with potential for optimization.
Average Monthly Airbnb Earnings Trend in Nassogne
Nassogne Airbnb Occupancy Rate Trends (2026)
Maximize your bookings by understanding the Nassogne STR occupancy trends. Seasonal demand shifts significantly influence how often properties are booked. Typically, Julysees the highest demand (peak season occupancy), while January experiences the lowest (low season). Effective strategies, like adjusting minimum stays or offering promotions, can boost occupancy during slower periods. Here's how different property tiers perform in Nassogne:
- Best-in-class properties (Top 10%) achieve 77%+ occupancy, indicating high desirability and potentially optimized availability.
- Strong performing properties (Top 25%) maintain 63% or higher occupancy, suggesting good market fit and guest satisfaction.
- Typical properties (Median) have an occupancy rate around 36%.
- Entry-level properties (Bottom 25%) average 18% occupancy, potentially facing higher vacancy.
Average Monthly Occupancy Rate Trend in Nassogne
Average Daily Rate (ADR) Airbnb Trends in Nassogne (2026)
Effective short term rental pricing strategy in Nassogne involves understanding monthly ADR fluctuations. The Average Daily Rate (ADR) for Airbnb in Nassogne typically peaks in September and dips lowest during February. Leveraging Airbnb dynamic pricing tools or strategies based on this seasonality can significantly boost revenue. Here's a look at the typical nightly rates achieved:
- Best-in-class properties (Top 10%) command rates of $421+ per night, often due to premium features or locations.
- Strong performing properties (Top 25%) achieve nightly rates of $282 or more.
- Typical properties (Median) charge around $142 per night.
- Entry-level properties (Bottom 25%) earn around $109 per night.
Average Daily Rate (ADR) Trend by Month in Nassogne
Get Live Nassogne Market Intelligence 👇

Explore Real-time Analytics
Airbnb Seasonality Analysis & Trends in Nassogne (2026)
Peak Season (August, July, October)
- Revenue averages $2,972 per month
- Occupancy rates average 51.8%
- Daily rates average $221
Shoulder Season
- Revenue averages $2,052 per month
- Occupancy maintains around 39.2%
- Daily rates hold near $219
Low Season (January, February, March)
- Revenue drops to average $1,684 per month
- Occupancy decreases to average 34.8%
- Daily rates adjust to average $211
Seasonality Insights for Nassogne
- The Airbnb seasonality in Nassogne shows highly seasonal trends requiring careful strategy. While the sections above show seasonal averages, it's also insightful to look at the extremes:
- During the high season, the absolute peak month showcases Nassogne's highest earning potential, with monthly revenues capable of climbing to $3,135, occupancy reaching a high of 57.3%, and ADRs peaking at $233.
- Conversely, the slowest single month of the year, typically falling within the low season, marks the market's lowest point. In this month, revenue might dip to $1,567, occupancy could drop to 27.9%, and ADRs may adjust down to $199.
- Understanding both the seasonal averages and these monthly peaks and troughs in revenue, occupancy, and ADR is crucial for maximizing your Airbnb profit potential in Nassogne.
Seasonal Strategies for Maximizing Profit
- Peak Season: Maximize revenue through premium pricing and potentially longer minimum stays. Ensure high availability.
- Low Season: Offer competitive pricing, special promotions (e.g., extended stay discounts), and flexible cancellation policies. Target off-season travelers like remote workers or budget-conscious guests.
- Shoulder Seasons: Implement dynamic pricing that balances peak and low rates. Target weekend travelers or specific events. Offer slightly more flexible terms than peak season.
- Regularly analyze your own performance against these Nassogne seasonality benchmarks and adjust your pricing and availability strategy accordingly.
Best Areas for Airbnb Investment in Nassogne (2026)
Exploring the top neighborhoods for short-term rentals in Nassogne? This section highlights key areas, outlining why they are attractive for hosts and guests, along with notable local attractions. Consider these locations based on your target guest profile and investment strategy.
| Neighborhood / Area | Why Host Here? (Target Guests & Appeal) | Key Attractions & Landmarks |
|---|---|---|
| Nassogne Village | Charming village atmosphere with scenic views and a peaceful environment. Excellent for visitors looking to experience the tranquility of the Ardennes region while being close to nature. | Nassogne Forest, Café des Moulins, Eglise Saint-Martin, Local hiking trails, Historical sites |
| Lavaux-Sainte-Anne | Famous for its beautiful castle and surrounding nature. Attracts families and history enthusiasts seeking a unique local experience. | Castle of Lavaux-Sainte-Anne, Nature reserve, Outdoor picnic areas, Cultural festivals, Local artisan shops |
| Soy | A small picturesque village with stunning landscapes and traditional Belgian architecture. Great for nature lovers looking to escape into the countryside. | Soy Waterfall, Local hiking paths, Artisan cheese shops, Historic buildings, Scenic photography spots |
| Ciergnon | Famous for its natural beauty and proximity to the Ardennes. Ideal for outdoor enthusiasts and those looking for serenity away from urban life. | Ardennes Forest, Hiking trails, Biking routes, Local wildlife, Scenic viewpoints |
| Wellin | Known for its limestone caves and hiking trails. Attractions here allow for both adventure and relaxation in a natural setting. | Caves of Wellin, Local vineyards, Hiking and cycling paths, Cultural events, Natural parks |
| Saint-Hubert | A popular destination for hunting and nature walks, offering a serene environment with rich wildlife. Perfect for eco-tourism. | Saint-Hubert Basilica, Wildlife parks, Nature reserves, Hiking trails, Local gastronomy |
| Marche-en-Famenne | A vibrant small town with a rich history and a lively market. Attractive to visitors seeking cultural experiences and local cuisine. | Famenne Museum, Historic town square, Weekly markets, Local restaurants, Cultural events |
| Jambes | Close to Namur, allows visitors to explore a classic Belgian city while staying in a quieter area. Perfect for day trips to the city. | Citadel of Namur, Sambre River, Local parks, Cultural festivals, Shopping areas |
Understanding Airbnb License Requirements & STR Laws in Nassogne (2026)
While Nassogne, Luxembourg, Belgium currently shows low STR regulations, specific Airbnb license requirements might still exist or change. Always verify the latest short term rental regulations and Airbnb license requirements directly with local government authorities for Nassogne to ensure full compliance before hosting.
(Source: AirROI data, 2026, finding no licensed listings among those analyzed)
Top Performing Airbnb Properties in Nassogne (2026)
Benchmark your potential! Explore examples of top-performing Airbnb properties in Nassognebased on Trailing Twelve Month (TTM) revenue. Analyze their characteristics, revenue, occupancy rate, and ADR to understand what drives success in this market.
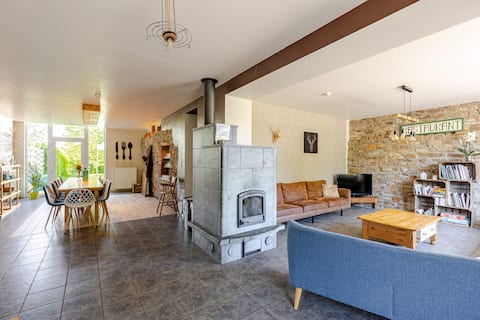
L'air du feu, cottage for 2-14 people in Bande/Nassogne
Entire Place • 5 bedrooms
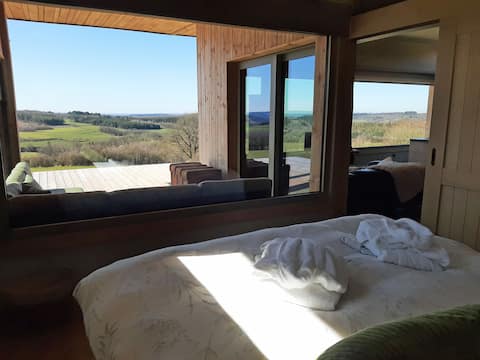
Nassogreen - The View
Entire Place • 2 bedrooms
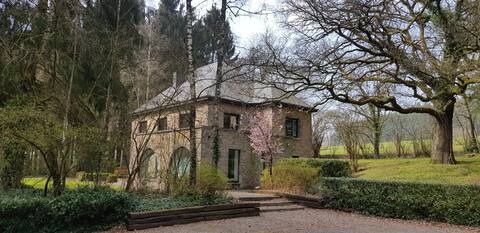
Villa in the middle of spruce trees - Portal of the Ardennes
Entire Place • 5 bedrooms

Gîte de la ChèBrerie
Entire Place • 2 bedrooms

Nassogreen - Cottage on the hills
Entire Place • 1 bedroom

Beautiful vacation home with private parking, hot tub, sauna
Entire Place • 5 bedrooms
Note: Performance varies based on location, size, amenities, seasonality, and management quality. Data reflects the past 12 months.
Top Performing Airbnb Hosts in Nassogne (2026)
Learn from the best! This table showcases top-performing Airbnb hosts in Nassogne based on the number of properties managed and estimated total revenue over the past year. Analyze their scale and performance metrics.
| Host Name | Properties | Grossing Revenue | Stay Reviews | Avg Rating |
|---|---|---|---|---|
| Gregoire | 2 | $106,460 | 361 | 4.94/5.0 |
| Catherine | 1 | $87,523 | 107 | 4.81/5.0 |
| Sandrine | 1 | $54,893 | 52 | 4.85/5.0 |
| Françoise | 1 | $39,651 | 49 | 4.98/5.0 |
| Els | 1 | $35,362 | 9 | 4.56/5.0 |
| Pauline | 1 | $33,060 | 23 | 4.91/5.0 |
| Annik | 1 | $30,638 | 63 | 4.86/5.0 |
| Jan | 1 | $29,719 | 24 | 4.79/5.0 |
| Jean | 1 | $29,615 | 151 | 4.70/5.0 |
| Olivier | 1 | $28,824 | 177 | 4.96/5.0 |
Analyzing the strategies of top hosts, such as their property selection, pricing, and guest communication, can offer valuable lessons for optimizing your own Airbnb operations in Nassogne.
Dive Deeper: Advanced Nassogne STR Market Data (2026)
Ready to unlock more insights? AirROI provides access to advanced metrics and comprehensive Airbnb data for Nassogne. Explore detailed analytics beyond this report to refine your investment strategy, optimize pricing, and maximize your vacation rental profits.
Explore Advanced MetricsNassogne Short-Term Rental Market Composition (2026): Property & Room Types
Room Type Distribution
Property Type Distribution
Market Composition Insights for Nassogne
- The Nassogne Airbnb market composition is heavily skewed towards Entire Home/Apt listings, which make up 84.2% of the 38 active rentals. This indicates strong guest preference for privacy and space.
- Looking at the property type distribution in Nassogne, House properties are the most common (63.2%), reflecting the local real estate landscape.
- Houses represent a significant 63.2% portion, catering likely to families or larger groups.
- The presence of 13.2% Hotel/Boutique listings indicates integration with traditional hospitality.
Nassogne Airbnb Room Capacity Analysis (2026): Bedroom Distribution
Distribution of Listings by Number of Bedrooms
Room Capacity Insights for Nassogne
- The dominant room capacity in Nassogne is 2 bedrooms listings, making up 26.3% of the market. This suggests a strong demand for properties suitable for couples or solo travelers.
- Together, 2 bedrooms and 5+ bedrooms properties represent 50.0% of the active Airbnb listings in Nassogne, indicating a high concentration in these sizes.
- A significant 36.9% of listings offer 3+ bedrooms, catering to larger groups and families seeking more space in Nassogne.
Nassogne Vacation Rental Guest Capacity Trends (2026)
Distribution of Listings by Guest Capacity
Guest Capacity Insights for Nassogne
- The most common guest capacity trend in Nassogne vacation rentals is listings accommodating 4 guests (28.9%). This suggests the primary traveler segment is likely small families or groups.
- Properties designed for 4 guests and 8+ guests dominate the Nassogne STR market, accounting for 55.2% of listings.
- 36.8% of properties accommodate 6+ guests, serving the market segment for larger families or group travel in Nassogne.
- On average, properties in Nassogne are equipped to host 4.5 guests.
Nassogne Airbnb Booking Patterns (2026): Available vs. Booked Days
Available Days Distribution
Booked Days Distribution
Booking Pattern Insights for Nassogne
- The most common availability pattern in Nassogne falls within the 271-366 days range, representing 47.4% of listings. This suggests many properties have significant open periods on their calendars.
- Approximately 68.5% of listings show high availability (181+ days open annually), indicating potential for increased bookings or specific owner usage patterns.
- For booked days, the 31-90 days range is most frequent in Nassogne (31.6%), reflecting common guest stay durations or potential owner blocking patterns.
- A notable 31.6% of properties secure long booking periods (181+ days booked per year), highlighting successful long-term rental strategies or significant owner usage.
Nassogne Airbnb Minimum Stay Requirements Analysis
Distribution of Listings by Minimum Night Requirement
1 Night
16 listings
42.1% of total
2 Nights
11 listings
28.9% of total
30+ Nights
11 listings
28.9% of total
Key Insights
- The most prevalent minimum stay requirement in Nassogne is 1 Night, adopted by 42.1% of listings. This highlights the market's preference for shorter, flexible bookings.
- A strong majority (71.0%) of the Nassogne Airbnb data shows acceptance of very short stays (1-2 nights), indicating a dynamic, high-turnover market.
- A significant segment (28.9%) caters to monthly stays (30+ nights) in Nassogne, pointing to opportunities in the extended-stay market.
Recommendations
- Align with the market by considering a 1 Night minimum stay, as 42.1% of Nassogne hosts use this setting.
- Explore offering discounts for stays of 30+ nights to attract the 28.9% of the market seeking extended stays.
- Adjust minimum nights based on seasonality – potentially shorter during low season and longer during peak demand periods in Nassogne.
Nassogne Airbnb Cancellation Policy Trends Analysis (2026)
Super Strict 60 Days
1 listings
2.7% of total
Flexible
6 listings
16.2% of total
Moderate
11 listings
29.7% of total
Firm
15 listings
40.5% of total
Strict
4 listings
10.8% of total
Cancellation Policy Insights for Nassogne
- The prevailing Airbnb cancellation policy trend in Nassogne is Firm, used by 40.5% of listings.
- A majority (51.3%) of hosts in Nassogne utilize Firm or Strict policies, indicating a market where hosts prioritize booking security.
Recommendations for Hosts
- Consider adopting a Firm policy to align with the 40.5% market standard in Nassogne.
- Using a Strict policy might deter some guests, as only 10.8% of listings use it. Evaluate if potential revenue protection outweighs possible lower booking rates.
- Regularly review your cancellation policy against competitors and market demand shifts in Nassogne.
Nassogne STR Booking Lead Time Analysis (2026)
Average Booking Lead Time by Month
Booking Lead Time Insights for Nassogne
- The overall average booking lead time for vacation rentals in Nassogne is 64 days.
- Guests book furthest in advance for stays during August (average 90 days), likely coinciding with peak travel demand or local events.
- The shortest booking windows occur for stays in February (average 32 days), indicating more last-minute travel plans during this time.
- Seasonally, Summer (71 days avg.) sees the longest lead times, while Fall (52 days avg.) has the shortest, reflecting typical travel planning cycles.
Recommendations for Hosts
- Use the overall average lead time (64 days) as a baseline for your pricing and availability strategy in Nassogne.
- For August stays, consider implementing length-of-stay discounts or slightly higher rates for bookings made less than 90 days out to capitalize on advance planning.
- Target marketing efforts for the Summer season well in advance (at least 71 days) to capture early planners.
- Monitor your own booking lead times against these Nassogne averages to identify opportunities for dynamic pricing adjustments.
Popular & Essential Airbnb Amenities in Nassogne (2026)
Amenity Prevalence
Amenity Insights for Nassogne
- Popular amenities like Wifi, Kitchen, Free parking on premises are common but not universal. Offering these can provide a competitive edge.
- Warning: Wifi is not universally provided but is considered essential globally. Ensure reliable Wifi is offered.
Recommendations for Hosts
- Consider adding popular differentiators like Wifi or Kitchen to increase appeal.
- Highlight unique or less common amenities you offer (e.g., hot tub, dedicated workspace, EV charger) in your listing description and photos.
- Regularly check competitor amenities in Nassogne to stay competitive.
Nassogne Airbnb Guest Demographics & Profile Analysis (2026)
Guest Profile Summary for Nassogne
- The typical guest profile for Airbnb in Nassogne consists of a mix of domestic (47%) and international guests, with top international origins including Netherlands, typically belonging to the Post-2000s (Gen Z/Alpha) group (50%), primarily speaking English or French.
- Domestic travelers account for 46.9% of guests.
- Key international markets include Belgium (46.9%) and Netherlands (24.3%).
- Top languages spoken are English (35.5%) followed by French (23.8%).
- A significant demographic segment is the Post-2000s (Gen Z/Alpha) group, representing 50% of guests.
Recommendations for Hosts
- Balance marketing efforts between domestic and international channels based on the guest mix.
- Tailor amenities and listing descriptions to appeal to the dominant Post-2000s (Gen Z/Alpha) demographic (e.g., highlight fast WiFi, smart home features, local guides).
- Highlight unique local experiences or amenities relevant to the primary guest profile.
- Consider seasonal promotions aligned with peak travel times for key origin markets.
Nearby Short-Term Rental Market Comparison
How does the Nassogne Airbnb market stack up against its neighbors? Compare key performance metrics like average monthly revenue, ADR, and occupancy rates in surrounding areas to understand the broader regional STR landscape.
| Market | Active Properties | Monthly Revenue | Daily Rate | Avg. Occupancy |
|---|---|---|---|---|
| Raamsdonksveer | 16 | $7,756 | $736.17 | 38% |
| Haghorst | 11 | $5,995 | $480.40 | 40% |
| Baarlo | 20 | $5,442 | $332.61 | 51% |
| Merksplas | 12 | $5,367 | $356.64 | 43% |
| Incourt | 13 | $4,412 | $303.48 | 52% |
| Wellin | 12 | $4,365 | $446.64 | 42% |
| Aubel | 26 | $4,191 | $283.88 | 46% |
| Dion | 12 | $4,104 | $270.32 | 50% |
| Bertogne | 26 | $3,839 | $325.90 | 42% |
| Mettet | 21 | $3,771 | $283.66 | 42% |