Houffalize Airbnb Market Analysis 2026: Short Term Rental Data & Vacation Rental Statistics in Luxembourg, Belgium
Is Airbnb profitable in Houffalize in 2026? Explore comprehensive Airbnb analytics for Houffalize, Luxembourg, Belgium to uncover income potential. This 2026 STR market report for Houffalize, based on AirROI data from February 2025 to January 2026, reveals key trends in the niche market of 116 active listings.
Whether you're considering an Airbnb investment in Houffalize, optimizing your existing vacation rental, or exploring rental arbitrage opportunities, understanding the Houffalize Airbnb data is crucial. Leveraging the low regulation environment is key to maximizing your short term rental income potential. Let's dive into the specifics.
Key Houffalize Airbnb Performance Metrics Overview
Monthly Airbnb Revenue Variations & Income Potential in Houffalize (2026)
Understanding the monthly revenue variations for Airbnb listings in Houffalize is key to maximizing your short term rental income potential. Seasonality significantly impacts earnings. Our analysis, based on data from the past 12 months, shows that the peak revenue month for STRs in Houffalize is typically August, while February often presents the lowest earnings, highlighting opportunities for strategic pricing adjustments during shoulder and low seasons. Explore the typical Airbnb income in Houffalize across different performance tiers:
- Best-in-class properties (Top 10%) achieve $8,168+ monthly, often utilizing dynamic pricing and superior guest experiences.
- Strong performing properties (Top 25%) earn $4,564 or more, indicating effective management and desirable locations/amenities.
- Typical properties (Median) generate around $2,567 per month, representing the average market performance.
- Entry-level properties (Bottom 25%) see earnings around $1,373, often with potential for optimization.
Average Monthly Airbnb Earnings Trend in Houffalize
Houffalize Airbnb Occupancy Rate Trends (2026)
Maximize your bookings by understanding the Houffalize STR occupancy trends. Seasonal demand shifts significantly influence how often properties are booked. Typically, Augustsees the highest demand (peak season occupancy), while January experiences the lowest (low season). Effective strategies, like adjusting minimum stays or offering promotions, can boost occupancy during slower periods. Here's how different property tiers perform in Houffalize:
- Best-in-class properties (Top 10%) achieve 71%+ occupancy, indicating high desirability and potentially optimized availability.
- Strong performing properties (Top 25%) maintain 54% or higher occupancy, suggesting good market fit and guest satisfaction.
- Typical properties (Median) have an occupancy rate around 37%.
- Entry-level properties (Bottom 25%) average 23% occupancy, potentially facing higher vacancy.
Average Monthly Occupancy Rate Trend in Houffalize
Average Daily Rate (ADR) Airbnb Trends in Houffalize (2026)
Effective short term rental pricing strategy in Houffalize involves understanding monthly ADR fluctuations. The Average Daily Rate (ADR) for Airbnb in Houffalize typically peaks in December and dips lowest during February. Leveraging Airbnb dynamic pricing tools or strategies based on this seasonality can significantly boost revenue. Here's a look at the typical nightly rates achieved:
- Best-in-class properties (Top 10%) command rates of $580+ per night, often due to premium features or locations.
- Strong performing properties (Top 25%) achieve nightly rates of $337 or more.
- Typical properties (Median) charge around $210 per night.
- Entry-level properties (Bottom 25%) earn around $150 per night.
Average Daily Rate (ADR) Trend by Month in Houffalize
Get Live Houffalize Market Intelligence 👇

Explore Real-time Analytics
Airbnb Seasonality Analysis & Trends in Houffalize (2026)
Peak Season (August, July, October)
- Revenue averages $4,678 per month
- Occupancy rates average 50.0%
- Daily rates average $309
Shoulder Season
- Revenue averages $4,055 per month
- Occupancy maintains around 38.9%
- Daily rates hold near $308
Low Season (January, February, March)
- Revenue drops to average $2,768 per month
- Occupancy decreases to average 31.5%
- Daily rates adjust to average $295
Seasonality Insights for Houffalize
- The Airbnb seasonality in Houffalize shows moderate seasonality with distinct peak and low periods. While the sections above show seasonal averages, it's also insightful to look at the extremes:
- During the high season, the absolute peak month showcases Houffalize's highest earning potential, with monthly revenues capable of climbing to $4,750, occupancy reaching a high of 54.3%, and ADRs peaking at $327.
- Conversely, the slowest single month of the year, typically falling within the low season, marks the market's lowest point. In this month, revenue might dip to $2,459, occupancy could drop to 24.5%, and ADRs may adjust down to $279.
- Understanding both the seasonal averages and these monthly peaks and troughs in revenue, occupancy, and ADR is crucial for maximizing your Airbnb profit potential in Houffalize.
Seasonal Strategies for Maximizing Profit
- Peak Season: Maximize revenue through premium pricing and potentially longer minimum stays. Ensure high availability.
- Low Season: Offer competitive pricing, special promotions (e.g., extended stay discounts), and flexible cancellation policies. Target off-season travelers like remote workers or budget-conscious guests.
- Shoulder Seasons: Implement dynamic pricing that balances peak and low rates. Target weekend travelers or specific events. Offer slightly more flexible terms than peak season.
- Regularly analyze your own performance against these Houffalize seasonality benchmarks and adjust your pricing and availability strategy accordingly.
Best Areas for Airbnb Investment in Houffalize (2026)
Exploring the top neighborhoods for short-term rentals in Houffalize? This section highlights key areas, outlining why they are attractive for hosts and guests, along with notable local attractions. Consider these locations based on your target guest profile and investment strategy.
| Neighborhood / Area | Why Host Here? (Target Guests & Appeal) | Key Attractions & Landmarks |
|---|---|---|
| Houffalize Town Centre | The heart of Houffalize offers a charming atmosphere with historical sites and local shops. Visitors enjoy the authenticity and friendly vibe of this small town, making it a perfect spot for short-term rentals. | Houffalize Church, Town Hall, local cafes and shops, Rural Historical Museum, Puyard Castle |
| Ourthe Riverbank | A picturesque area along the Ourthe River that attracts nature lovers and outdoor enthusiasts. It provides opportunities for kayaking and hiking, making it an appealing place for families and adventurers alike. | Kayaking on the Ourthe River, hiking trails, Picnic spots, scenic viewpoints |
| Bastogne | Located nearby, Bastogne is known for its World War II history and major tourist sites. This area attracts history buffs and tourists looking to explore significant historical landmarks. | Bastogne War Museum, Mardasson Memorial, Bastogne Historical Center, WWII Memorials |
| La Roche-en-Ardenne | A beautiful town just a short drive away, it’s famous for its medieval castle and outdoor activities. Offers a mix of culture and nature, appealing to a wide range of visitors. | La Roche Castle, The Ourthe River, Outdoor sports activities, Local festivals |
| Hiking Trails of the Ardennes | The surrounding Ardennes is renowned for its stunning hiking trails and natural beauty. Ideal for tourists who prefer outdoor activities and wish to explore the scenic landscape. | Sadjär Valley Trails, Top of the World Trail, Ardennes Forest Parks, Nature reserves |
| Local Chocolate Shops | Houffalize is home to several artisanal chocolate shops, drawing in visitors with a sweet tooth. This area can attract culinary tourists and families. | Chocolate tastings, Local workshops, Artisan chocolate shops |
| Cultural Events Venues | Various venues in and around Houffalize host cultural events, markets, and festivals throughout the year, making it a lively area for visitors seeking local culture and activities. | Local festivals, Art fairs, Cultural performances |
| Adventure Parks | There are several adventure parks in the vicinity that cater to families and thrill-seekers. This area is perfect for short-term rental opportunities focused on family-friendly activities. | Adventure park experiences, Zip-lining, Family fun activities |
Understanding Airbnb License Requirements & STR Laws in Houffalize (2026)
While Houffalize, Luxembourg, Belgium currently shows low STR regulations, specific Airbnb license requirements might still exist or change. Always verify the latest short term rental regulations and Airbnb license requirements directly with local government authorities for Houffalize to ensure full compliance before hosting.
(Source: AirROI data, 2026, finding no licensed listings among those analyzed)
Top Performing Airbnb Properties in Houffalize (2026)
Benchmark your potential! Explore examples of top-performing Airbnb properties in Houffalizebased on Trailing Twelve Month (TTM) revenue. Analyze their characteristics, revenue, occupancy rate, and ADR to understand what drives success in this market.
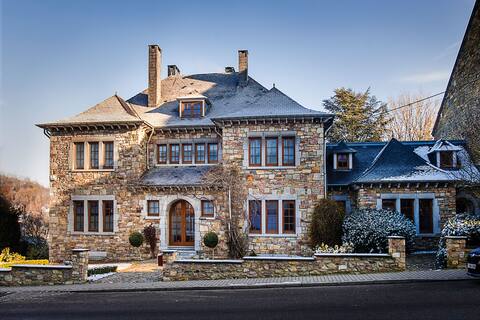
Villa 24 people with wellness room in the Ardennes
Entire Place • 10 bedrooms

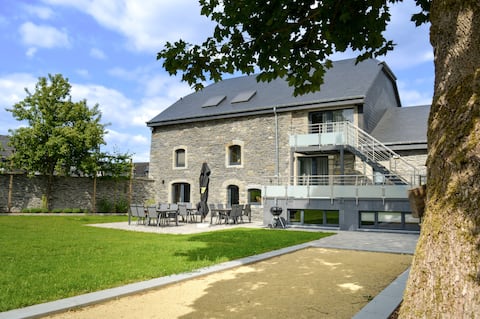
Gite Les 3 pierre Houffalize Belgian Ardenne
Entire Place • 6 bedrooms
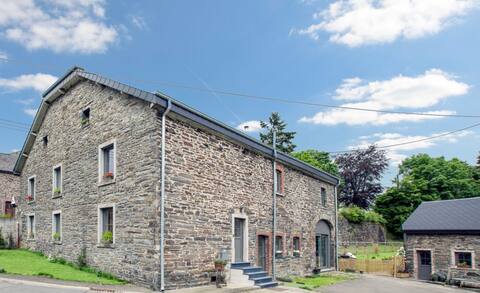
La Maison du Notaire – Gîte 18p.
Entire Place • 8 bedrooms
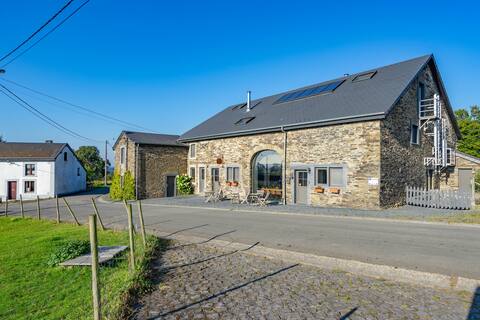
Coeur de Boeur. Beautifull and comfortable house
Entire Place • 6 bedrooms
Au Frêne family accommodation (32 P + 2 babies)
Entire Place • 13 bedrooms
Beautiful Modern Group Home with Wellness
Entire Place • 5 bedrooms
Note: Performance varies based on location, size, amenities, seasonality, and management quality. Data reflects the past 12 months.
Top Performing Airbnb Hosts in Houffalize (2026)
Learn from the best! This table showcases top-performing Airbnb hosts in Houffalize based on the number of properties managed and estimated total revenue over the past year. Analyze their scale and performance metrics.
| Host Name | Properties | Grossing Revenue | Stay Reviews | Avg Rating |
|---|---|---|---|---|
| Stephanie | 16 | $791,829 | 374 | 4.64/5.0 |
| Thierry | 1 | $242,945 | 36 | 4.61/5.0 |
| Sybrand | 2 | $215,178 | 49 | 4.99/5.0 |
| Dominique | 5 | $198,733 | 366 | 4.48/5.0 |
| Mario | 1 | $161,836 | 21 | 5.00/5.0 |
| Xavier | 1 | $146,413 | 11 | 4.91/5.0 |
| Emilie | 1 | $143,446 | 10 | 4.30/5.0 |
| Dirk | 2 | $141,378 | 65 | 4.83/5.0 |
| Ardennemaison | 2 | $117,810 | 108 | 4.82/5.0 |
| Pauline | 1 | $111,352 | 2 | Not Rated |
Analyzing the strategies of top hosts, such as their property selection, pricing, and guest communication, can offer valuable lessons for optimizing your own Airbnb operations in Houffalize.
Dive Deeper: Advanced Houffalize STR Market Data (2026)
Ready to unlock more insights? AirROI provides access to advanced metrics and comprehensive Airbnb data for Houffalize. Explore detailed analytics beyond this report to refine your investment strategy, optimize pricing, and maximize your vacation rental profits.
Explore Advanced MetricsHouffalize Short-Term Rental Market Composition (2026): Property & Room Types
Room Type Distribution
Property Type Distribution
Market Composition Insights for Houffalize
- The Houffalize Airbnb market composition is heavily skewed towards Entire Home/Apt listings, which make up 90.5% of the 116 active rentals. This indicates strong guest preference for privacy and space.
- Looking at the property type distribution in Houffalize, House properties are the most common (69.8%), reflecting the local real estate landscape.
- Houses represent a significant 69.8% portion, catering likely to families or larger groups.
- The presence of 6% Hotel/Boutique listings indicates integration with traditional hospitality.
- Smaller segments like others, unique stays (combined 5.2%) offer potential for unique stay experiences.
Houffalize Airbnb Room Capacity Analysis (2026): Bedroom Distribution
Distribution of Listings by Number of Bedrooms
Room Capacity Insights for Houffalize
- The dominant room capacity in Houffalize is 3 bedrooms listings, making up 25% of the market. This suggests a strong demand for properties suitable for families or small groups.
- Together, 3 bedrooms and 5+ bedrooms properties represent 48.3% of the active Airbnb listings in Houffalize, indicating a high concentration in these sizes.
- A significant 64.7% of listings offer 3+ bedrooms, catering to larger groups and families seeking more space in Houffalize.
Houffalize Vacation Rental Guest Capacity Trends (2026)
Distribution of Listings by Guest Capacity
Guest Capacity Insights for Houffalize
- The most common guest capacity trend in Houffalize vacation rentals is listings accommodating 8+ guests (44%). This suggests the primary traveler segment is likely larger groups.
- Properties designed for 8+ guests and 6 guests dominate the Houffalize STR market, accounting for 65.6% of listings.
- 67.3% of properties accommodate 6+ guests, serving the market segment for larger families or group travel in Houffalize.
- On average, properties in Houffalize are equipped to host 5.9 guests.
Houffalize Airbnb Booking Patterns (2026): Available vs. Booked Days
Available Days Distribution
Booked Days Distribution
Booking Pattern Insights for Houffalize
- The most common availability pattern in Houffalize falls within the 181-270 days range, representing 50% of listings. This suggests many properties have significant open periods on their calendars.
- Approximately 84.5% of listings show high availability (181+ days open annually), indicating potential for increased bookings or specific owner usage patterns.
- For booked days, the 91-180 days range is most frequent in Houffalize (50.9%), reflecting common guest stay durations or potential owner blocking patterns.
- A notable 17.3% of properties secure long booking periods (181+ days booked per year), highlighting successful long-term rental strategies or significant owner usage.
Houffalize Airbnb Minimum Stay Requirements Analysis
Distribution of Listings by Minimum Night Requirement
1 Night
36 listings
31% of total
2 Nights
48 listings
41.4% of total
3 Nights
2 listings
1.7% of total
7-29 Nights
1 listings
0.9% of total
30+ Nights
29 listings
25% of total
Key Insights
- The most prevalent minimum stay requirement in Houffalize is 2 Nights, adopted by 41.4% of listings. This highlights the market's preference for shorter, flexible bookings.
- A strong majority (72.4%) of the Houffalize Airbnb data shows acceptance of very short stays (1-2 nights), indicating a dynamic, high-turnover market.
- A significant segment (25%) caters to monthly stays (30+ nights) in Houffalize, pointing to opportunities in the extended-stay market.
Recommendations
- Align with the market by considering a 2 Nights minimum stay, as 41.4% of Houffalize hosts use this setting.
- Explore offering discounts for stays of 30+ nights to attract the 25% of the market seeking extended stays.
- Adjust minimum nights based on seasonality – potentially shorter during low season and longer during peak demand periods in Houffalize.
Houffalize Airbnb Cancellation Policy Trends Analysis (2026)
Refundable
5 listings
4.3% of total
Super Strict 30 Days
3 listings
2.6% of total
Super Strict 60 Days
3 listings
2.6% of total
Non-refundable
5 listings
4.3% of total
Flexible
13 listings
11.2% of total
Moderate
20 listings
17.2% of total
Firm
53 listings
45.7% of total
Strict
14 listings
12.1% of total
Cancellation Policy Insights for Houffalize
- The prevailing Airbnb cancellation policy trend in Houffalize is Firm, used by 45.7% of listings.
- A majority (57.8%) of hosts in Houffalize utilize Firm or Strict policies, indicating a market where hosts prioritize booking security.
Recommendations for Hosts
- Consider adopting a Firm policy to align with the 45.7% market standard in Houffalize.
- Using a Strict policy might deter some guests, as only 12.1% of listings use it. Evaluate if potential revenue protection outweighs possible lower booking rates.
- Regularly review your cancellation policy against competitors and market demand shifts in Houffalize.
Houffalize STR Booking Lead Time Analysis (2026)
Average Booking Lead Time by Month
Booking Lead Time Insights for Houffalize
- The overall average booking lead time for vacation rentals in Houffalize is 82 days.
- Guests book furthest in advance for stays during May (average 111 days), likely coinciding with peak travel demand or local events.
- The shortest booking windows occur for stays in February (average 40 days), indicating more last-minute travel plans during this time.
- Seasonally, Summer (98 days avg.) sees the longest lead times, while Winter (72 days avg.) has the shortest, reflecting typical travel planning cycles.
Recommendations for Hosts
- Use the overall average lead time (82 days) as a baseline for your pricing and availability strategy in Houffalize.
- For May stays, consider implementing length-of-stay discounts or slightly higher rates for bookings made less than 111 days out to capitalize on advance planning.
- Target marketing efforts for the Summer season well in advance (at least 98 days) to capture early planners.
- Monitor your own booking lead times against these Houffalize averages to identify opportunities for dynamic pricing adjustments.
Popular & Essential Airbnb Amenities in Houffalize (2026)
Amenity Prevalence
Amenity Insights for Houffalize
- Essential amenities in Houffalize that guests expect include: Heating. Lacking these (this) could significantly impact bookings.
- Popular amenities like TV, Kitchen, Coffee maker are common but not universal. Offering these can provide a competitive edge.
- Warning: Wifi is not universally provided but is considered essential globally. Ensure reliable Wifi is offered.
Recommendations for Hosts
- Ensure your listing includes all essential amenities for Houffalize: Heating.
- Prioritize adding missing essentials: Heating.
- Consider adding popular differentiators like TV or Kitchen to increase appeal.
- Highlight unique or less common amenities you offer (e.g., hot tub, dedicated workspace, EV charger) in your listing description and photos.
- Regularly check competitor amenities in Houffalize to stay competitive.
Houffalize Airbnb Guest Demographics & Profile Analysis (2026)
Guest Profile Summary for Houffalize
- The typical guest profile for Airbnb in Houffalize consists of a mix of domestic (41%) and international guests, with top international origins including Netherlands, typically belonging to the Post-2000s (Gen Z/Alpha) group (50%), primarily speaking English or Dutch.
- Domestic travelers account for 40.6% of guests.
- Key international markets include Belgium (40.6%) and Netherlands (33.1%).
- Top languages spoken are English (37%) followed by Dutch (22.6%).
- A significant demographic segment is the Post-2000s (Gen Z/Alpha) group, representing 50% of guests.
Recommendations for Hosts
- Balance marketing efforts between domestic and international channels based on the guest mix.
- Tailor amenities and listing descriptions to appeal to the dominant Post-2000s (Gen Z/Alpha) demographic (e.g., highlight fast WiFi, smart home features, local guides).
- Highlight unique local experiences or amenities relevant to the primary guest profile.
- Consider seasonal promotions aligned with peak travel times for key origin markets.
Nearby Short-Term Rental Market Comparison
How does the Houffalize Airbnb market stack up against its neighbors? Compare key performance metrics like average monthly revenue, ADR, and occupancy rates in surrounding areas to understand the broader regional STR landscape.
| Market | Active Properties | Monthly Revenue | Daily Rate | Avg. Occupancy |
|---|---|---|---|---|
| Raamsdonksveer | 16 | $7,756 | $736.17 | 38% |
| Haghorst | 11 | $5,995 | $480.40 | 40% |
| Baarlo | 20 | $5,442 | $332.61 | 51% |
| Merksplas | 12 | $5,367 | $356.64 | 43% |
| Incourt | 13 | $4,412 | $303.48 | 52% |
| Wellin | 12 | $4,365 | $446.64 | 42% |
| Aubel | 26 | $4,191 | $283.88 | 46% |
| Dion | 12 | $4,104 | $270.32 | 50% |
| Bertogne | 26 | $3,839 | $325.90 | 42% |
| Mettet | 21 | $3,771 | $283.66 | 42% |