Seraing Airbnb Market Analysis 2025: Short Term Rental Data & Vacation Rental Statistics in Liège, Belgium
Is Airbnb profitable in Seraing in 2025? Explore comprehensive Airbnb analytics for Seraing, Liège, Belgium to uncover income potential. This 2025 STR market report for Seraing, based on AirROI data from November 2024 to October 2025, reveals key trends in the niche market of 20 active listings.
Whether you're considering an Airbnb investment in Seraing, optimizing your existing vacation rental, or exploring rental arbitrage opportunities, understanding the Seraing Airbnb data is crucial. Leveraging the low regulation environment is key to maximizing your short term rental income potential. Let's dive into the specifics.
Key Seraing Airbnb Performance Metrics Overview
Monthly Airbnb Revenue Variations & Income Potential in Seraing (2025)
Understanding the monthly revenue variations for Airbnb listings in Seraing is key to maximizing your short term rental income potential. Seasonality significantly impacts earnings. Our analysis, based on data from the past 12 months, shows that the peak revenue month for STRs in Seraing is typically December, while November often presents the lowest earnings, highlighting opportunities for strategic pricing adjustments during shoulder and low seasons. Explore the typical Airbnb income in Seraing across different performance tiers:
- Best-in-class properties (Top 10%) achieve $3,254+ monthly, often utilizing dynamic pricing and superior guest experiences.
- Strong performing properties (Top 25%) earn $1,970 or more, indicating effective management and desirable locations/amenities.
- Typical properties (Median) generate around $1,194 per month, representing the average market performance.
- Entry-level properties (Bottom 25%) see earnings around $686, often with potential for optimization.
Average Monthly Airbnb Earnings Trend in Seraing
Seraing Airbnb Occupancy Rate Trends (2025)
Maximize your bookings by understanding the Seraing STR occupancy trends. Seasonal demand shifts significantly influence how often properties are booked. Typically, Augustsees the highest demand (peak season occupancy), while January experiences the lowest (low season). Effective strategies, like adjusting minimum stays or offering promotions, can boost occupancy during slower periods. Here's how different property tiers perform in Seraing:
- Best-in-class properties (Top 10%) achieve 83%+ occupancy, indicating high desirability and potentially optimized availability.
- Strong performing properties (Top 25%) maintain 72% or higher occupancy, suggesting good market fit and guest satisfaction.
- Typical properties (Median) have an occupancy rate around 51%.
- Entry-level properties (Bottom 25%) average 23% occupancy, potentially facing higher vacancy.
Average Monthly Occupancy Rate Trend in Seraing
Average Daily Rate (ADR) Airbnb Trends in Seraing (2025)
Effective short term rental pricing strategy in Seraing involves understanding monthly ADR fluctuations. The Average Daily Rate (ADR) for Airbnb in Seraing typically peaks in December and dips lowest during August. Leveraging Airbnb dynamic pricing tools or strategies based on this seasonality can significantly boost revenue. Here's a look at the typical nightly rates achieved:
- Best-in-class properties (Top 10%) command rates of $259+ per night, often due to premium features or locations.
- Strong performing properties (Top 25%) achieve nightly rates of $144 or more.
- Typical properties (Median) charge around $88 per night.
- Entry-level properties (Bottom 25%) earn around $57 per night.
Average Daily Rate (ADR) Trend by Month in Seraing
Get Live Seraing Market Intelligence 👇

Explore Real-time Analytics
Airbnb Seasonality Analysis & Trends in Seraing (2025)
Peak Season (December, July, August)
- Revenue averages $1,973 per month
- Occupancy rates average 57.1%
- Daily rates average $125
Shoulder Season
- Revenue averages $1,533 per month
- Occupancy maintains around 47.0%
- Daily rates hold near $125
Low Season (February, March, November)
- Revenue drops to average $1,255 per month
- Occupancy decreases to average 45.6%
- Daily rates adjust to average $126
Seasonality Insights for Seraing
- The Airbnb seasonality in Seraing shows moderate seasonality with distinct peak and low periods. While the sections above show seasonal averages, it's also insightful to look at the extremes:
- During the high season, the absolute peak month showcases Seraing's highest earning potential, with monthly revenues capable of climbing to $2,059, occupancy reaching a high of 58.9%, and ADRs peaking at $130.
- Conversely, the slowest single month of the year, typically falling within the low season, marks the market's lowest point. In this month, revenue might dip to $1,133, occupancy could drop to 34.2%, and ADRs may adjust down to $120.
- Understanding both the seasonal averages and these monthly peaks and troughs in revenue, occupancy, and ADR is crucial for maximizing your Airbnb profit potential in Seraing.
Seasonal Strategies for Maximizing Profit
- Peak Season: Maximize revenue through premium pricing and potentially longer minimum stays. Ensure high availability.
- Low Season: Offer competitive pricing, special promotions (e.g., extended stay discounts), and flexible cancellation policies. Target off-season travelers like remote workers or budget-conscious guests.
- Shoulder Seasons: Implement dynamic pricing that balances peak and low rates. Target weekend travelers or specific events. Offer slightly more flexible terms than peak season.
- Regularly analyze your own performance against these Seraing seasonality benchmarks and adjust your pricing and availability strategy accordingly.
Best Areas for Airbnb Investment in Seraing (2025)
Exploring the top neighborhoods for short-term rentals in Seraing? This section highlights key areas, outlining why they are attractive for hosts and guests, along with notable local attractions. Consider these locations based on your target guest profile and investment strategy.
| Neighborhood / Area | Why Host Here? (Target Guests & Appeal) | Key Attractions & Landmarks |
|---|---|---|
| La Basse Meuse | A picturesque region with charming villages and riverside views, ideal for guests looking to explore Belgian culture and nature. Its proximity to Liège makes it attractive to tourists as well. | Meuse River, Coteaux de la Citadelle, Local artisan shops, Cycle paths, Scenic nature walks |
| Seraing City Center | The heart of Seraing, featuring historical architecture and local shops. It's a good base for travelers wanting to experience local life and culture in a quieter setting. | Église Saint-Georges, Place de l'Hôtel de Ville, Seraing Park, Local restaurants, Nearby bus and train services |
| Château de Seraing | This area boasts the beautiful Château de Seraing, appealing to visitors interested in history and architecture. It's a serene area with great potential for hosting tourists. | Château de Seraing, Parc de la Boverie, Historical museums, Walking paths around the castle, Art galleries |
| Ougrée | A residential community with access to local parks and amenities, perfect for families or longer stays. Close to local schools and green spaces. | Parc de la Neuville, Local schools, Shopping centers, Public transport access, Community events |
| Cointe | A neighborhood close to Liège with elevated views and a peaceful environment, attractive to those seeking tranquility while still being near the city. | Basilique de Cointe, Panoramic views of Liège, Local hiking paths, Cycling routes, Cafés with city views |
| Liège-Guillemins | This renowned train station area is bustling with activity, making it ideal for business travelers and short-stay tourists visiting the region. | Liège-Guillemins railway station, Nearby cultural venues, Access to public transport, Shopping areas, Local restaurants |
| Rocourt | A mixed-use district with residential areas and local businesses, attracting both tourists and locals looking for convenience and accessibility to the wider region. | Local shopping centers, Rocourt Park, Various eateries, Public transport connections, Nearby historical sites |
| Hogneau | A serene community that provides guests with a rural ambiance while being just a short distance from urban amenities and attractions, perfect for nature lovers. | Nature walks, Local farms, Quiet environment, Community parks, Cycling paths |
Understanding Airbnb License Requirements & STR Laws in Seraing (2025)
While Seraing, Liège, Belgium currently shows low STR regulations, specific Airbnb license requirements might still exist or change. Always verify the latest short term rental regulations and Airbnb license requirements directly with local government authorities for Seraing to ensure full compliance before hosting.
(Source: AirROI data, 2025, finding no licensed listings among those analyzed)
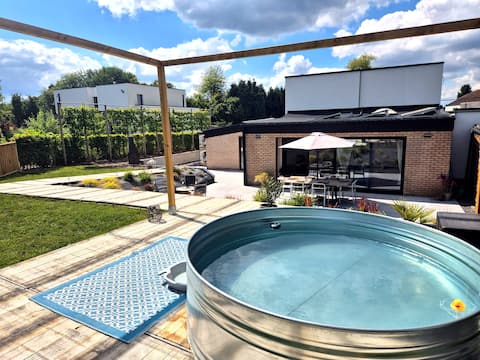
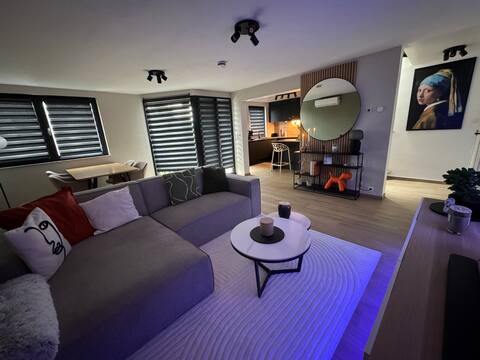
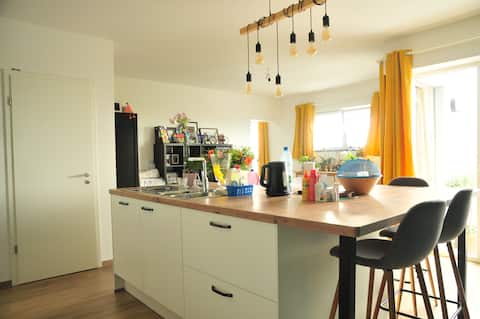
Top Performing Airbnb Properties in Seraing (2025)
Benchmark your potential! Explore examples of top-performing Airbnb properties in Seraingbased on Trailing Twelve Month (TTM) revenue. Analyze their characteristics, revenue, occupancy rate, and ADR to understand what drives success in this market.
Chez Simone Liège, Nordic bath
Entire Place • 2 bedrooms
100 m² duplex, Contemporary style!
Entire Place • 1 bedroom

The attic
Entire Place • N/A

Unusual accommodation with spa, steam room and sauna.
Entire Place • 1 bedroom
Penthouse Sart-Tilman / University
Entire Place • 3 bedrooms

Super nice apartment near Liège
Entire Place • 1 bedroom
Note: Performance varies based on location, size, amenities, seasonality, and management quality. Data reflects the past 12 months.
Top Performing Airbnb Hosts in Seraing (2025)
Learn from the best! This table showcases top-performing Airbnb hosts in Seraing based on the number of properties managed and estimated total revenue over the past year. Analyze their scale and performance metrics.
| Host Name | Properties | Grossing Revenue | Stay Reviews | Avg Rating |
|---|---|---|---|---|
| Olivier | 1 | $46,055 | 35 | 5.00/5.0 |
| Gianni | 1 | $23,858 | 83 | 4.89/5.0 |
| Etienne | 1 | $22,054 | 145 | 4.87/5.0 |
| Robin | 1 | $19,551 | 27 | 4.74/5.0 |
| Sebastien | 1 | $16,147 | 14 | 4.86/5.0 |
| Aimé | 1 | $15,701 | 195 | 4.75/5.0 |
| Nicolas | 2 | $15,570 | 35 | 4.45/5.0 |
| Serge | 1 | $14,432 | 47 | 4.83/5.0 |
| Hassan | 1 | $10,954 | 9 | 4.78/5.0 |
| Ramon | 1 | $9,742 | 15 | 4.67/5.0 |
Analyzing the strategies of top hosts, such as their property selection, pricing, and guest communication, can offer valuable lessons for optimizing your own Airbnb operations in Seraing.
Dive Deeper: Advanced Seraing STR Market Data (2025)
Ready to unlock more insights? AirROI provides access to advanced metrics and comprehensive Airbnb data for Seraing. Explore detailed analytics beyond this report to refine your investment strategy, optimize pricing, and maximize your vacation rental profits.
Explore Advanced MetricsSeraing Short-Term Rental Market Composition (2025): Property & Room Types
Room Type Distribution
Property Type Distribution
Market Composition Insights for Seraing
- The Seraing Airbnb market composition is heavily skewed towards Entire Home/Apt listings, which make up 80% of the 20 active rentals. This indicates strong guest preference for privacy and space.
- Looking at the property type distribution in Seraing, Apartment/Condo properties are the most common (65%), reflecting the local real estate landscape.
- Houses represent a significant 25% portion, catering likely to families or larger groups.
Seraing Airbnb Room Capacity Analysis (2025): Bedroom Distribution
Distribution of Listings by Number of Bedrooms
Room Capacity Insights for Seraing
- The dominant room capacity in Seraing is 1 bedroom listings, making up 55% of the market. This suggests a strong demand for properties suitable for couples or solo travelers.
- Together, 1 bedroom and 2 bedrooms properties represent 70.0% of the active Airbnb listings in Seraing, indicating a high concentration in these sizes.
- With over half the market (55%) consisting of studios or 1-bedroom units, Seraing is particularly well-suited for individuals or couples.
Seraing Vacation Rental Guest Capacity Trends (2025)
Distribution of Listings by Guest Capacity
Guest Capacity Insights for Seraing
- The most common guest capacity trend in Seraing vacation rentals is listings accommodating 2 guests (40%). This suggests the primary traveler segment is likely couples or solo travelers.
- Properties designed for 2 guests and 3 guests dominate the Seraing STR market, accounting for 60.0% of listings.
- On average, properties in Seraing are equipped to host 2.5 guests.
Seraing Airbnb Booking Patterns (2025): Available vs. Booked Days
Available Days Distribution
Booked Days Distribution
Booking Pattern Insights for Seraing
- The most common availability pattern in Seraing falls within the 271-366 days range, representing 50% of listings. This suggests many properties have significant open periods on their calendars.
- Approximately 80.0% of listings show high availability (181+ days open annually), indicating potential for increased bookings or specific owner usage patterns.
- For booked days, the 91-180 days range is most frequent in Seraing (35%), reflecting common guest stay durations or potential owner blocking patterns.
- A notable 20.0% of properties secure long booking periods (181+ days booked per year), highlighting successful long-term rental strategies or significant owner usage.
Seraing Airbnb Minimum Stay Requirements Analysis
Distribution of Listings by Minimum Night Requirement
1 Night
10 listings
50% of total
2 Nights
2 listings
10% of total
3 Nights
4 listings
20% of total
4-6 Nights
1 listings
5% of total
7-29 Nights
1 listings
5% of total
30+ Nights
2 listings
10% of total
Key Insights
- The most prevalent minimum stay requirement in Seraing is 1 Night, adopted by 50% of listings. This highlights the market's preference for shorter, flexible bookings.
Recommendations
- Align with the market by considering a 1 Night minimum stay, as 50% of Seraing hosts use this setting.
- Explore offering discounts for stays of 30+ nights to attract the 10% of the market seeking extended stays.
- Adjust minimum nights based on seasonality – potentially shorter during low season and longer during peak demand periods in Seraing.
Seraing Airbnb Cancellation Policy Trends Analysis (2025)
Flexible
8 listings
40% of total
Moderate
5 listings
25% of total
Firm
3 listings
15% of total
Strict
4 listings
20% of total
Cancellation Policy Insights for Seraing
- The prevailing Airbnb cancellation policy trend in Seraing is Flexible, used by 40% of listings.
- There's a relatively balanced mix between guest-friendly (65.0%) and stricter (35.0%) policies, offering choices for different guest needs.
Recommendations for Hosts
- Consider adopting a Flexible policy to align with the 40% market standard in Seraing.
- Regularly review your cancellation policy against competitors and market demand shifts in Seraing.
Seraing STR Booking Lead Time Analysis (2025)
Average Booking Lead Time by Month
Booking Lead Time Insights for Seraing
- The overall average booking lead time for vacation rentals in Seraing is 35 days.
- Guests book furthest in advance for stays during July (average 96 days), likely coinciding with peak travel demand or local events.
- The shortest booking windows occur for stays in February (average 20 days), indicating more last-minute travel plans during this time.
- Seasonally, Summer (62 days avg.) sees the longest lead times, while Winter (29 days avg.) has the shortest, reflecting typical travel planning cycles.
Recommendations for Hosts
- Use the overall average lead time (35 days) as a baseline for your pricing and availability strategy in Seraing.
- For July stays, consider implementing length-of-stay discounts or slightly higher rates for bookings made less than 96 days out to capitalize on advance planning.
- Target marketing efforts for the Summer season well in advance (at least 62 days) to capture early planners.
- Monitor your own booking lead times against these Seraing averages to identify opportunities for dynamic pricing adjustments.
Popular & Essential Airbnb Amenities in Seraing (2025)
Amenity Prevalence
Amenity Insights for Seraing
- Essential amenities in Seraing that guests expect include: Wifi, Smoke alarm. Lacking these (any) could significantly impact bookings.
- Popular amenities like Kitchen, TV, Free parking on premises are common but not universal. Offering these can provide a competitive edge.
Recommendations for Hosts
- Ensure your listing includes all essential amenities for Seraing: Wifi, Smoke alarm.
- Consider adding popular differentiators like Kitchen or TV to increase appeal.
- Highlight unique or less common amenities you offer (e.g., hot tub, dedicated workspace, EV charger) in your listing description and photos.
- Regularly check competitor amenities in Seraing to stay competitive.
Seraing Airbnb Guest Demographics & Profile Analysis (2025)
Guest Profile Summary for Seraing
- The typical guest profile for Airbnb in Seraing consists of predominantly international visitors (81%), with top international origins including Belgium, typically belonging to the Post-2000s (Gen Z/Alpha) group (50%), primarily speaking English or French.
- Domestic travelers account for 19.4% of guests.
- Key international markets include France (44%) and Belgium (19.4%).
- Top languages spoken are English (33.3%) followed by French (30.2%).
- A significant demographic segment is the Post-2000s (Gen Z/Alpha) group, representing 50% of guests.
Recommendations for Hosts
- Focus marketing internationally, particularly towards travelers from Belgium.
- Tailor amenities and listing descriptions to appeal to the dominant Post-2000s (Gen Z/Alpha) demographic (e.g., highlight fast WiFi, smart home features, local guides).
- Highlight unique local experiences or amenities relevant to the primary guest profile.
- Consider seasonal promotions aligned with peak travel times for key origin markets.
Nearby Short-Term Rental Market Comparison
How does the Seraing Airbnb market stack up against its neighbors? Compare key performance metrics like average monthly revenue, ADR, and occupancy rates in surrounding areas to understand the broader regional STR landscape.
| Market | Active Properties | Monthly Revenue | Daily Rate | Avg. Occupancy |
|---|---|---|---|---|
| Raamsdonksveer | 15 | $8,168 | $763.87 | 41% |
| Haghorst | 11 | $6,177 | $467.48 | 42% |
| Merksplas | 12 | $5,498 | $374.43 | 42% |
| Baarlo | 20 | $5,331 | $330.15 | 50% |
| Wellin | 11 | $4,568 | $452.75 | 45% |
| Incourt | 13 | $4,462 | $318.08 | 51% |
| Dion | 13 | $4,248 | $272.93 | 53% |
| Aubel | 28 | $4,054 | $283.27 | 45% |
| Bertogne | 26 | $3,869 | $333.27 | 40% |
| Mettet | 21 | $3,594 | $294.51 | 41% |