Esneux Airbnb Market Analysis 2026: Short Term Rental Data & Vacation Rental Statistics in Liège, Belgium
Is Airbnb profitable in Esneux in 2026? Explore comprehensive Airbnb analytics for Esneux, Liège, Belgium to uncover income potential. This 2026 STR market report for Esneux, based on AirROI data from February 2025 to January 2026, reveals key trends in the niche market of 54 active listings.
Whether you're considering an Airbnb investment in Esneux, optimizing your existing vacation rental, or exploring rental arbitrage opportunities, understanding the Esneux Airbnb data is crucial. Leveraging the low regulation environment is key to maximizing your short term rental income potential. Let's dive into the specifics.
Key Esneux Airbnb Performance Metrics Overview
Monthly Airbnb Revenue Variations & Income Potential in Esneux (2026)
Understanding the monthly revenue variations for Airbnb listings in Esneux is key to maximizing your short term rental income potential. Seasonality significantly impacts earnings. Our analysis, based on data from the past 12 months, shows that the peak revenue month for STRs in Esneux is typically July, while February often presents the lowest earnings, highlighting opportunities for strategic pricing adjustments during shoulder and low seasons. Explore the typical Airbnb income in Esneux across different performance tiers:
- Best-in-class properties (Top 10%) achieve $5,578+ monthly, often utilizing dynamic pricing and superior guest experiences.
- Strong performing properties (Top 25%) earn $3,535 or more, indicating effective management and desirable locations/amenities.
- Typical properties (Median) generate around $2,057 per month, representing the average market performance.
- Entry-level properties (Bottom 25%) see earnings around $1,094, often with potential for optimization.
Average Monthly Airbnb Earnings Trend in Esneux
Esneux Airbnb Occupancy Rate Trends (2026)
Maximize your bookings by understanding the Esneux STR occupancy trends. Seasonal demand shifts significantly influence how often properties are booked. Typically, Augustsees the highest demand (peak season occupancy), while January experiences the lowest (low season). Effective strategies, like adjusting minimum stays or offering promotions, can boost occupancy during slower periods. Here's how different property tiers perform in Esneux:
- Best-in-class properties (Top 10%) achieve 84%+ occupancy, indicating high desirability and potentially optimized availability.
- Strong performing properties (Top 25%) maintain 67% or higher occupancy, suggesting good market fit and guest satisfaction.
- Typical properties (Median) have an occupancy rate around 47%.
- Entry-level properties (Bottom 25%) average 25% occupancy, potentially facing higher vacancy.
Average Monthly Occupancy Rate Trend in Esneux
Average Daily Rate (ADR) Airbnb Trends in Esneux (2026)
Effective short term rental pricing strategy in Esneux involves understanding monthly ADR fluctuations. The Average Daily Rate (ADR) for Airbnb in Esneux typically peaks in July and dips lowest during March. Leveraging Airbnb dynamic pricing tools or strategies based on this seasonality can significantly boost revenue. Here's a look at the typical nightly rates achieved:
- Best-in-class properties (Top 10%) command rates of $304+ per night, often due to premium features or locations.
- Strong performing properties (Top 25%) achieve nightly rates of $244 or more.
- Typical properties (Median) charge around $162 per night.
- Entry-level properties (Bottom 25%) earn around $108 per night.
Average Daily Rate (ADR) Trend by Month in Esneux
Get Live Esneux Market Intelligence 👇

Explore Real-time Analytics
Airbnb Seasonality Analysis & Trends in Esneux (2026)
Peak Season (July, August, October)
- Revenue averages $3,512 per month
- Occupancy rates average 59.8%
- Daily rates average $211
Shoulder Season
- Revenue averages $2,501 per month
- Occupancy maintains around 45.9%
- Daily rates hold near $193
Low Season (January, February, November)
- Revenue drops to average $1,868 per month
- Occupancy decreases to average 36.8%
- Daily rates adjust to average $189
Seasonality Insights for Esneux
- The Airbnb seasonality in Esneux shows highly seasonal trends requiring careful strategy. While the sections above show seasonal averages, it's also insightful to look at the extremes:
- During the high season, the absolute peak month showcases Esneux's highest earning potential, with monthly revenues capable of climbing to $4,012, occupancy reaching a high of 66.6%, and ADRs peaking at $226.
- Conversely, the slowest single month of the year, typically falling within the low season, marks the market's lowest point. In this month, revenue might dip to $1,676, occupancy could drop to 32.7%, and ADRs may adjust down to $174.
- Understanding both the seasonal averages and these monthly peaks and troughs in revenue, occupancy, and ADR is crucial for maximizing your Airbnb profit potential in Esneux.
Seasonal Strategies for Maximizing Profit
- Peak Season: Maximize revenue through premium pricing and potentially longer minimum stays. Ensure high availability.
- Low Season: Offer competitive pricing, special promotions (e.g., extended stay discounts), and flexible cancellation policies. Target off-season travelers like remote workers or budget-conscious guests.
- Shoulder Seasons: Implement dynamic pricing that balances peak and low rates. Target weekend travelers or specific events. Offer slightly more flexible terms than peak season.
- Regularly analyze your own performance against these Esneux seasonality benchmarks and adjust your pricing and availability strategy accordingly.
Best Areas for Airbnb Investment in Esneux (2026)
Exploring the top neighborhoods for short-term rentals in Esneux? This section highlights key areas, outlining why they are attractive for hosts and guests, along with notable local attractions. Consider these locations based on your target guest profile and investment strategy.
| Neighborhood / Area | Why Host Here? (Target Guests & Appeal) | Key Attractions & Landmarks |
|---|---|---|
| Liège City Center | The vibrant heart of Liège, known for its rich culture, history, and lively atmosphere. It's a prime spot for tourists looking to explore museums, shopping, and the local gastronomy. | Liège-Guillemins Railway Station, La Boverie Museum, Palais des Congrès, Place Saint-Lambert, Coteaux de la Citadelle |
| Esneux Village | A picturesque village close to nature, offering a serene environment. A great escape for weekend travelers and those looking for hiking and outdoor activities in the region. | Les Jardins d'Annevoie, La rivière de l'Ourthe, Esneux Castle, Local hiking trails, Pont de la Rochette |
| Stavelot | Known for its historical significance and beautiful architecture, this small town attracts tourists interested in history and nature. It is also close to the famous Spa region. | Abbey of Stavelot, Francorchamps Circuit, The Water Falls of Coo, Stavelot Museum, Malmundarium |
| Spa | Famous for its thermal spas and nature, this area is ideal for wellness tourism. Visitors seek relaxation and rejuvenation in its beautiful surroundings. | Thermes de Spa, Spa-Francorchamps, Lake Warfaaz, Casino de Spa, Local hiking paths |
| Durbuy | Attractively considered the 'smallest town in the world', Durbuy is charming and offers a range of outdoor activities. Popular for romantic getaways and adventure tourism. | Durbuy Adventure, The Labyrinth of Durbuy, Topiary Park, Local shops and restaurants, River Ourthe |
| Han-sur-Lesse | A unique location famous for its caves and natural beauty, attracting tourists interested in geology and outdoor activities. A captivating site for nature lovers. | Han Caves, Wildlife Park, River Lesse, Kayaking activities, Local nature trails |
| Bouillon | A historic town dominated by a medieval castle, Bouillon attracts visitors interested in history and picturesque landscapes. Ideal for family trips and cultural exploration. | Bouillon Castle, Ducal Museum, Semois River, Walking paths in Bouillon, Local artisanal shops |
| Namur | The capital of Wallonia, Namur is known for its citadel and cultural landmarks. It draws a diverse crowd, including business travelers and tourists exploring the region's history. | Citadel of Namur, St. Aubin's Cathedral, Namur Archaeological Museum, Meuse River views, Local cafes and eateries |
Understanding Airbnb License Requirements & STR Laws in Esneux (2026)
While Esneux, Liège, Belgium currently shows low STR regulations, specific Airbnb license requirements might still exist or change. Always verify the latest short term rental regulations and Airbnb license requirements directly with local government authorities for Esneux to ensure full compliance before hosting.
(Source: AirROI data, 2026, finding no licensed listings among those analyzed)
Top Performing Airbnb Properties in Esneux (2026)
Benchmark your potential! Explore examples of top-performing Airbnb properties in Esneuxbased on Trailing Twelve Month (TTM) revenue. Analyze their characteristics, revenue, occupancy rate, and ADR to understand what drives success in this market.

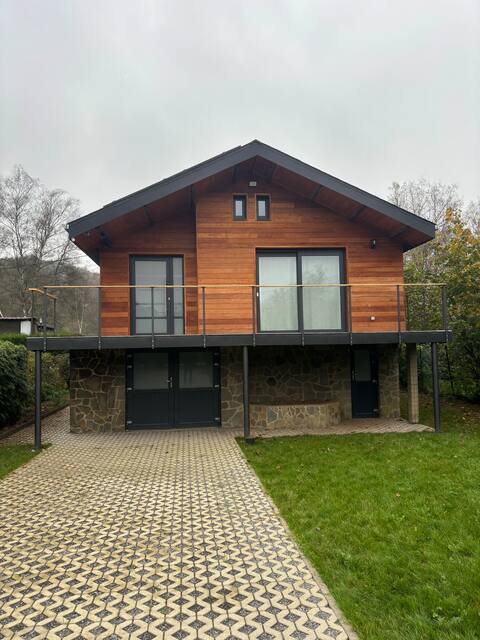
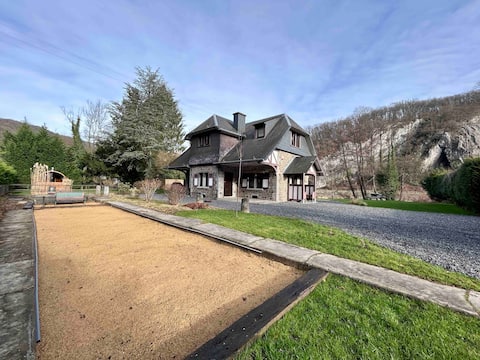
Unique and attractive holiday home at Ourthe
Entire Place • 7 bedrooms
L'Ourthéa
Entire Place • 3 bedrooms

Waterfront | Boho | King Bed | Garden
Entire Place • 1 bedroom
- "L'Écluse Simon" - Charming cottage -
Entire Place • 3 bedrooms

The Sweet Shore - Tilff (Liège)
Entire Place • 3 bedrooms

Esneux Valley terraces by ArdenneRental
Entire Place • 4 bedrooms
Note: Performance varies based on location, size, amenities, seasonality, and management quality. Data reflects the past 12 months.
Top Performing Airbnb Hosts in Esneux (2026)
Learn from the best! This table showcases top-performing Airbnb hosts in Esneux based on the number of properties managed and estimated total revenue over the past year. Analyze their scale and performance metrics.
| Host Name | Properties | Grossing Revenue | Stay Reviews | Avg Rating |
|---|---|---|---|---|
| Fabien | 5 | $247,313 | 481 | 4.85/5.0 |
| Jolande | 1 | $102,823 | 199 | 4.85/5.0 |
| Bastien | 1 | $96,900 | 14 | 4.79/5.0 |
| Olivia Et Loïc | 2 | $85,773 | 215 | 4.92/5.0 |
| Christophe | 1 | $65,887 | 223 | 4.94/5.0 |
| FineNest | 2 | $64,074 | 140 | 4.91/5.0 |
| Alex | 2 | $55,446 | 625 | 4.90/5.0 |
| Cécile | 1 | $45,671 | 19 | 4.95/5.0 |
| Moseka | 2 | $44,594 | 90 | 4.83/5.0 |
| Robert | 1 | $38,510 | 39 | 4.97/5.0 |
Analyzing the strategies of top hosts, such as their property selection, pricing, and guest communication, can offer valuable lessons for optimizing your own Airbnb operations in Esneux.
Dive Deeper: Advanced Esneux STR Market Data (2026)
Ready to unlock more insights? AirROI provides access to advanced metrics and comprehensive Airbnb data for Esneux. Explore detailed analytics beyond this report to refine your investment strategy, optimize pricing, and maximize your vacation rental profits.
Explore Advanced MetricsEsneux Short-Term Rental Market Composition (2026): Property & Room Types
Room Type Distribution
Property Type Distribution
Market Composition Insights for Esneux
- The Esneux Airbnb market composition is heavily skewed towards Entire Home/Apt listings, which make up 88.9% of the 54 active rentals. This indicates strong guest preference for privacy and space.
- Looking at the property type distribution in Esneux, House properties are the most common (68.5%), reflecting the local real estate landscape.
- Houses represent a significant 68.5% portion, catering likely to families or larger groups.
- The presence of 5.6% Hotel/Boutique listings indicates integration with traditional hospitality.
- Smaller segments like others, outdoor/unique (combined 3.8%) offer potential for unique stay experiences.
Esneux Airbnb Room Capacity Analysis (2026): Bedroom Distribution
Distribution of Listings by Number of Bedrooms
Room Capacity Insights for Esneux
- The dominant room capacity in Esneux is 1 bedroom listings, making up 35.2% of the market. This suggests a strong demand for properties suitable for couples or solo travelers.
- Together, 1 bedroom and 2 bedrooms properties represent 66.7% of the active Airbnb listings in Esneux, indicating a high concentration in these sizes.
- A significant 24.1% of listings offer 3+ bedrooms, catering to larger groups and families seeking more space in Esneux.
Esneux Vacation Rental Guest Capacity Trends (2026)
Distribution of Listings by Guest Capacity
Guest Capacity Insights for Esneux
- The most common guest capacity trend in Esneux vacation rentals is listings accommodating 4 guests (31.5%). This suggests the primary traveler segment is likely small families or groups.
- Properties designed for 4 guests and 2 guests dominate the Esneux STR market, accounting for 55.6% of listings.
- 26.0% of properties accommodate 6+ guests, serving the market segment for larger families or group travel in Esneux.
- On average, properties in Esneux are equipped to host 3.9 guests.
Esneux Airbnb Booking Patterns (2026): Available vs. Booked Days
Available Days Distribution
Booked Days Distribution
Booking Pattern Insights for Esneux
- The most common availability pattern in Esneux falls within the 181-270 days range, representing 42.6% of listings. This suggests many properties have significant open periods on their calendars.
- Approximately 68.5% of listings show high availability (181+ days open annually), indicating potential for increased bookings or specific owner usage patterns.
- For booked days, the 91-180 days range is most frequent in Esneux (40.7%), reflecting common guest stay durations or potential owner blocking patterns.
- A notable 33.4% of properties secure long booking periods (181+ days booked per year), highlighting successful long-term rental strategies or significant owner usage.
Esneux Airbnb Minimum Stay Requirements Analysis
Distribution of Listings by Minimum Night Requirement
1 Night
16 listings
29.6% of total
2 Nights
23 listings
42.6% of total
3 Nights
2 listings
3.7% of total
30+ Nights
13 listings
24.1% of total
Key Insights
- The most prevalent minimum stay requirement in Esneux is 2 Nights, adopted by 42.6% of listings. This highlights the market's preference for shorter, flexible bookings.
- A strong majority (72.2%) of the Esneux Airbnb data shows acceptance of very short stays (1-2 nights), indicating a dynamic, high-turnover market.
- A significant segment (24.1%) caters to monthly stays (30+ nights) in Esneux, pointing to opportunities in the extended-stay market.
Recommendations
- Align with the market by considering a 2 Nights minimum stay, as 42.6% of Esneux hosts use this setting.
- If feasible, allowing 1-night stays, especially midweek or during low season, could capture last-minute bookings, as only 29.6% currently do.
- Explore offering discounts for stays of 30+ nights to attract the 24.1% of the market seeking extended stays.
- Adjust minimum nights based on seasonality – potentially shorter during low season and longer during peak demand periods in Esneux.
Esneux Airbnb Cancellation Policy Trends Analysis (2026)
Limited
3 listings
5.6% of total
Flexible
14 listings
25.9% of total
Moderate
18 listings
33.3% of total
Firm
12 listings
22.2% of total
Strict
7 listings
13% of total
Cancellation Policy Insights for Esneux
- The prevailing Airbnb cancellation policy trend in Esneux is Moderate, used by 33.3% of listings.
- There's a relatively balanced mix between guest-friendly (59.2%) and stricter (35.2%) policies, offering choices for different guest needs.
Recommendations for Hosts
- Consider adopting a Moderate policy to align with the 33.3% market standard in Esneux.
- Using a Strict policy might deter some guests, as only 13% of listings use it. Evaluate if potential revenue protection outweighs possible lower booking rates.
- Regularly review your cancellation policy against competitors and market demand shifts in Esneux.
Esneux STR Booking Lead Time Analysis (2026)
Average Booking Lead Time by Month
Booking Lead Time Insights for Esneux
- The overall average booking lead time for vacation rentals in Esneux is 52 days.
- Guests book furthest in advance for stays during July (average 90 days), likely coinciding with peak travel demand or local events.
- The shortest booking windows occur for stays in February (average 26 days), indicating more last-minute travel plans during this time.
- Seasonally, Summer (68 days avg.) sees the longest lead times, while Winter (41 days avg.) has the shortest, reflecting typical travel planning cycles.
Recommendations for Hosts
- Use the overall average lead time (52 days) as a baseline for your pricing and availability strategy in Esneux.
- For July stays, consider implementing length-of-stay discounts or slightly higher rates for bookings made less than 90 days out to capitalize on advance planning.
- Target marketing efforts for the Summer season well in advance (at least 68 days) to capture early planners.
- Monitor your own booking lead times against these Esneux averages to identify opportunities for dynamic pricing adjustments.
Popular & Essential Airbnb Amenities in Esneux (2026)
Amenity Prevalence
Amenity Insights for Esneux
- Essential amenities in Esneux that guests expect include: Wifi, Heating. Lacking these (any) could significantly impact bookings.
- Popular amenities like Kitchen, Smoke alarm, Hangers are common but not universal. Offering these can provide a competitive edge.
Recommendations for Hosts
- Ensure your listing includes all essential amenities for Esneux: Wifi, Heating.
- Prioritize adding missing essentials: Wifi, Heating.
- Consider adding popular differentiators like Kitchen or Smoke alarm to increase appeal.
- Highlight unique or less common amenities you offer (e.g., hot tub, dedicated workspace, EV charger) in your listing description and photos.
- Regularly check competitor amenities in Esneux to stay competitive.
Esneux Airbnb Guest Demographics & Profile Analysis (2026)
Guest Profile Summary for Esneux
- The typical guest profile for Airbnb in Esneux consists of a mix of domestic (36%) and international guests, with top international origins including Netherlands, typically belonging to the Post-2000s (Gen Z/Alpha) group (50%), primarily speaking English or French.
- Domestic travelers account for 36.0% of guests.
- Key international markets include Belgium (36%) and Netherlands (26.9%).
- Top languages spoken are English (35.6%) followed by French (19.7%).
- A significant demographic segment is the Post-2000s (Gen Z/Alpha) group, representing 50% of guests.
Recommendations for Hosts
- Focus marketing internationally, particularly towards travelers from Netherlands.
- Tailor amenities and listing descriptions to appeal to the dominant Post-2000s (Gen Z/Alpha) demographic (e.g., highlight fast WiFi, smart home features, local guides).
- Highlight unique local experiences or amenities relevant to the primary guest profile.
- Consider seasonal promotions aligned with peak travel times for key origin markets.
Nearby Short-Term Rental Market Comparison
How does the Esneux Airbnb market stack up against its neighbors? Compare key performance metrics like average monthly revenue, ADR, and occupancy rates in surrounding areas to understand the broader regional STR landscape.
| Market | Active Properties | Monthly Revenue | Daily Rate | Avg. Occupancy |
|---|---|---|---|---|
| Raamsdonksveer | 16 | $7,756 | $736.17 | 38% |
| Haghorst | 11 | $5,995 | $480.40 | 40% |
| Baarlo | 20 | $5,442 | $332.61 | 51% |
| Merksplas | 12 | $5,367 | $356.64 | 43% |
| Incourt | 13 | $4,412 | $303.48 | 52% |
| Wellin | 12 | $4,365 | $446.64 | 42% |
| Aubel | 26 | $4,191 | $283.88 | 46% |
| Dion | 12 | $4,104 | $270.32 | 50% |
| Bertogne | 26 | $3,839 | $325.90 | 42% |
| Mettet | 21 | $3,771 | $283.66 | 42% |