Bassenge Airbnb Market Analysis 2025: Short Term Rental Data & Vacation Rental Statistics in Liège, Belgium
Is Airbnb profitable in Bassenge in 2025? Explore comprehensive Airbnb analytics for Bassenge, Liège, Belgium to uncover income potential. This 2025 STR market report for Bassenge, based on AirROI data from August 2024 to July 2025, reveals key trends in the niche market of 19 active listings.
Whether you're considering an Airbnb investment in Bassenge, optimizing your existing vacation rental, or exploring rental arbitrage opportunities, understanding the Bassenge Airbnb data is crucial. Leveraging the low regulation environment is key to maximizing your short term rental income potential. Let's dive into the specifics.
Key Bassenge Airbnb Performance Metrics Overview
Monthly Airbnb Revenue Variations & Income Potential in Bassenge (2025)
Understanding the monthly revenue variations for Airbnb listings in Bassenge is key to maximizing your short term rental income potential. Seasonality significantly impacts earnings. Our analysis, based on data from the past 12 months, shows that the peak revenue month for STRs in Bassenge is typically August, while February often presents the lowest earnings, highlighting opportunities for strategic pricing adjustments during shoulder and low seasons. Explore the typical Airbnb income in Bassenge across different performance tiers:
- Best-in-class properties (Top 10%) achieve $2,955+ monthly, often utilizing dynamic pricing and superior guest experiences.
- Strong performing properties (Top 25%) earn $1,694 or more, indicating effective management and desirable locations/amenities.
- Typical properties (Median) generate around $1,130 per month, representing the average market performance.
- Entry-level properties (Bottom 25%) see earnings around $744, often with potential for optimization.
Average Monthly Airbnb Earnings Trend in Bassenge
Bassenge Airbnb Occupancy Rate Trends (2025)
Maximize your bookings by understanding the Bassenge STR occupancy trends. Seasonal demand shifts significantly influence how often properties are booked. Typically, Augustsees the highest demand (peak season occupancy), while February experiences the lowest (low season). Effective strategies, like adjusting minimum stays or offering promotions, can boost occupancy during slower periods. Here's how different property tiers perform in Bassenge:
- Best-in-class properties (Top 10%) achieve 72%+ occupancy, indicating high desirability and potentially optimized availability.
- Strong performing properties (Top 25%) maintain 50% or higher occupancy, suggesting good market fit and guest satisfaction.
- Typical properties (Median) have an occupancy rate around 33%.
- Entry-level properties (Bottom 25%) average 24% occupancy, potentially facing higher vacancy.
Average Monthly Occupancy Rate Trend in Bassenge
Average Daily Rate (ADR) Airbnb Trends in Bassenge (2025)
Effective short term rental pricing strategy in Bassenge involves understanding monthly ADR fluctuations. The Average Daily Rate (ADR) for Airbnb in Bassenge typically peaks in July and dips lowest during February. Leveraging Airbnb dynamic pricing tools or strategies based on this seasonality can significantly boost revenue. Here's a look at the typical nightly rates achieved:
- Best-in-class properties (Top 10%) command rates of $158+ per night, often due to premium features or locations.
- Strong performing properties (Top 25%) achieve nightly rates of $134 or more.
- Typical properties (Median) charge around $104 per night.
- Entry-level properties (Bottom 25%) earn around $81 per night.
Average Daily Rate (ADR) Trend by Month in Bassenge
Get Live Bassenge Market Intelligence 👇

Explore Real-time Analytics
Airbnb Seasonality Analysis & Trends in Bassenge (2025)
Peak Season (August, September, May)
- Revenue averages $2,416 per month
- Occupancy rates average 50.5%
- Daily rates average $136
Shoulder Season
- Revenue averages $1,564 per month
- Occupancy maintains around 35.9%
- Daily rates hold near $135
Low Season (February, June, November)
- Revenue drops to average $1,158 per month
- Occupancy decreases to average 33.7%
- Daily rates adjust to average $133
Seasonality Insights for Bassenge
- The Airbnb seasonality in Bassenge shows highly seasonal trends requiring careful strategy. While the sections above show seasonal averages, it's also insightful to look at the extremes:
- During the high season, the absolute peak month showcases Bassenge's highest earning potential, with monthly revenues capable of climbing to $3,131, occupancy reaching a high of 70.5%, and ADRs peaking at $155.
- Conversely, the slowest single month of the year, typically falling within the low season, marks the market's lowest point. In this month, revenue might dip to $1,077, occupancy could drop to 32.1%, and ADRs may adjust down to $122.
- Understanding both the seasonal averages and these monthly peaks and troughs in revenue, occupancy, and ADR is crucial for maximizing your Airbnb profit potential in Bassenge.
Seasonal Strategies for Maximizing Profit
- Peak Season: Maximize revenue through premium pricing and potentially longer minimum stays. Ensure high availability.
- Low Season: Offer competitive pricing, special promotions (e.g., extended stay discounts), and flexible cancellation policies. Target off-season travelers like remote workers or budget-conscious guests.
- Shoulder Seasons: Implement dynamic pricing that balances peak and low rates. Target weekend travelers or specific events. Offer slightly more flexible terms than peak season.
- Regularly analyze your own performance against these Bassenge seasonality benchmarks and adjust your pricing and availability strategy accordingly.
Best Areas for Airbnb Investment in Bassenge (2025)
Exploring the top neighborhoods for short-term rentals in Bassenge? This section highlights key areas, outlining why they are attractive for hosts and guests, along with notable local attractions. Consider these locations based on your target guest profile and investment strategy.
| Neighborhood / Area | Why Host Here? (Target Guests & Appeal) | Key Attractions & Landmarks |
|---|---|---|
| Bassenge Town Center | The central area of Bassenge is a quaint neighborhood featuring local shops and restaurants. It is attractive to families and couples who want a quiet stay near amenities. | Church of St. John the Baptist, Local cafes and bistros, Village parks, Historical sites, Boutique shops |
| Vieux Ville | A historic part of Bassenge known for its picturesque streets and charming architecture. This area appeals to visitors interested in history and culture. | Old Town architecture, Cultural festivals, Artisan shops, Local museums |
| Jupille-sur-Meuse | A beautiful area along the Meuse River, offering scenic views and a tranquil environment. Ideal for nature lovers and those looking for outdoor activities. | Meuse River walks, Fishing spots, Picnic areas, Cycling paths |
| La Gleize | A serene and green neighborhood known for its natural beauty and outdoor possibilities. Attracts those looking for a rural escape just outside of the city. | Forest trails, Natural parks, Wildlife observation, Photography spots |
| Rue de la Station | A convenient location next to public transport making it easy to access surrounding areas and Liège. Good for travelers who prioritize accessibility. | Train station access, Local markets, Shopping options, Restaurants |
| Côte de Fallais | A hilly area offering splendid views over Bassenge and the surrounding landscape, perfect for visitors who enjoy hikes and scenic drives. | Hilltop viewpoints, Hiking trails, Vineyards, Scenic outlooks |
| Crisnée | A nearby village with a peaceful atmosphere, perfect for a complete rural experience while remaining close to Bassenge's amenities and attractions. | Charming countryside, Local farm visits, Quiet retreats, Cultural heritage sites |
| Lixhe | A small, charming village along the Meuse river, known for its tranquility and lovely views of the water. Ideal for romantic getaways and fishing enthusiasts. | Meuse River views, Quiet quay areas, Fishing opportunities, Rural walks |
Understanding Airbnb License Requirements & STR Laws in Bassenge (2025)
While Bassenge, Liège, Belgium currently shows low STR regulations, specific Airbnb license requirements might still exist or change. Always verify the latest short term rental regulations and Airbnb license requirements directly with local government authorities for Bassenge to ensure full compliance before hosting.
(Source: AirROI data, 2025, finding no licensed listings among those analyzed)
Top Performing Airbnb Properties in Bassenge (2025)
Benchmark your potential! Explore examples of top-performing Airbnb properties in Bassengebased on Trailing Twelve Month (TTM) revenue. Analyze their characteristics, revenue, occupancy rate, and ADR to understand what drives success in this market.
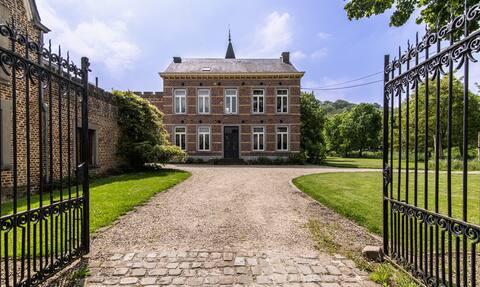
Estate with castle only for your party.
Entire Place • 10 bedrooms

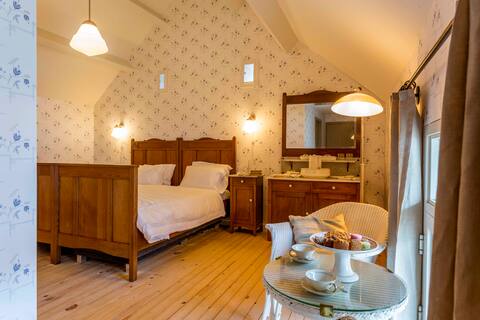
Gîte du Tilleul, peaceful in a green setting
Entire Place • 2 bedrooms
Art deco Room in carréhoeve near Maastricht
Private Room • N/A
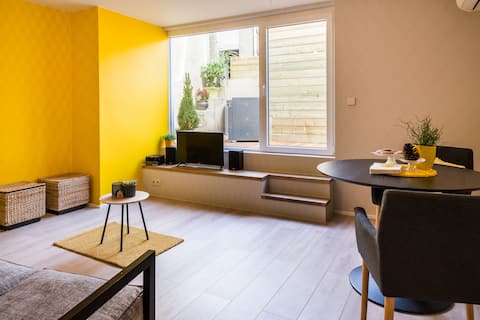
Apartment in nature near Liège and Maastricht
Entire Place • 1 bedroom
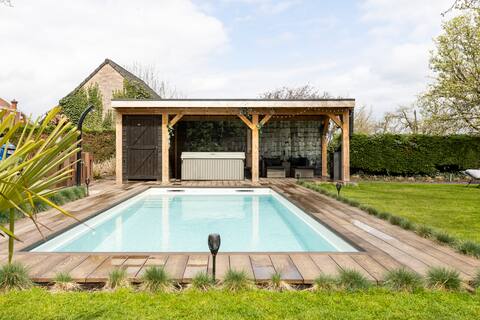
Stylish 4pers suite with jacuzzi and swimmingpool
Private Room • 2 bedrooms

studio on the hillsides
Entire Place • 1 bedroom
Note: Performance varies based on location, size, amenities, seasonality, and management quality. Data reflects the past 12 months.
Top Performing Airbnb Hosts in Bassenge (2025)
Learn from the best! This table showcases top-performing Airbnb hosts in Bassenge based on the number of properties managed and estimated total revenue over the past year. Analyze their scale and performance metrics.
| Host Name | Properties | Grossing Revenue | Stay Reviews | Avg Rating |
|---|---|---|---|---|
| Karel | 1 | $81,763 | 4 | 5.00/5.0 |
| Clementine | 5 | $60,796 | 324 | 4.86/5.0 |
| Marga | 3 | $37,702 | 14 | 4.78/5.0 |
| Emilie | 1 | $29,761 | 36 | 4.92/5.0 |
| RV Home | 2 | $18,729 | 53 | 4.63/5.0 |
| Roger | 1 | $13,250 | 74 | 4.81/5.0 |
| Veronique | 1 | $11,704 | 51 | 4.82/5.0 |
| Damien | 1 | $7,931 | 102 | 4.86/5.0 |
| Joëlle | 1 | $5,925 | 203 | 4.77/5.0 |
| Lionel | 1 | $5,518 | 18 | 4.67/5.0 |
Analyzing the strategies of top hosts, such as their property selection, pricing, and guest communication, can offer valuable lessons for optimizing your own Airbnb operations in Bassenge.
Dive Deeper: Advanced Bassenge STR Market Data (2025)
Ready to unlock more insights? AirROI provides access to advanced metrics and comprehensive Airbnb data for Bassenge. Explore detailed analytics beyond this report to refine your investment strategy, optimize pricing, and maximize your vacation rental profits.
Explore Advanced MetricsBassenge Short-Term Rental Market Composition (2025): Property & Room Types
Room Type Distribution
Property Type Distribution
Market Composition Insights for Bassenge
- The Bassenge Airbnb market composition is heavily skewed towards Entire Home/Apt listings, which make up 57.9% of the 19 active rentals. This indicates strong guest preference for privacy and space.
- However, a notable 36.8% share for Private Rooms suggests opportunities for budget-conscious travelers or hosts renting out spare rooms.
- Looking at the property type distribution in Bassenge, Apartment/Condo properties are the most common (36.8%), reflecting the local real estate landscape.
- The presence of 36.8% Hotel/Boutique listings indicates integration with traditional hospitality.
Bassenge Airbnb Room Capacity Analysis (2025): Bedroom Distribution
Distribution of Listings by Number of Bedrooms
Room Capacity Insights for Bassenge
- The dominant room capacity in Bassenge is 1 bedroom listings, making up 42.1% of the market. This suggests a strong demand for properties suitable for couples or solo travelers.
- Together, 1 bedroom and 2 bedrooms properties represent 63.2% of the active Airbnb listings in Bassenge, indicating a high concentration in these sizes.
- Listings with 3+ bedrooms (5.3%) represent a smaller niche, potentially indicating an underserved market for larger group accommodations in Bassenge.
Bassenge Vacation Rental Guest Capacity Trends (2025)
Distribution of Listings by Guest Capacity
Guest Capacity Insights for Bassenge
- The most common guest capacity trend in Bassenge vacation rentals is listings accommodating 2 guests (36.8%). This suggests the primary traveler segment is likely couples or solo travelers.
- Properties designed for 2 guests and 4 guests dominate the Bassenge STR market, accounting for 52.6% of listings.
- On average, properties in Bassenge are equipped to host 1.9 guests.
Bassenge Airbnb Booking Patterns (2025): Available vs. Booked Days
Available Days Distribution
Booked Days Distribution
Booking Pattern Insights for Bassenge
- The most common availability pattern in Bassenge falls within the 181-270 days range, representing 47.4% of listings. This suggests many properties have significant open periods on their calendars.
- Approximately 89.5% of listings show high availability (181+ days open annually), indicating potential for increased bookings or specific owner usage patterns.
- For booked days, the 91-180 days range is most frequent in Bassenge (42.1%), reflecting common guest stay durations or potential owner blocking patterns.
- A notable 15.8% of properties secure long booking periods (181+ days booked per year), highlighting successful long-term rental strategies or significant owner usage.
Bassenge Airbnb Minimum Stay Requirements Analysis
Distribution of Listings by Minimum Night Requirement
1 Night
4 listings
21.1% of total
2 Nights
8 listings
42.1% of total
3 Nights
2 listings
10.5% of total
4-6 Nights
1 listings
5.3% of total
30+ Nights
4 listings
21.1% of total
Key Insights
- The most prevalent minimum stay requirement in Bassenge is 2 Nights, adopted by 42.1% of listings. This highlights the market's preference for shorter, flexible bookings.
- A strong majority (63.2%) of the Bassenge Airbnb data shows acceptance of very short stays (1-2 nights), indicating a dynamic, high-turnover market.
- A significant segment (21.1%) caters to monthly stays (30+ nights) in Bassenge, pointing to opportunities in the extended-stay market.
Recommendations
- Align with the market by considering a 2 Nights minimum stay, as 42.1% of Bassenge hosts use this setting.
- If feasible, allowing 1-night stays, especially midweek or during low season, could capture last-minute bookings, as only 21.1% currently do.
- Explore offering discounts for stays of 30+ nights to attract the 21.1% of the market seeking extended stays.
- Adjust minimum nights based on seasonality – potentially shorter during low season and longer during peak demand periods in Bassenge.
Bassenge Airbnb Cancellation Policy Trends Analysis (2025)
Flexible
3 listings
16.7% of total
Moderate
7 listings
38.9% of total
Strict
8 listings
44.4% of total
Cancellation Policy Insights for Bassenge
- The prevailing Airbnb cancellation policy trend in Bassenge is Strict, used by 44.4% of listings.
- There's a relatively balanced mix between guest-friendly (55.6%) and stricter (44.4%) policies, offering choices for different guest needs.
Recommendations for Hosts
- Consider adopting a Strict policy to align with the 44.4% market standard in Bassenge.
- With 44.4% using Strict terms, this is a viable option in Bassenge, particularly for high-value properties or during peak demand periods.
- Regularly review your cancellation policy against competitors and market demand shifts in Bassenge.
Bassenge STR Booking Lead Time Analysis (2025)
Average Booking Lead Time by Month
Booking Lead Time Insights for Bassenge
- The overall average booking lead time for vacation rentals in Bassenge is 61 days.
- Guests book furthest in advance for stays during July (average 108 days), likely coinciding with peak travel demand or local events.
- The shortest booking windows occur for stays in January (average 27 days), indicating more last-minute travel plans during this time.
- Seasonally, Summer (74 days avg.) sees the longest lead times, while Winter (46 days avg.) has the shortest, reflecting typical travel planning cycles.
Recommendations for Hosts
- Use the overall average lead time (61 days) as a baseline for your pricing and availability strategy in Bassenge.
- For July stays, consider implementing length-of-stay discounts or slightly higher rates for bookings made less than 108 days out to capitalize on advance planning.
- Target marketing efforts for the Summer season well in advance (at least 74 days) to capture early planners.
- Monitor your own booking lead times against these Bassenge averages to identify opportunities for dynamic pricing adjustments.
Popular & Essential Airbnb Amenities in Bassenge (2025)
Amenity Prevalence
Amenity Insights for Bassenge
- Essential amenities in Bassenge that guests expect include: Wifi, Smoke alarm. Lacking these (any) could significantly impact bookings.
- Popular amenities like Free parking on premises, Heating, Hangers are common but not universal. Offering these can provide a competitive edge.
Recommendations for Hosts
- Ensure your listing includes all essential amenities for Bassenge: Wifi, Smoke alarm.
- Consider adding popular differentiators like Free parking on premises or Heating to increase appeal.
- Highlight unique or less common amenities you offer (e.g., hot tub, dedicated workspace, EV charger) in your listing description and photos.
- Regularly check competitor amenities in Bassenge to stay competitive.
Bassenge Airbnb Guest Demographics & Profile Analysis (2025)
Guest Profile Summary for Bassenge
- The typical guest profile for Airbnb in Bassenge consists of predominantly international visitors (80%), with top international origins including Belgium, typically belonging to the Post-2000s (Gen Z/Alpha) group (50%), primarily speaking English or French.
- Domestic travelers account for 19.7% of guests.
- Key international markets include Netherlands (39.4%) and Belgium (19.7%).
- Top languages spoken are English (30.4%) followed by French (19.6%).
- A significant demographic segment is the Post-2000s (Gen Z/Alpha) group, representing 50% of guests.
Recommendations for Hosts
- Focus marketing internationally, particularly towards travelers from Belgium.
- Tailor amenities and listing descriptions to appeal to the dominant Post-2000s (Gen Z/Alpha) demographic (e.g., highlight fast WiFi, smart home features, local guides).
- Highlight unique local experiences or amenities relevant to the primary guest profile.
- Consider seasonal promotions aligned with peak travel times for key origin markets.
Nearby Short-Term Rental Market Comparison
How does the Bassenge Airbnb market stack up against its neighbors? Compare key performance metrics like average monthly revenue, ADR, and occupancy rates in surrounding areas to understand the broader regional STR landscape.
| Market | Active Properties | Monthly Revenue | Daily Rate | Avg. Occupancy |
|---|---|---|---|---|
| Raamsdonksveer | 15 | $5,631 | $599.45 | 40% |
| Merksplas | 12 | $5,353 | $330.65 | 46% |
| Haghorst | 11 | $5,010 | $461.73 | 39% |
| Baarlo | 22 | $4,817 | $302.32 | 53% |
| Jemeppe-sur-Sambre | 10 | $4,197 | $498.39 | 47% |
| Dion | 13 | $4,192 | $263.67 | 55% |
| Incourt | 12 | $4,069 | $315.39 | 45% |
| Wellin | 11 | $3,871 | $266.55 | 43% |
| Bertogne | 26 | $3,832 | $295.60 | 42% |
| Aubel | 28 | $3,795 | $271.70 | 46% |