Heers Airbnb Market Analysis 2026: Short Term Rental Data & Vacation Rental Statistics in Limburg, Belgium
Is Airbnb profitable in Heers in 2026? Explore comprehensive Airbnb analytics for Heers, Limburg, Belgium to uncover income potential. This 2026 STR market report for Heers, based on AirROI data from February 2025 to January 2026, reveals key trends in the niche market of 30 active listings.
Whether you're considering an Airbnb investment in Heers, optimizing your existing vacation rental, or exploring rental arbitrage opportunities, understanding the Heers Airbnb data is crucial. Leveraging the low regulation environment is key to maximizing your short term rental income potential. Let's dive into the specifics.
Key Heers Airbnb Performance Metrics Overview
Monthly Airbnb Revenue Variations & Income Potential in Heers (2026)
Understanding the monthly revenue variations for Airbnb listings in Heers is key to maximizing your short term rental income potential. Seasonality significantly impacts earnings. Our analysis, based on data from the past 12 months, shows that the peak revenue month for STRs in Heers is typically August, while January often presents the lowest earnings, highlighting opportunities for strategic pricing adjustments during shoulder and low seasons. Explore the typical Airbnb income in Heers across different performance tiers:
- Best-in-class properties (Top 10%) achieve $11,401+ monthly, often utilizing dynamic pricing and superior guest experiences.
- Strong performing properties (Top 25%) earn $3,201 or more, indicating effective management and desirable locations/amenities.
- Typical properties (Median) generate around $1,636 per month, representing the average market performance.
- Entry-level properties (Bottom 25%) see earnings around $904, often with potential for optimization.
Average Monthly Airbnb Earnings Trend in Heers
Heers Airbnb Occupancy Rate Trends (2026)
Maximize your bookings by understanding the Heers STR occupancy trends. Seasonal demand shifts significantly influence how often properties are booked. Typically, Augustsees the highest demand (peak season occupancy), while January experiences the lowest (low season). Effective strategies, like adjusting minimum stays or offering promotions, can boost occupancy during slower periods. Here's how different property tiers perform in Heers:
- Best-in-class properties (Top 10%) achieve 73%+ occupancy, indicating high desirability and potentially optimized availability.
- Strong performing properties (Top 25%) maintain 54% or higher occupancy, suggesting good market fit and guest satisfaction.
- Typical properties (Median) have an occupancy rate around 34%.
- Entry-level properties (Bottom 25%) average 21% occupancy, potentially facing higher vacancy.
Average Monthly Occupancy Rate Trend in Heers
Average Daily Rate (ADR) Airbnb Trends in Heers (2026)
Effective short term rental pricing strategy in Heers involves understanding monthly ADR fluctuations. The Average Daily Rate (ADR) for Airbnb in Heers typically peaks in December and dips lowest during February. Leveraging Airbnb dynamic pricing tools or strategies based on this seasonality can significantly boost revenue. Here's a look at the typical nightly rates achieved:
- Best-in-class properties (Top 10%) command rates of $847+ per night, often due to premium features or locations.
- Strong performing properties (Top 25%) achieve nightly rates of $333 or more.
- Typical properties (Median) charge around $153 per night.
- Entry-level properties (Bottom 25%) earn around $101 per night.
Average Daily Rate (ADR) Trend by Month in Heers
Get Live Heers Market Intelligence 👇
Explore Real-time Analytics
Airbnb Seasonality Analysis & Trends in Heers (2026)
Peak Season (August, October, July)
- Revenue averages $4,980 per month
- Occupancy rates average 47.9%
- Daily rates average $303
Shoulder Season
- Revenue averages $4,391 per month
- Occupancy maintains around 39.6%
- Daily rates hold near $298
Low Season (January, February, March)
- Revenue drops to average $2,781 per month
- Occupancy decreases to average 30.6%
- Daily rates adjust to average $280
Seasonality Insights for Heers
- The Airbnb seasonality in Heers shows moderate seasonality with distinct peak and low periods. While the sections above show seasonal averages, it's also insightful to look at the extremes:
- During the high season, the absolute peak month showcases Heers's highest earning potential, with monthly revenues capable of climbing to $5,129, occupancy reaching a high of 50.3%, and ADRs peaking at $319.
- Conversely, the slowest single month of the year, typically falling within the low season, marks the market's lowest point. In this month, revenue might dip to $2,660, occupancy could drop to 21.5%, and ADRs may adjust down to $270.
- Understanding both the seasonal averages and these monthly peaks and troughs in revenue, occupancy, and ADR is crucial for maximizing your Airbnb profit potential in Heers.
Seasonal Strategies for Maximizing Profit
- Peak Season: Maximize revenue through premium pricing and potentially longer minimum stays. Ensure high availability.
- Low Season: Offer competitive pricing, special promotions (e.g., extended stay discounts), and flexible cancellation policies. Target off-season travelers like remote workers or budget-conscious guests.
- Shoulder Seasons: Implement dynamic pricing that balances peak and low rates. Target weekend travelers or specific events. Offer slightly more flexible terms than peak season.
- Regularly analyze your own performance against these Heers seasonality benchmarks and adjust your pricing and availability strategy accordingly.
Best Areas for Airbnb Investment in Heers (2026)
Exploring the top neighborhoods for short-term rentals in Heers? This section highlights key areas, outlining why they are attractive for hosts and guests, along with notable local attractions. Consider these locations based on your target guest profile and investment strategy.
| Neighborhood / Area | Why Host Here? (Target Guests & Appeal) | Key Attractions & Landmarks |
|---|---|---|
| Maastricht | A charming city just across the border in the Netherlands, known for its historic architecture and vibrant culture. It's a hub for tourists visiting both the Netherlands and Belgium, making it an ideal spot for Airbnb hosting. | Vrijthof Square, Maastricht Underground, Mosa Trajectum, St. Servatius Church, Wilhelminabrug, Market Square |
| Tongeren | The oldest town in Belgium, known for its rich history and antique market. It attracts visitors interested in history and culture, making it a great choice for short-term rental investments. | Tongeren Market, Gallo-Roman Museum, Basilica of Our Lady, Antique Market, Horse Market |
| Genk | A vibrant city known for its industrial heritage and proximity to beautiful nature parks. It's popular with those looking for a getaway in nature, making it a suitable location for vacation rentals. | Bokrijk Park, C-mine, Millennium Golf, Japanese Garden, Ter Dolen Castle |
| Hasselt | Known for its fashionable lifestyle, gin distilleries and botanical garden, Hasselt attracts visitors looking for a mix of relaxation and style, perfect for Airbnb hosting. | Jenever Museum, Japanese Garden, Fashion Museum, Hasselt City Park, Hasselt Zoo |
| Louvain-La-Neuve | A lively university town with a unique architecture and cultural events. It's popular among students and young professionals, providing a steady stream of short-term rental opportunities. | Louvain-la-Neuve Science Park, Aquascope, Old Louvain, Louvain-la-Neuve City Hall, Cultural Centre |
| Bilzen | A picturesque town known for its heritage and natural landscapes. Attracts tourists looking for peace and quiet, making it attractive for Airbnb hosts. | Bilzen Castle, Kasteel Ter Borch, Vinopolis, Park Biesen, Saint Martin's Church |
| Berloz | A charming small town that offers a serene atmosphere. It's a great spot for guests looking for tranquility and a taste of Belgian countryside life. | Church of Saint Martin, Local parks, Traditional Belgian countryside |
| Alden Biesen | Famous for its castle and park, Alden Biesen draws history enthusiasts and nature lovers alike, making it a great destination for short-term rentals. | Alden Biesen Castle, Gardens of Alden Biesen, Local wine tours, Historic architecture |
Understanding Airbnb License Requirements & STR Laws in Heers (2026)
While Heers, Limburg, Belgium currently shows low STR regulations, specific Airbnb license requirements might still exist or change. Always verify the latest short term rental regulations and Airbnb license requirements directly with local government authorities for Heers to ensure full compliance before hosting.
(Source: AirROI data, 2026, finding no licensed listings among those analyzed)
Top Performing Airbnb Properties in Heers (2026)
Benchmark your potential! Explore examples of top-performing Airbnb properties in Heersbased on Trailing Twelve Month (TTM) revenue. Analyze their characteristics, revenue, occupancy rate, and ADR to understand what drives success in this market.
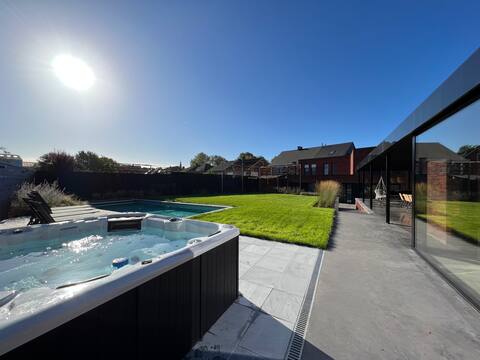
Group home with swimming pool and wellness
Entire Place • 9 bedrooms

Beautiful villa with a pool and a sauna
Entire Place • 4 bedrooms

Villa Daelhoeve with Pool & Sauna & Hottub
Entire Place • 7 bedrooms

Beautiful house at the country side
Entire Place • 7 bedrooms

Lovely house in Heers with 2 bedrooms
Entire Place • 3 bedrooms

Vacation home Wetterdelle lodge with beautiful views
Entire Place • 2 bedrooms
Note: Performance varies based on location, size, amenities, seasonality, and management quality. Data reflects the past 12 months.
Top Performing Airbnb Hosts in Heers (2026)
Learn from the best! This table showcases top-performing Airbnb hosts in Heers based on the number of properties managed and estimated total revenue over the past year. Analyze their scale and performance metrics.
| Host Name | Properties | Grossing Revenue | Stay Reviews | Avg Rating |
|---|---|---|---|---|
| Sybrand | 2 | $576,394 | 23 | 4.70/5.0 |
| Peter (Golden Stay) | 4 | $219,478 | 212 | 4.72/5.0 |
| De Smishoeve | 7 | $113,615 | 92 | 4.69/5.0 |
| Christine | 1 | $73,790 | 10 | 4.50/5.0 |
| John | 2 | $57,731 | 219 | 4.86/5.0 |
| Kirsten | 3 | $42,778 | 18 | 4.93/5.0 |
| Ann | 1 | $34,313 | 60 | 4.98/5.0 |
| Manon | 1 | $20,882 | 22 | 4.82/5.0 |
| Anouk - BELVILLA | 1 | $17,656 | 39 | 4.92/5.0 |
| Kristel En Paul | 1 | $17,395 | 20 | 4.75/5.0 |
Analyzing the strategies of top hosts, such as their property selection, pricing, and guest communication, can offer valuable lessons for optimizing your own Airbnb operations in Heers.
Dive Deeper: Advanced Heers STR Market Data (2026)
Ready to unlock more insights? AirROI provides access to advanced metrics and comprehensive Airbnb data for Heers. Explore detailed analytics beyond this report to refine your investment strategy, optimize pricing, and maximize your vacation rental profits.
Explore Advanced MetricsHeers Short-Term Rental Market Composition (2026): Property & Room Types
Room Type Distribution
Property Type Distribution
Market Composition Insights for Heers
- The Heers Airbnb market composition is heavily skewed towards Entire Home/Apt listings, which make up 90% of the 30 active rentals. This indicates strong guest preference for privacy and space.
- Looking at the property type distribution in Heers, House properties are the most common (63.3%), reflecting the local real estate landscape.
- Houses represent a significant 63.3% portion, catering likely to families or larger groups.
- Smaller segments like hotel/boutique (combined 3.3%) offer potential for unique stay experiences.
Heers Airbnb Room Capacity Analysis (2026): Bedroom Distribution
Distribution of Listings by Number of Bedrooms
Room Capacity Insights for Heers
- The dominant room capacity in Heers is 2 bedrooms listings, making up 36.7% of the market. This suggests a strong demand for properties suitable for couples or solo travelers.
- Together, 2 bedrooms and 5+ bedrooms properties represent 56.7% of the active Airbnb listings in Heers, indicating a high concentration in these sizes.
- A significant 36.6% of listings offer 3+ bedrooms, catering to larger groups and families seeking more space in Heers.
Heers Vacation Rental Guest Capacity Trends (2026)
Distribution of Listings by Guest Capacity
Guest Capacity Insights for Heers
- The most common guest capacity trend in Heers vacation rentals is listings accommodating 8+ guests (40%). This suggests the primary traveler segment is likely larger groups.
- Properties designed for 8+ guests and 2 guests dominate the Heers STR market, accounting for 60.0% of listings.
- 56.6% of properties accommodate 6+ guests, serving the market segment for larger families or group travel in Heers.
- On average, properties in Heers are equipped to host 5.3 guests.
Heers Airbnb Booking Patterns (2026): Available vs. Booked Days
Available Days Distribution
Booked Days Distribution
Booking Pattern Insights for Heers
- The most common availability pattern in Heers falls within the 181-270 days range, representing 56.7% of listings. This suggests many properties have significant open periods on their calendars.
- Approximately 83.4% of listings show high availability (181+ days open annually), indicating potential for increased bookings or specific owner usage patterns.
- For booked days, the 91-180 days range is most frequent in Heers (56.7%), reflecting common guest stay durations or potential owner blocking patterns.
- A notable 16.6% of properties secure long booking periods (181+ days booked per year), highlighting successful long-term rental strategies or significant owner usage.
Heers Airbnb Minimum Stay Requirements Analysis
Distribution of Listings by Minimum Night Requirement
1 Night
6 listings
20% of total
2 Nights
10 listings
33.3% of total
3 Nights
1 listings
3.3% of total
30+ Nights
13 listings
43.3% of total
Key Insights
- The most prevalent minimum stay requirement in Heers is 30+ Nights, adopted by 43.3% of listings. This highlights the market's preference for longer commitments.
- A significant segment (43.3%) caters to monthly stays (30+ nights) in Heers, pointing to opportunities in the extended-stay market.
Recommendations
- Align with the market by considering a 30+ Nights minimum stay, as 43.3% of Heers hosts use this setting.
- If feasible, allowing 1-night stays, especially midweek or during low season, could capture last-minute bookings, as only 20% currently do.
- Explore offering discounts for stays of 30+ nights to attract the 43.3% of the market seeking extended stays.
- Adjust minimum nights based on seasonality – potentially shorter during low season and longer during peak demand periods in Heers.
Heers Airbnb Cancellation Policy Trends Analysis (2026)
Super Strict 30 Days
2 listings
6.7% of total
Super Strict 60 Days
1 listings
3.3% of total
Flexible
5 listings
16.7% of total
Moderate
3 listings
10% of total
Firm
17 listings
56.7% of total
Strict
2 listings
6.7% of total
Cancellation Policy Insights for Heers
- The prevailing Airbnb cancellation policy trend in Heers is Firm, used by 56.7% of listings.
- A majority (63.4%) of hosts in Heers utilize Firm or Strict policies, indicating a market where hosts prioritize booking security.
- Strict cancellation policies are quite rare (6.7%), potentially making listings with this policy less competitive unless justified by high demand or property type.
Recommendations for Hosts
- Consider adopting a Firm policy to align with the 56.7% market standard in Heers.
- Using a Strict policy might deter some guests, as only 6.7% of listings use it. Evaluate if potential revenue protection outweighs possible lower booking rates.
- Regularly review your cancellation policy against competitors and market demand shifts in Heers.
Heers STR Booking Lead Time Analysis (2026)
Average Booking Lead Time by Month
Booking Lead Time Insights for Heers
- The overall average booking lead time for vacation rentals in Heers is 84 days.
- Guests book furthest in advance for stays during September (average 134 days), likely coinciding with peak travel demand or local events.
- The shortest booking windows occur for stays in February (average 54 days), indicating more last-minute travel plans during this time.
- Seasonally, Fall (99 days avg.) sees the longest lead times, while Winter (73 days avg.) has the shortest, reflecting typical travel planning cycles.
Recommendations for Hosts
- Use the overall average lead time (84 days) as a baseline for your pricing and availability strategy in Heers.
- For September stays, consider implementing length-of-stay discounts or slightly higher rates for bookings made less than 134 days out to capitalize on advance planning.
- Target marketing efforts for the Fall season well in advance (at least 99 days) to capture early planners.
- Monitor your own booking lead times against these Heers averages to identify opportunities for dynamic pricing adjustments.
Popular & Essential Airbnb Amenities in Heers (2026)
Amenity Prevalence
Amenity Insights for Heers
- Essential amenities in Heers that guests expect include: Smoke alarm, Wifi, TV, Free parking on premises. Lacking these (any) could significantly impact bookings.
- Popular amenities like Heating, Kitchen, Fire extinguisher are common but not universal. Offering these can provide a competitive edge.
Recommendations for Hosts
- Ensure your listing includes all essential amenities for Heers: Smoke alarm, Wifi, TV, Free parking on premises.
- Prioritize adding missing essentials: Wifi, TV, Free parking on premises.
- Consider adding popular differentiators like Heating or Kitchen to increase appeal.
- Highlight unique or less common amenities you offer (e.g., hot tub, dedicated workspace, EV charger) in your listing description and photos.
- Regularly check competitor amenities in Heers to stay competitive.
Heers Airbnb Guest Demographics & Profile Analysis (2026)
Guest Profile Summary for Heers
- The typical guest profile for Airbnb in Heers consists of a mix of domestic (47%) and international guests, with top international origins including Netherlands, typically belonging to the Post-2000s (Gen Z/Alpha) group (50%), primarily speaking English or Dutch.
- Domestic travelers account for 46.8% of guests.
- Key international markets include Belgium (46.8%) and Netherlands (16.2%).
- Top languages spoken are English (39.6%) followed by Dutch (17.9%).
- A significant demographic segment is the Post-2000s (Gen Z/Alpha) group, representing 50% of guests.
Recommendations for Hosts
- Balance marketing efforts between domestic and international channels based on the guest mix.
- Tailor amenities and listing descriptions to appeal to the dominant Post-2000s (Gen Z/Alpha) demographic (e.g., highlight fast WiFi, smart home features, local guides).
- Highlight unique local experiences or amenities relevant to the primary guest profile.
- Consider seasonal promotions aligned with peak travel times for key origin markets.
Nearby Short-Term Rental Market Comparison
How does the Heers Airbnb market stack up against its neighbors? Compare key performance metrics like average monthly revenue, ADR, and occupancy rates in surrounding areas to understand the broader regional STR landscape.
| Market | Active Properties | Monthly Revenue | Daily Rate | Avg. Occupancy |
|---|---|---|---|---|
| Raamsdonksveer | 16 | $7,756 | $736.17 | 38% |
| Haghorst | 11 | $5,995 | $480.40 | 40% |
| Baarlo | 20 | $5,442 | $332.61 | 51% |
| Merksplas | 12 | $5,367 | $356.64 | 43% |
| Incourt | 13 | $4,412 | $303.48 | 52% |
| Wellin | 12 | $4,365 | $446.64 | 42% |
| Aubel | 26 | $4,191 | $283.88 | 46% |
| Dion | 12 | $4,104 | $270.32 | 50% |
| Bertogne | 26 | $3,839 | $325.90 | 42% |
| Mettet | 21 | $3,771 | $283.66 | 42% |