Dilsen-Stokkem Airbnb Market Analysis 2026: Short Term Rental Data & Vacation Rental Statistics in Limburg, Belgium
Is Airbnb profitable in Dilsen-Stokkem in 2026? Explore comprehensive Airbnb analytics for Dilsen-Stokkem, Limburg, Belgium to uncover income potential. This 2026 STR market report for Dilsen-Stokkem, based on AirROI data from February 2025 to January 2026, reveals key trends in the niche market of 32 active listings.
Whether you're considering an Airbnb investment in Dilsen-Stokkem, optimizing your existing vacation rental, or exploring rental arbitrage opportunities, understanding the Dilsen-Stokkem Airbnb data is crucial. Leveraging the low regulation environment is key to maximizing your short term rental income potential. Let's dive into the specifics.
Key Dilsen-Stokkem Airbnb Performance Metrics Overview
Monthly Airbnb Revenue Variations & Income Potential in Dilsen-Stokkem (2026)
Understanding the monthly revenue variations for Airbnb listings in Dilsen-Stokkem is key to maximizing your short term rental income potential. Seasonality significantly impacts earnings. Our analysis, based on data from the past 12 months, shows that the peak revenue month for STRs in Dilsen-Stokkem is typically May, while January often presents the lowest earnings, highlighting opportunities for strategic pricing adjustments during shoulder and low seasons. Explore the typical Airbnb income in Dilsen-Stokkem across different performance tiers:
- Best-in-class properties (Top 10%) achieve $8,759+ monthly, often utilizing dynamic pricing and superior guest experiences.
- Strong performing properties (Top 25%) earn $3,019 or more, indicating effective management and desirable locations/amenities.
- Typical properties (Median) generate around $1,482 per month, representing the average market performance.
- Entry-level properties (Bottom 25%) see earnings around $948, often with potential for optimization.
Average Monthly Airbnb Earnings Trend in Dilsen-Stokkem
Dilsen-Stokkem Airbnb Occupancy Rate Trends (2026)
Maximize your bookings by understanding the Dilsen-Stokkem STR occupancy trends. Seasonal demand shifts significantly influence how often properties are booked. Typically, Augustsees the highest demand (peak season occupancy), while January experiences the lowest (low season). Effective strategies, like adjusting minimum stays or offering promotions, can boost occupancy during slower periods. Here's how different property tiers perform in Dilsen-Stokkem:
- Best-in-class properties (Top 10%) achieve 74%+ occupancy, indicating high desirability and potentially optimized availability.
- Strong performing properties (Top 25%) maintain 59% or higher occupancy, suggesting good market fit and guest satisfaction.
- Typical properties (Median) have an occupancy rate around 40%.
- Entry-level properties (Bottom 25%) average 24% occupancy, potentially facing higher vacancy.
Average Monthly Occupancy Rate Trend in Dilsen-Stokkem
Average Daily Rate (ADR) Airbnb Trends in Dilsen-Stokkem (2026)
Effective short term rental pricing strategy in Dilsen-Stokkem involves understanding monthly ADR fluctuations. The Average Daily Rate (ADR) for Airbnb in Dilsen-Stokkem typically peaks in September and dips lowest during March. Leveraging Airbnb dynamic pricing tools or strategies based on this seasonality can significantly boost revenue. Here's a look at the typical nightly rates achieved:
- Best-in-class properties (Top 10%) command rates of $763+ per night, often due to premium features or locations.
- Strong performing properties (Top 25%) achieve nightly rates of $213 or more.
- Typical properties (Median) charge around $138 per night.
- Entry-level properties (Bottom 25%) earn around $101 per night.
Average Daily Rate (ADR) Trend by Month in Dilsen-Stokkem
Get Live Dilsen-Stokkem Market Intelligence 👇

Explore Real-time Analytics
Airbnb Seasonality Analysis & Trends in Dilsen-Stokkem (2026)
Peak Season (May, April, June)
- Revenue averages $4,324 per month
- Occupancy rates average 48.2%
- Daily rates average $224
Shoulder Season
- Revenue averages $3,383 per month
- Occupancy maintains around 46.3%
- Daily rates hold near $229
Low Season (January, February, December)
- Revenue drops to average $1,881 per month
- Occupancy decreases to average 27.4%
- Daily rates adjust to average $225
Seasonality Insights for Dilsen-Stokkem
- The Airbnb seasonality in Dilsen-Stokkem shows highly seasonal trends requiring careful strategy. While the sections above show seasonal averages, it's also insightful to look at the extremes:
- During the high season, the absolute peak month showcases Dilsen-Stokkem's highest earning potential, with monthly revenues capable of climbing to $4,579, occupancy reaching a high of 55.8%, and ADRs peaking at $236.
- Conversely, the slowest single month of the year, typically falling within the low season, marks the market's lowest point. In this month, revenue might dip to $1,418, occupancy could drop to 20.9%, and ADRs may adjust down to $216.
- Understanding both the seasonal averages and these monthly peaks and troughs in revenue, occupancy, and ADR is crucial for maximizing your Airbnb profit potential in Dilsen-Stokkem.
Seasonal Strategies for Maximizing Profit
- Peak Season: Maximize revenue through premium pricing and potentially longer minimum stays. Ensure high availability.
- Low Season: Offer competitive pricing, special promotions (e.g., extended stay discounts), and flexible cancellation policies. Target off-season travelers like remote workers or budget-conscious guests.
- Shoulder Seasons: Implement dynamic pricing that balances peak and low rates. Target weekend travelers or specific events. Offer slightly more flexible terms than peak season.
- Regularly analyze your own performance against these Dilsen-Stokkem seasonality benchmarks and adjust your pricing and availability strategy accordingly.
Best Areas for Airbnb Investment in Dilsen-Stokkem (2026)
Exploring the top neighborhoods for short-term rentals in Dilsen-Stokkem? This section highlights key areas, outlining why they are attractive for hosts and guests, along with notable local attractions. Consider these locations based on your target guest profile and investment strategy.
| Neighborhood / Area | Why Host Here? (Target Guests & Appeal) | Key Attractions & Landmarks |
|---|---|---|
| Kasteel Ter Borch | A historic site with beautiful grounds, attracting tourists interested in history and culture. Ideal for those looking to explore Belgian heritage and enjoy a peaceful environment. | Kasteel Ter Borch, Historical gardens, Cultural events, Walking and cycling paths |
| De Molenbeek | A scenic area with nature reserves and walking paths, perfect for nature enthusiasts. Visitors can experience the serene beauty of Dilsen-Stokkem's landscapes. | Nature reserve, Walking trails, Birdwatching, Picnic areas |
| Maasmechelen Village | A shopping outlet that draws visitors looking for designer bargains. Great for those who want a mix of retail therapy and a minimalistic lifestyle. | Designer outlet stores, Restaurants, Cafes, Public events |
| Lanklaar | A small village charm with local attractions and community feel. It appeals to families and those looking for tranquility away from busy tourist spots. | Local parks, Community events, Family-friendly activities |
| Dilsen-Stokkem city center | The heart of the municipality, featuring local shops, restaurants, and cultural spots. Great for easy access to amenities and local flavor. | Shops and cafes, Local markets, Cultural festivals, Historical sites |
| Hasselt | A nearby city known for its gin and vibrant nightlife. Attractive for younger crowds and those interested in experiencing local drinking culture. | Jenever Museum, Hasselt's historic center, Nightlife, Shopping streets |
| Kinrooi | A quaint village that borders the Maas river, popular for water activities and outdoor adventures. Perfect for those seeking a peaceful getaway with plenty of nature. | Kayaking on the Maas, Cycling routes, Fishing spots, Scenic walks |
| Zuid-Limburg | Known for its rolling hills and beautiful landscapes, this area is a favorite for tourists seeking an escape to nature. Ideal for those who enjoy outdoors and rural retreats. | Hiking trails, Cycling paths, Scenic viewpoints, Nature parks |
Understanding Airbnb License Requirements & STR Laws in Dilsen-Stokkem (2026)
While Dilsen-Stokkem, Limburg, Belgium currently shows low STR regulations, specific Airbnb license requirements might still exist or change. Always verify the latest short term rental regulations and Airbnb license requirements directly with local government authorities for Dilsen-Stokkem to ensure full compliance before hosting.
(Source: AirROI data, 2026, finding no licensed listings among those analyzed)
Top Performing Airbnb Properties in Dilsen-Stokkem (2026)
Benchmark your potential! Explore examples of top-performing Airbnb properties in Dilsen-Stokkembased on Trailing Twelve Month (TTM) revenue. Analyze their characteristics, revenue, occupancy rate, and ADR to understand what drives success in this market.

Spending the night in style in a villa from 1910.
Entire Place • 6 bedrooms

Restored square farmhouse
Entire Place • 5 bedrooms

Five-star vacation home "Tussen Hemel en Maas"
Entire Place • 6 bedrooms
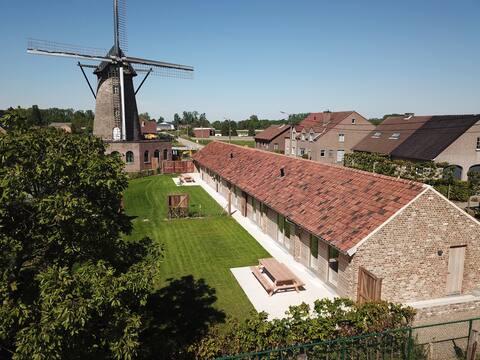
Windmill "De Hoop" - 12 people
Entire Place • 5 bedrooms
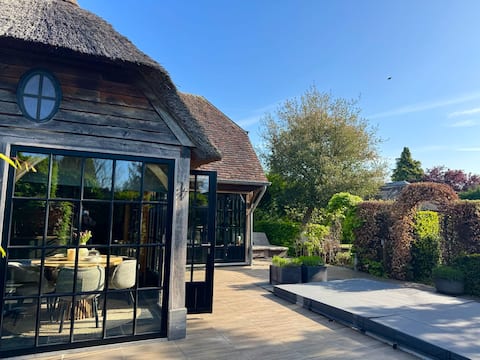
Green Oak Cottage with Private Wellness & Garden
Entire Place • 1 bedroom

Dilsen-Stokkem: surprisingly much to experience...
Entire Place • N/A
Note: Performance varies based on location, size, amenities, seasonality, and management quality. Data reflects the past 12 months.
Top Performing Airbnb Hosts in Dilsen-Stokkem (2026)
Learn from the best! This table showcases top-performing Airbnb hosts in Dilsen-Stokkem based on the number of properties managed and estimated total revenue over the past year. Analyze their scale and performance metrics.
| Host Name | Properties | Grossing Revenue | Stay Reviews | Avg Rating |
|---|---|---|---|---|
| Anne | 1 | $227,236 | 37 | 4.97/5.0 |
| Christel | 8 | $134,313 | 541 | 4.77/5.0 |
| Frank | 3 | $132,711 | 23 | 4.87/5.0 |
| Dirk | 3 | $121,241 | 153 | 4.82/5.0 |
| Leopold | 1 | $100,489 | 45 | 5.00/5.0 |
| Peter | 1 | $34,746 | 114 | 4.72/5.0 |
| Inge | 1 | $30,775 | 9 | 5.00/5.0 |
| Kirsten | 1 | $23,896 | 28 | 4.86/5.0 |
| Oksana | 2 | $19,717 | 607 | 4.58/5.0 |
| Martin | 1 | $17,586 | 109 | 4.80/5.0 |
Analyzing the strategies of top hosts, such as their property selection, pricing, and guest communication, can offer valuable lessons for optimizing your own Airbnb operations in Dilsen-Stokkem.
Dive Deeper: Advanced Dilsen-Stokkem STR Market Data (2026)
Ready to unlock more insights? AirROI provides access to advanced metrics and comprehensive Airbnb data for Dilsen-Stokkem. Explore detailed analytics beyond this report to refine your investment strategy, optimize pricing, and maximize your vacation rental profits.
Explore Advanced MetricsDilsen-Stokkem Short-Term Rental Market Composition (2026): Property & Room Types
Room Type Distribution
Property Type Distribution
Market Composition Insights for Dilsen-Stokkem
- The Dilsen-Stokkem Airbnb market composition is heavily skewed towards Entire Home/Apt listings, which make up 62.5% of the 32 active rentals. This indicates strong guest preference for privacy and space.
- However, a notable 37.5% share for Private Rooms suggests opportunities for budget-conscious travelers or hosts renting out spare rooms.
- Looking at the property type distribution in Dilsen-Stokkem, House properties are the most common (68.8%), reflecting the local real estate landscape.
- Houses represent a significant 68.8% portion, catering likely to families or larger groups.
- The presence of 6.3% Hotel/Boutique listings indicates integration with traditional hospitality.
Dilsen-Stokkem Airbnb Room Capacity Analysis (2026): Bedroom Distribution
Distribution of Listings by Number of Bedrooms
Room Capacity Insights for Dilsen-Stokkem
- The dominant room capacity in Dilsen-Stokkem is 2 bedrooms listings, making up 18.8% of the market. This suggests a strong demand for properties suitable for couples or solo travelers.
- Together, 2 bedrooms and 1 bedroom properties represent 37.6% of the active Airbnb listings in Dilsen-Stokkem, indicating a high concentration in these sizes.
- A significant 25.0% of listings offer 3+ bedrooms, catering to larger groups and families seeking more space in Dilsen-Stokkem.
Dilsen-Stokkem Vacation Rental Guest Capacity Trends (2026)
Distribution of Listings by Guest Capacity
Guest Capacity Insights for Dilsen-Stokkem
- The most common guest capacity trend in Dilsen-Stokkem vacation rentals is listings accommodating 4 guests (18.8%). This suggests the primary traveler segment is likely small families or groups.
- Properties designed for 4 guests and 8+ guests dominate the Dilsen-Stokkem STR market, accounting for 37.6% of listings.
- 28.2% of properties accommodate 6+ guests, serving the market segment for larger families or group travel in Dilsen-Stokkem.
- On average, properties in Dilsen-Stokkem are equipped to host 3.3 guests.
Dilsen-Stokkem Airbnb Booking Patterns (2026): Available vs. Booked Days
Available Days Distribution
Booked Days Distribution
Booking Pattern Insights for Dilsen-Stokkem
- The most common availability pattern in Dilsen-Stokkem falls within the 181-270 days range, representing 46.9% of listings. This suggests many properties have significant open periods on their calendars.
- Approximately 87.5% of listings show high availability (181+ days open annually), indicating potential for increased bookings or specific owner usage patterns.
- For booked days, the 91-180 days range is most frequent in Dilsen-Stokkem (46.9%), reflecting common guest stay durations or potential owner blocking patterns.
- A notable 12.5% of properties secure long booking periods (181+ days booked per year), highlighting successful long-term rental strategies or significant owner usage.
Dilsen-Stokkem Airbnb Minimum Stay Requirements Analysis
Distribution of Listings by Minimum Night Requirement
1 Night
7 listings
21.9% of total
2 Nights
12 listings
37.5% of total
3 Nights
1 listings
3.1% of total
4-6 Nights
3 listings
9.4% of total
30+ Nights
9 listings
28.1% of total
Key Insights
- The most prevalent minimum stay requirement in Dilsen-Stokkem is 2 Nights, adopted by 37.5% of listings. This highlights the market's preference for shorter, flexible bookings.
- A significant segment (28.1%) caters to monthly stays (30+ nights) in Dilsen-Stokkem, pointing to opportunities in the extended-stay market.
Recommendations
- Align with the market by considering a 2 Nights minimum stay, as 37.5% of Dilsen-Stokkem hosts use this setting.
- If feasible, allowing 1-night stays, especially midweek or during low season, could capture last-minute bookings, as only 21.9% currently do.
- Explore offering discounts for stays of 30+ nights to attract the 28.1% of the market seeking extended stays.
- Adjust minimum nights based on seasonality – potentially shorter during low season and longer during peak demand periods in Dilsen-Stokkem.
Dilsen-Stokkem Airbnb Cancellation Policy Trends Analysis (2026)
Super Strict 60 Days
2 listings
6.3% of total
Flexible
1 listings
3.1% of total
Moderate
10 listings
31.3% of total
Firm
6 listings
18.8% of total
Strict
13 listings
40.6% of total
Cancellation Policy Insights for Dilsen-Stokkem
- The prevailing Airbnb cancellation policy trend in Dilsen-Stokkem is Strict, used by 40.6% of listings.
- A majority (59.4%) of hosts in Dilsen-Stokkem utilize Firm or Strict policies, indicating a market where hosts prioritize booking security.
Recommendations for Hosts
- Consider adopting a Strict policy to align with the 40.6% market standard in Dilsen-Stokkem.
- With 40.6% using Strict terms, this is a viable option in Dilsen-Stokkem, particularly for high-value properties or during peak demand periods.
- Regularly review your cancellation policy against competitors and market demand shifts in Dilsen-Stokkem.
Dilsen-Stokkem STR Booking Lead Time Analysis (2026)
Average Booking Lead Time by Month
Booking Lead Time Insights for Dilsen-Stokkem
- The overall average booking lead time for vacation rentals in Dilsen-Stokkem is 78 days.
- Guests book furthest in advance for stays during September (average 95 days), likely coinciding with peak travel demand or local events.
- The shortest booking windows occur for stays in February (average 37 days), indicating more last-minute travel plans during this time.
- Seasonally, Fall (80 days avg.) sees the longest lead times, while Winter (48 days avg.) has the shortest, reflecting typical travel planning cycles.
Recommendations for Hosts
- Use the overall average lead time (78 days) as a baseline for your pricing and availability strategy in Dilsen-Stokkem.
- For September stays, consider implementing length-of-stay discounts or slightly higher rates for bookings made less than 95 days out to capitalize on advance planning.
- Target marketing efforts for the Fall season well in advance (at least 80 days) to capture early planners.
- Monitor your own booking lead times against these Dilsen-Stokkem averages to identify opportunities for dynamic pricing adjustments.
Popular & Essential Airbnb Amenities in Dilsen-Stokkem (2026)
Amenity Prevalence
Amenity Insights for Dilsen-Stokkem
- Essential amenities in Dilsen-Stokkem that guests expect include: Heating, Hot water, Free parking on premises, Dishes and silverware, Wifi. Lacking these (any) could significantly impact bookings.
- Popular amenities like Smoke alarm, Refrigerator, TV are common but not universal. Offering these can provide a competitive edge.
Recommendations for Hosts
- Ensure your listing includes all essential amenities for Dilsen-Stokkem: Heating, Hot water, Free parking on premises, Dishes and silverware, Wifi.
- Prioritize adding missing essentials: Hot water, Free parking on premises, Dishes and silverware, Wifi.
- Consider adding popular differentiators like Smoke alarm or Refrigerator to increase appeal.
- Highlight unique or less common amenities you offer (e.g., hot tub, dedicated workspace, EV charger) in your listing description and photos.
- Regularly check competitor amenities in Dilsen-Stokkem to stay competitive.
Dilsen-Stokkem Airbnb Guest Demographics & Profile Analysis (2026)
Guest Profile Summary for Dilsen-Stokkem
- The typical guest profile for Airbnb in Dilsen-Stokkem consists of a mix of domestic (44%) and international guests, with top international origins including Netherlands, typically belonging to the Post-2000s (Gen Z/Alpha) group (50%), primarily speaking English or Dutch.
- Domestic travelers account for 44.0% of guests.
- Key international markets include Belgium (44%) and Netherlands (24.6%).
- Top languages spoken are English (35.3%) followed by Dutch (22.8%).
- A significant demographic segment is the Post-2000s (Gen Z/Alpha) group, representing 50% of guests.
Recommendations for Hosts
- Balance marketing efforts between domestic and international channels based on the guest mix.
- Tailor amenities and listing descriptions to appeal to the dominant Post-2000s (Gen Z/Alpha) demographic (e.g., highlight fast WiFi, smart home features, local guides).
- Highlight unique local experiences or amenities relevant to the primary guest profile.
- Consider seasonal promotions aligned with peak travel times for key origin markets.
Nearby Short-Term Rental Market Comparison
How does the Dilsen-Stokkem Airbnb market stack up against its neighbors? Compare key performance metrics like average monthly revenue, ADR, and occupancy rates in surrounding areas to understand the broader regional STR landscape.
| Market | Active Properties | Monthly Revenue | Daily Rate | Avg. Occupancy |
|---|---|---|---|---|
| Losser | 10 | $7,954 | $1060.34 | 27% |
| Raamsdonksveer | 16 | $7,756 | $736.17 | 38% |
| Kockengen | 11 | $6,027 | $485.77 | 53% |
| Haghorst | 11 | $5,995 | $480.40 | 40% |
| Baarlo | 20 | $5,442 | $332.61 | 51% |
| Merksplas | 12 | $5,367 | $356.64 | 43% |
| Bentveld | 15 | $4,727 | $517.02 | 50% |
| Incourt | 13 | $4,412 | $303.48 | 52% |
| Wellin | 12 | $4,365 | $446.64 | 42% |
| Aubel | 26 | $4,191 | $283.88 | 46% |