Trois-Ponts Airbnb Market Analysis 2026: Short Term Rental Data & Vacation Rental Statistics in Liège, Belgium
Is Airbnb profitable in Trois-Ponts in 2026? Explore comprehensive Airbnb analytics for Trois-Ponts, Liège, Belgium to uncover income potential. This 2026 STR market report for Trois-Ponts, based on AirROI data from February 2025 to January 2026, reveals key trends in the niche market of 51 active listings.
Whether you're considering an Airbnb investment in Trois-Ponts, optimizing your existing vacation rental, or exploring rental arbitrage opportunities, understanding the Trois-Ponts Airbnb data is crucial. Leveraging the low regulation environment is key to maximizing your short term rental income potential. Let's dive into the specifics.
Key Trois-Ponts Airbnb Performance Metrics Overview
Monthly Airbnb Revenue Variations & Income Potential in Trois-Ponts (2026)
Understanding the monthly revenue variations for Airbnb listings in Trois-Ponts is key to maximizing your short term rental income potential. Seasonality significantly impacts earnings. Our analysis, based on data from the past 12 months, shows that the peak revenue month for STRs in Trois-Ponts is typically August, while January often presents the lowest earnings, highlighting opportunities for strategic pricing adjustments during shoulder and low seasons. Explore the typical Airbnb income in Trois-Ponts across different performance tiers:
- Best-in-class properties (Top 10%) achieve $6,493+ monthly, often utilizing dynamic pricing and superior guest experiences.
- Strong performing properties (Top 25%) earn $3,836 or more, indicating effective management and desirable locations/amenities.
- Typical properties (Median) generate around $2,398 per month, representing the average market performance.
- Entry-level properties (Bottom 25%) see earnings around $1,046, often with potential for optimization.
Average Monthly Airbnb Earnings Trend in Trois-Ponts
Trois-Ponts Airbnb Occupancy Rate Trends (2026)
Maximize your bookings by understanding the Trois-Ponts STR occupancy trends. Seasonal demand shifts significantly influence how often properties are booked. Typically, Augustsees the highest demand (peak season occupancy), while January experiences the lowest (low season). Effective strategies, like adjusting minimum stays or offering promotions, can boost occupancy during slower periods. Here's how different property tiers perform in Trois-Ponts:
- Best-in-class properties (Top 10%) achieve 74%+ occupancy, indicating high desirability and potentially optimized availability.
- Strong performing properties (Top 25%) maintain 57% or higher occupancy, suggesting good market fit and guest satisfaction.
- Typical properties (Median) have an occupancy rate around 40%.
- Entry-level properties (Bottom 25%) average 19% occupancy, potentially facing higher vacancy.
Average Monthly Occupancy Rate Trend in Trois-Ponts
Average Daily Rate (ADR) Airbnb Trends in Trois-Ponts (2026)
Effective short term rental pricing strategy in Trois-Ponts involves understanding monthly ADR fluctuations. The Average Daily Rate (ADR) for Airbnb in Trois-Ponts typically peaks in July and dips lowest during February. Leveraging Airbnb dynamic pricing tools or strategies based on this seasonality can significantly boost revenue. Here's a look at the typical nightly rates achieved:
- Best-in-class properties (Top 10%) command rates of $582+ per night, often due to premium features or locations.
- Strong performing properties (Top 25%) achieve nightly rates of $279 or more.
- Typical properties (Median) charge around $184 per night.
- Entry-level properties (Bottom 25%) earn around $133 per night.
Average Daily Rate (ADR) Trend by Month in Trois-Ponts
Get Live Trois-Ponts Market Intelligence 👇

Explore Real-time Analytics
Airbnb Seasonality Analysis & Trends in Trois-Ponts (2026)
Peak Season (August, July, October)
- Revenue averages $4,969 per month
- Occupancy rates average 52.6%
- Daily rates average $271
Shoulder Season
- Revenue averages $3,319 per month
- Occupancy maintains around 40.7%
- Daily rates hold near $260
Low Season (January, February, March)
- Revenue drops to average $2,049 per month
- Occupancy decreases to average 28.0%
- Daily rates adjust to average $244
Seasonality Insights for Trois-Ponts
- The Airbnb seasonality in Trois-Ponts shows highly seasonal trends requiring careful strategy. While the sections above show seasonal averages, it's also insightful to look at the extremes:
- During the high season, the absolute peak month showcases Trois-Ponts's highest earning potential, with monthly revenues capable of climbing to $5,348, occupancy reaching a high of 57.6%, and ADRs peaking at $276.
- Conversely, the slowest single month of the year, typically falling within the low season, marks the market's lowest point. In this month, revenue might dip to $1,605, occupancy could drop to 18.8%, and ADRs may adjust down to $238.
- Understanding both the seasonal averages and these monthly peaks and troughs in revenue, occupancy, and ADR is crucial for maximizing your Airbnb profit potential in Trois-Ponts.
Seasonal Strategies for Maximizing Profit
- Peak Season: Maximize revenue through premium pricing and potentially longer minimum stays. Ensure high availability.
- Low Season: Offer competitive pricing, special promotions (e.g., extended stay discounts), and flexible cancellation policies. Target off-season travelers like remote workers or budget-conscious guests.
- Shoulder Seasons: Implement dynamic pricing that balances peak and low rates. Target weekend travelers or specific events. Offer slightly more flexible terms than peak season.
- Regularly analyze your own performance against these Trois-Ponts seasonality benchmarks and adjust your pricing and availability strategy accordingly.
Best Areas for Airbnb Investment in Trois-Ponts (2026)
Exploring the top neighborhoods for short-term rentals in Trois-Ponts? This section highlights key areas, outlining why they are attractive for hosts and guests, along with notable local attractions. Consider these locations based on your target guest profile and investment strategy.
| Neighborhood / Area | Why Host Here? (Target Guests & Appeal) | Key Attractions & Landmarks |
|---|---|---|
| Trois-Ponts City Center | The heart of Trois-Ponts, offering easy access to shops, restaurants, and local attractions. Ideal for travelers wanting a central base to explore the region. | La Maite, Les Jardins de la Hanse, Hiking trails, Local cafes and shops, Trois-Ponts railway station |
| Baraque de Fraiture | A nearby ski resort area, popular in winter for skiing and snowboarding, attracting visitors year-round for outdoor activities. | Ski slopes, Hiking trails, Mountain biking, Chalet-style accommodations, Local restaurants offering mountain cuisine |
| Coo | Famous for its waterfalls and amusement park, Coo attracts families and nature lovers. A great destination for those looking to enjoy outdoor activities. | Coo Waterfalls, Plopsa Coo amusement park, Adventurous rafting, Nature walks, Local wildlife |
| Stoumont | A quaint village close to Trois-Ponts, known for its serene environment. Perfect for those seeking a peaceful getaway and walking tours. | Nature walks, Historical buildings, Local farms, Scenic views, Quiet atmosphere |
| Gerardmer | A bit further away, this resort town is known for its beautiful lake and outdoor activities, popular with both visitors and locals. | Lake Gérardmer, Hiking trails, Water sports, Skiing in winter, Local restaurants and cafes |
| Spa | Known for its wellness and spa culture, Spa attracts visitors looking for relaxation and therapeutic experiences. | Thermes de Spa, Cultural heritage, Historic town center, Beautiful parks, Golf courses |
| Malmedy | Rich in culture and history, Malmedy is known for its festivals and historical sites, drawing tourists interested in local culture. | Malmedy Museum, Saint-Pierre Cathedral, Local artisan shops, Festivals, Historical tours |
| La Roche-en-Ardenne | A picturesque town in the Ardennes, popular for its castle and outdoor sports, attracting nature enthusiasts and history buffs alike. | La Roche Castle, River Ourthe activities, Hiking and biking trails, Historical sites, Local market |
Understanding Airbnb License Requirements & STR Laws in Trois-Ponts (2026)
While Trois-Ponts, Liège, Belgium currently shows low STR regulations, specific Airbnb license requirements might still exist or change. Always verify the latest short term rental regulations and Airbnb license requirements directly with local government authorities for Trois-Ponts to ensure full compliance before hosting.
(Source: AirROI data, 2026, finding no licensed listings among those analyzed)
Top Performing Airbnb Properties in Trois-Ponts (2026)
Benchmark your potential! Explore examples of top-performing Airbnb properties in Trois-Pontsbased on Trailing Twelve Month (TTM) revenue. Analyze their characteristics, revenue, occupancy rate, and ADR to understand what drives success in this market.
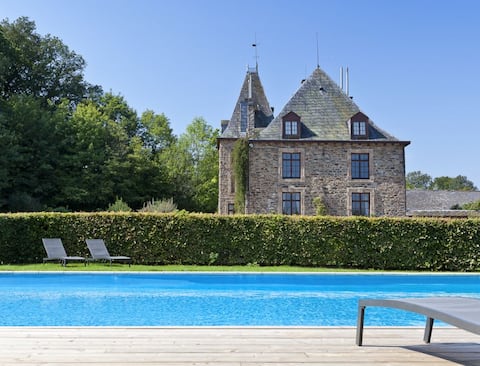
Castel Du Prince-Évêque Bodeux
Entire Place • 8 bedrooms
Le Lamier Jaune - Country cottage for 16 people
Entire Place • 2 bedrooms
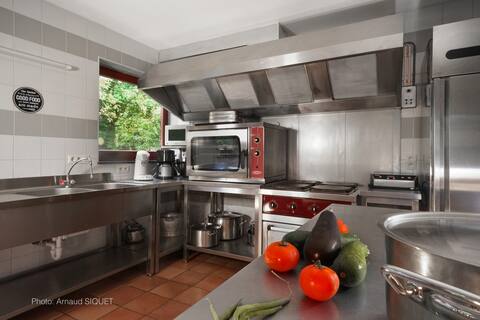
Spacious Farmhouse with Sauna, Pool & Valley-view
Entire Place • 6 bedrooms
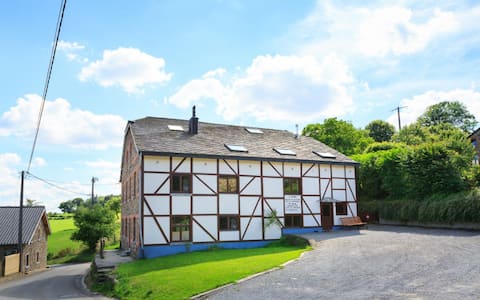
Cozy 12-person vacation home
Entire Place • 5 bedrooms

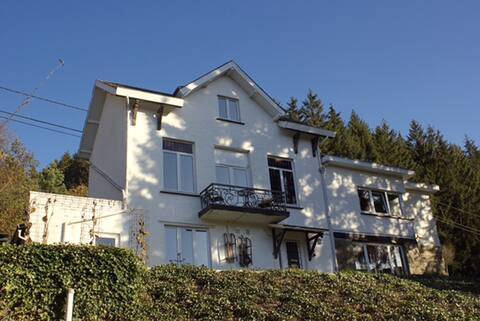
Country villa Terrace-Pool-Jacuzzi-Sauna
Entire Place • 5 bedrooms
Country cottage 4p indoor heated pool
Entire Place • 2 bedrooms
Note: Performance varies based on location, size, amenities, seasonality, and management quality. Data reflects the past 12 months.
Top Performing Airbnb Hosts in Trois-Ponts (2026)
Learn from the best! This table showcases top-performing Airbnb hosts in Trois-Ponts based on the number of properties managed and estimated total revenue over the past year. Analyze their scale and performance metrics.
| Host Name | Properties | Grossing Revenue | Stay Reviews | Avg Rating |
|---|---|---|---|---|
| Benjamin | 1 | $271,041 | 31 | 4.71/5.0 |
| Lara | 5 | $201,323 | 424 | 4.71/5.0 |
| Jean-Marie | 1 | $135,167 | 4 | 4.75/5.0 |
| Béné Et Nick | 4 | $83,137 | 40 | 4.96/5.0 |
| Grégory | 1 | $76,044 | 126 | 4.68/5.0 |
| Paul | 1 | $67,168 | 151 | 4.85/5.0 |
| Kirsten | 1 | $51,110 | 16 | 4.88/5.0 |
| Muriel | 1 | $47,801 | 63 | 4.92/5.0 |
| Jean-Cyrille | 1 | $45,707 | 46 | 4.89/5.0 |
| Yannick | 1 | $41,132 | 103 | 4.82/5.0 |
Analyzing the strategies of top hosts, such as their property selection, pricing, and guest communication, can offer valuable lessons for optimizing your own Airbnb operations in Trois-Ponts.
Dive Deeper: Advanced Trois-Ponts STR Market Data (2026)
Ready to unlock more insights? AirROI provides access to advanced metrics and comprehensive Airbnb data for Trois-Ponts. Explore detailed analytics beyond this report to refine your investment strategy, optimize pricing, and maximize your vacation rental profits.
Explore Advanced MetricsTrois-Ponts Short-Term Rental Market Composition (2026): Property & Room Types
Room Type Distribution
Property Type Distribution
Market Composition Insights for Trois-Ponts
- The Trois-Ponts Airbnb market composition is heavily skewed towards Entire Home/Apt listings, which make up 94.1% of the 51 active rentals. This indicates strong guest preference for privacy and space.
- Looking at the property type distribution in Trois-Ponts, House properties are the most common (64.7%), reflecting the local real estate landscape.
- Houses represent a significant 64.7% portion, catering likely to families or larger groups.
Trois-Ponts Airbnb Room Capacity Analysis (2026): Bedroom Distribution
Distribution of Listings by Number of Bedrooms
Room Capacity Insights for Trois-Ponts
- The dominant room capacity in Trois-Ponts is 1 bedroom listings, making up 27.5% of the market. This suggests a strong demand for properties suitable for couples or solo travelers.
- Together, 1 bedroom and 2 bedrooms properties represent 53.0% of the active Airbnb listings in Trois-Ponts, indicating a high concentration in these sizes.
- A significant 43.1% of listings offer 3+ bedrooms, catering to larger groups and families seeking more space in Trois-Ponts.
Trois-Ponts Vacation Rental Guest Capacity Trends (2026)
Distribution of Listings by Guest Capacity
Guest Capacity Insights for Trois-Ponts
- The most common guest capacity trend in Trois-Ponts vacation rentals is listings accommodating 8+ guests (31.4%). This suggests the primary traveler segment is likely larger groups.
- Properties designed for 8+ guests and 4 guests dominate the Trois-Ponts STR market, accounting for 51.0% of listings.
- 47.1% of properties accommodate 6+ guests, serving the market segment for larger families or group travel in Trois-Ponts.
- On average, properties in Trois-Ponts are equipped to host 5.1 guests.
Trois-Ponts Airbnb Booking Patterns (2026): Available vs. Booked Days
Available Days Distribution
Booked Days Distribution
Booking Pattern Insights for Trois-Ponts
- The most common availability pattern in Trois-Ponts falls within the 271-366 days range, representing 52.9% of listings. This suggests many properties have significant open periods on their calendars.
- Approximately 76.4% of listings show high availability (181+ days open annually), indicating potential for increased bookings or specific owner usage patterns.
- For booked days, the 181-270 days range is most frequent in Trois-Ponts (25.5%), reflecting common guest stay durations or potential owner blocking patterns.
- A notable 27.5% of properties secure long booking periods (181+ days booked per year), highlighting successful long-term rental strategies or significant owner usage.
Trois-Ponts Airbnb Minimum Stay Requirements Analysis
Distribution of Listings by Minimum Night Requirement
1 Night
13 listings
25.5% of total
2 Nights
21 listings
41.2% of total
3 Nights
2 listings
3.9% of total
30+ Nights
15 listings
29.4% of total
Key Insights
- The most prevalent minimum stay requirement in Trois-Ponts is 2 Nights, adopted by 41.2% of listings. This highlights the market's preference for shorter, flexible bookings.
- A strong majority (66.7%) of the Trois-Ponts Airbnb data shows acceptance of very short stays (1-2 nights), indicating a dynamic, high-turnover market.
- A significant segment (29.4%) caters to monthly stays (30+ nights) in Trois-Ponts, pointing to opportunities in the extended-stay market.
Recommendations
- Align with the market by considering a 2 Nights minimum stay, as 41.2% of Trois-Ponts hosts use this setting.
- If feasible, allowing 1-night stays, especially midweek or during low season, could capture last-minute bookings, as only 25.5% currently do.
- Explore offering discounts for stays of 30+ nights to attract the 29.4% of the market seeking extended stays.
- Adjust minimum nights based on seasonality – potentially shorter during low season and longer during peak demand periods in Trois-Ponts.
Trois-Ponts Airbnb Cancellation Policy Trends Analysis (2026)
Super Strict 30 Days
3 listings
5.9% of total
Super Strict 60 Days
1 listings
2% of total
Flexible
10 listings
19.6% of total
Moderate
13 listings
25.5% of total
Firm
13 listings
25.5% of total
Strict
11 listings
21.6% of total
Cancellation Policy Insights for Trois-Ponts
- The prevailing Airbnb cancellation policy trend in Trois-Ponts is Moderate, used by 25.5% of listings.
- There's a relatively balanced mix between guest-friendly (45.1%) and stricter (47.1%) policies, offering choices for different guest needs.
Recommendations for Hosts
- Consider adopting a Moderate policy to align with the 25.5% market standard in Trois-Ponts.
- Regularly review your cancellation policy against competitors and market demand shifts in Trois-Ponts.
Trois-Ponts STR Booking Lead Time Analysis (2026)
Average Booking Lead Time by Month
Booking Lead Time Insights for Trois-Ponts
- The overall average booking lead time for vacation rentals in Trois-Ponts is 75 days.
- Guests book furthest in advance for stays during July (average 120 days), likely coinciding with peak travel demand or local events.
- The shortest booking windows occur for stays in February (average 51 days), indicating more last-minute travel plans during this time.
- Seasonally, Summer (95 days avg.) sees the longest lead times, while Winter (62 days avg.) has the shortest, reflecting typical travel planning cycles.
Recommendations for Hosts
- Use the overall average lead time (75 days) as a baseline for your pricing and availability strategy in Trois-Ponts.
- For July stays, consider implementing length-of-stay discounts or slightly higher rates for bookings made less than 120 days out to capitalize on advance planning.
- Target marketing efforts for the Summer season well in advance (at least 95 days) to capture early planners.
- Monitor your own booking lead times against these Trois-Ponts averages to identify opportunities for dynamic pricing adjustments.
Popular & Essential Airbnb Amenities in Trois-Ponts (2026)
Amenity Prevalence
Amenity Insights for Trois-Ponts
- Popular amenities like Kitchen, Free parking on premises, TV are common but not universal. Offering these can provide a competitive edge.
- Warning: Wifi is not universally provided but is considered essential globally. Ensure reliable Wifi is offered.
Recommendations for Hosts
- Consider adding popular differentiators like Kitchen or Free parking on premises to increase appeal.
- Highlight unique or less common amenities you offer (e.g., hot tub, dedicated workspace, EV charger) in your listing description and photos.
- Regularly check competitor amenities in Trois-Ponts to stay competitive.
Trois-Ponts Airbnb Guest Demographics & Profile Analysis (2026)
Guest Profile Summary for Trois-Ponts
- The typical guest profile for Airbnb in Trois-Ponts consists of a mix of domestic (37%) and international guests, with top international origins including Netherlands, typically belonging to the Post-2000s (Gen Z/Alpha) group (50%), primarily speaking English or French.
- Domestic travelers account for 37.2% of guests.
- Key international markets include Belgium (37.2%) and Netherlands (27.4%).
- Top languages spoken are English (36.9%) followed by French (21.6%).
- A significant demographic segment is the Post-2000s (Gen Z/Alpha) group, representing 50% of guests.
Recommendations for Hosts
- Focus marketing internationally, particularly towards travelers from Netherlands.
- Tailor amenities and listing descriptions to appeal to the dominant Post-2000s (Gen Z/Alpha) demographic (e.g., highlight fast WiFi, smart home features, local guides).
- Highlight unique local experiences or amenities relevant to the primary guest profile.
- Consider seasonal promotions aligned with peak travel times for key origin markets.
Nearby Short-Term Rental Market Comparison
How does the Trois-Ponts Airbnb market stack up against its neighbors? Compare key performance metrics like average monthly revenue, ADR, and occupancy rates in surrounding areas to understand the broader regional STR landscape.
| Market | Active Properties | Monthly Revenue | Daily Rate | Avg. Occupancy |
|---|---|---|---|---|
| Raamsdonksveer | 16 | $7,756 | $736.17 | 38% |
| Haghorst | 11 | $5,995 | $480.40 | 40% |
| Baarlo | 20 | $5,442 | $332.61 | 51% |
| Merksplas | 12 | $5,367 | $356.64 | 43% |
| Incourt | 13 | $4,412 | $303.48 | 52% |
| Wellin | 12 | $4,365 | $446.64 | 42% |
| Aubel | 26 | $4,191 | $283.88 | 46% |
| Dion | 12 | $4,104 | $270.32 | 50% |
| Bertogne | 26 | $3,839 | $325.90 | 42% |
| Mettet | 21 | $3,771 | $283.66 | 42% |