Theux Airbnb Market Analysis 2026: Short Term Rental Data & Vacation Rental Statistics in Liège, Belgium
Is Airbnb profitable in Theux in 2026? Explore comprehensive Airbnb analytics for Theux, Liège, Belgium to uncover income potential. This 2026 STR market report for Theux, based on AirROI data from February 2025 to January 2026, reveals key trends in the niche market of 84 active listings.
Whether you're considering an Airbnb investment in Theux, optimizing your existing vacation rental, or exploring rental arbitrage opportunities, understanding the Theux Airbnb data is crucial. Leveraging the low regulation environment is key to maximizing your short term rental income potential. Let's dive into the specifics.
Key Theux Airbnb Performance Metrics Overview
Monthly Airbnb Revenue Variations & Income Potential in Theux (2026)
Understanding the monthly revenue variations for Airbnb listings in Theux is key to maximizing your short term rental income potential. Seasonality significantly impacts earnings. Our analysis, based on data from the past 12 months, shows that the peak revenue month for STRs in Theux is typically July, while January often presents the lowest earnings, highlighting opportunities for strategic pricing adjustments during shoulder and low seasons. Explore the typical Airbnb income in Theux across different performance tiers:
- Best-in-class properties (Top 10%) achieve $5,506+ monthly, often utilizing dynamic pricing and superior guest experiences.
- Strong performing properties (Top 25%) earn $3,459 or more, indicating effective management and desirable locations/amenities.
- Typical properties (Median) generate around $2,109 per month, representing the average market performance.
- Entry-level properties (Bottom 25%) see earnings around $1,090, often with potential for optimization.
Average Monthly Airbnb Earnings Trend in Theux
Theux Airbnb Occupancy Rate Trends (2026)
Maximize your bookings by understanding the Theux STR occupancy trends. Seasonal demand shifts significantly influence how often properties are booked. Typically, Augustsees the highest demand (peak season occupancy), while January experiences the lowest (low season). Effective strategies, like adjusting minimum stays or offering promotions, can boost occupancy during slower periods. Here's how different property tiers perform in Theux:
- Best-in-class properties (Top 10%) achieve 79%+ occupancy, indicating high desirability and potentially optimized availability.
- Strong performing properties (Top 25%) maintain 64% or higher occupancy, suggesting good market fit and guest satisfaction.
- Typical properties (Median) have an occupancy rate around 42%.
- Entry-level properties (Bottom 25%) average 21% occupancy, potentially facing higher vacancy.
Average Monthly Occupancy Rate Trend in Theux
Average Daily Rate (ADR) Airbnb Trends in Theux (2026)
Effective short term rental pricing strategy in Theux involves understanding monthly ADR fluctuations. The Average Daily Rate (ADR) for Airbnb in Theux typically peaks in July and dips lowest during November. Leveraging Airbnb dynamic pricing tools or strategies based on this seasonality can significantly boost revenue. Here's a look at the typical nightly rates achieved:
- Best-in-class properties (Top 10%) command rates of $604+ per night, often due to premium features or locations.
- Strong performing properties (Top 25%) achieve nightly rates of $310 or more.
- Typical properties (Median) charge around $176 per night.
- Entry-level properties (Bottom 25%) earn around $119 per night.
Average Daily Rate (ADR) Trend by Month in Theux
Get Live Theux Market Intelligence 👇

Explore Real-time Analytics
Airbnb Seasonality Analysis & Trends in Theux (2026)
Peak Season (July, August, October)
- Revenue averages $3,668 per month
- Occupancy rates average 54.6%
- Daily rates average $274
Shoulder Season
- Revenue averages $2,724 per month
- Occupancy maintains around 43.3%
- Daily rates hold near $259
Low Season (January, February, March)
- Revenue drops to average $1,863 per month
- Occupancy decreases to average 33.3%
- Daily rates adjust to average $254
Seasonality Insights for Theux
- The Airbnb seasonality in Theux shows highly seasonal trends requiring careful strategy. While the sections above show seasonal averages, it's also insightful to look at the extremes:
- During the high season, the absolute peak month showcases Theux's highest earning potential, with monthly revenues capable of climbing to $4,228, occupancy reaching a high of 56.9%, and ADRs peaking at $292.
- Conversely, the slowest single month of the year, typically falling within the low season, marks the market's lowest point. In this month, revenue might dip to $1,711, occupancy could drop to 25.2%, and ADRs may adjust down to $251.
- Understanding both the seasonal averages and these monthly peaks and troughs in revenue, occupancy, and ADR is crucial for maximizing your Airbnb profit potential in Theux.
Seasonal Strategies for Maximizing Profit
- Peak Season: Maximize revenue through premium pricing and potentially longer minimum stays. Ensure high availability.
- Low Season: Offer competitive pricing, special promotions (e.g., extended stay discounts), and flexible cancellation policies. Target off-season travelers like remote workers or budget-conscious guests.
- Shoulder Seasons: Implement dynamic pricing that balances peak and low rates. Target weekend travelers or specific events. Offer slightly more flexible terms than peak season.
- Regularly analyze your own performance against these Theux seasonality benchmarks and adjust your pricing and availability strategy accordingly.
Best Areas for Airbnb Investment in Theux (2026)
Exploring the top neighborhoods for short-term rentals in Theux? This section highlights key areas, outlining why they are attractive for hosts and guests, along with notable local attractions. Consider these locations based on your target guest profile and investment strategy.
| Neighborhood / Area | Why Host Here? (Target Guests & Appeal) | Key Attractions & Landmarks |
|---|---|---|
| Theux Centre | The heart of Theux, offering a charming village atmosphere with local shops and restaurants. Ideal for tourists looking to experience authentic Belgian culture and hospitality. | Theux Town Hall, La Sagette Brewery, Theux Market Square, Cultural events, Local eateries |
| Spa | A nearby popular tourist destination known for its wellness spas and thermal baths. Highly sought after by travelers looking for relaxation and health retreats. | Thermes de Spa, Spa-Francorchamps, The Royal Golf Club, Spa Town Centre, Casino de Spa |
| Stoumont | A scenic area ideal for nature lovers, featuring beautiful landscapes and outdoor activities. Attracts guests interested in hiking, biking, and adventurous experiences. | Amblève River, Hiking trails, Cave of Lorette, Parc naturel des Hautes Fagnes, Stoumont Village |
| Aywaille | A picturesque town known for its river landscapes and charming atmosphere, Aywaille attracts families and nature enthusiasts. Offers various outdoor activities and local festivals. | La Hoëgne River, Les Jardins d'Annevoie, Local markets, Outdoor sports, Festivals |
| Gouvy | A charming village on the border of Luxembourg known for its peaceful surroundings and rustic charm. Ideal for those looking for a tranquil escape. | Grandmenil, Local hiking trails, Gouvy Town Centre, Traditional local cuisine, Cultural heritage sites |
| Remouchamps | Famous for its natural beauty and outdoor activities, including the nearby caves and hiking routes, it's perfect for adventure seekers and nature lovers. | Caves of Remouchamps, Ourthe River, Hiking paths, Adventure parks, Local folklore events |
| Nonceveux | A quaint village that provides a serene atmosphere while still being accessible to larger towns. Good for guests seeking a quiet stay with local charm. | Local vineyards, Scenic walking trails, Historic churches, Cultural traditions, Peaceful countryside |
| Chaudfontaine | A lovely area known for its thermal waters and wellness centers, attracting visitors looking for relaxation and leisure activities. | Thermal spas, Château de la Hulpe, Local parks, Nature reserves, Wellness retreats |
Understanding Airbnb License Requirements & STR Laws in Theux (2026)
While Theux, Liège, Belgium currently shows low STR regulations, specific Airbnb license requirements might still exist or change. Always verify the latest short term rental regulations and Airbnb license requirements directly with local government authorities for Theux to ensure full compliance before hosting.
(Source: AirROI data, 2026, finding no licensed listings among those analyzed)
Top Performing Airbnb Properties in Theux (2026)
Benchmark your potential! Explore examples of top-performing Airbnb properties in Theuxbased on Trailing Twelve Month (TTM) revenue. Analyze their characteristics, revenue, occupancy rate, and ADR to understand what drives success in this market.
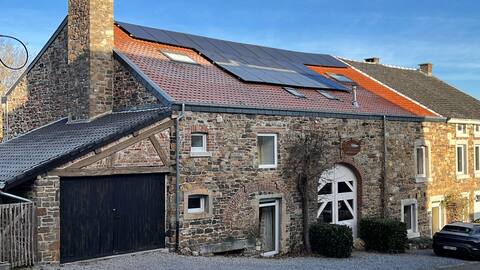
Chemin de Traverse Gite
Entire Place • 8 bedrooms

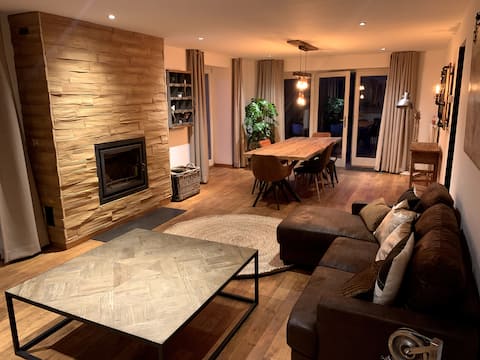
Casa Graziella, luxurious villa surrounded by nature
Entire Place • 4 bedrooms
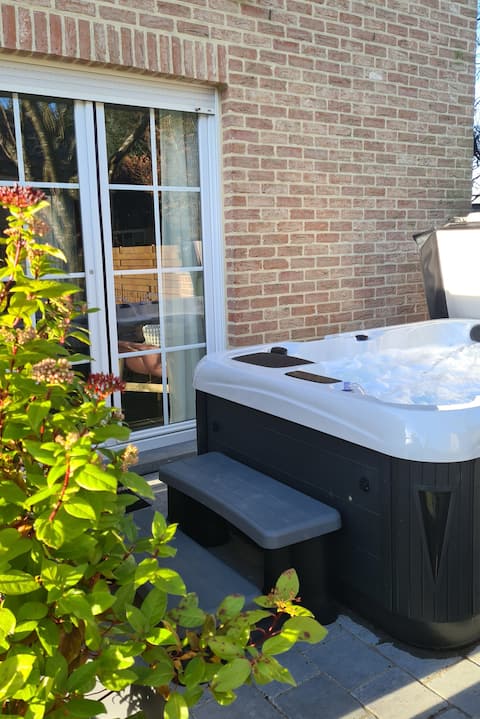
3-bedroom house with outdoor hot tub
Entire Place • 3 bedrooms
The Nest of Charms
Entire Place • 1 bedroom

Gîte du Jardin
Entire Place • 6 bedrooms

3 bedrooms with pool
Entire Place • 3 bedrooms
Note: Performance varies based on location, size, amenities, seasonality, and management quality. Data reflects the past 12 months.
Top Performing Airbnb Hosts in Theux (2026)
Learn from the best! This table showcases top-performing Airbnb hosts in Theux based on the number of properties managed and estimated total revenue over the past year. Analyze their scale and performance metrics.
| Host Name | Properties | Grossing Revenue | Stay Reviews | Avg Rating |
|---|---|---|---|---|
| Laurent Luc A | 10 | $308,822 | 1369 | 4.66/5.0 |
| Antoine | 1 | $145,297 | 13 | 4.54/5.0 |
| Vincent | 2 | $125,322 | 24 | 4.83/5.0 |
| Christian | 1 | $120,590 | 40 | 4.98/5.0 |
| Nirana | 1 | $76,426 | 213 | 4.93/5.0 |
| Fabienne Et André | 2 | $73,291 | 26 | 4.88/5.0 |
| Valerie | 1 | $68,151 | 73 | 4.90/5.0 |
| Audrey | 1 | $60,738 | 2 | Not Rated |
| Mireille | 1 | $58,540 | 104 | 4.81/5.0 |
| Jean-Yves | 1 | $56,844 | 47 | 5.00/5.0 |
Analyzing the strategies of top hosts, such as their property selection, pricing, and guest communication, can offer valuable lessons for optimizing your own Airbnb operations in Theux.
Dive Deeper: Advanced Theux STR Market Data (2026)
Ready to unlock more insights? AirROI provides access to advanced metrics and comprehensive Airbnb data for Theux. Explore detailed analytics beyond this report to refine your investment strategy, optimize pricing, and maximize your vacation rental profits.
Explore Advanced MetricsTheux Short-Term Rental Market Composition (2026): Property & Room Types
Room Type Distribution
Property Type Distribution
Market Composition Insights for Theux
- The Theux Airbnb market composition is heavily skewed towards Entire Home/Apt listings, which make up 81% of the 84 active rentals. This indicates strong guest preference for privacy and space.
- Looking at the property type distribution in Theux, House properties are the most common (53.6%), reflecting the local real estate landscape.
- Houses represent a significant 53.6% portion, catering likely to families or larger groups.
- The presence of 13.1% Hotel/Boutique listings indicates integration with traditional hospitality.
- Smaller segments like others (combined 3.6%) offer potential for unique stay experiences.
Theux Airbnb Room Capacity Analysis (2026): Bedroom Distribution
Distribution of Listings by Number of Bedrooms
Room Capacity Insights for Theux
- The dominant room capacity in Theux is 1 bedroom listings, making up 27.4% of the market. This suggests a strong demand for properties suitable for couples or solo travelers.
- Together, 1 bedroom and 3 bedrooms properties represent 51.2% of the active Airbnb listings in Theux, indicating a high concentration in these sizes.
- A significant 42.8% of listings offer 3+ bedrooms, catering to larger groups and families seeking more space in Theux.
Theux Vacation Rental Guest Capacity Trends (2026)
Distribution of Listings by Guest Capacity
Guest Capacity Insights for Theux
- The most common guest capacity trend in Theux vacation rentals is listings accommodating 8+ guests (23.8%). This suggests the primary traveler segment is likely larger groups.
- Properties designed for 8+ guests and 2 guests dominate the Theux STR market, accounting for 46.4% of listings.
- 36.9% of properties accommodate 6+ guests, serving the market segment for larger families or group travel in Theux.
- On average, properties in Theux are equipped to host 4.1 guests.
Theux Airbnb Booking Patterns (2026): Available vs. Booked Days
Available Days Distribution
Booked Days Distribution
Booking Pattern Insights for Theux
- The most common availability pattern in Theux falls within the 271-366 days range, representing 46.4% of listings. This suggests many properties have significant open periods on their calendars.
- Approximately 66.6% of listings show high availability (181+ days open annually), indicating potential for increased bookings or specific owner usage patterns.
- For booked days, the 181-270 days range is most frequent in Theux (31%), reflecting common guest stay durations or potential owner blocking patterns.
- A notable 34.6% of properties secure long booking periods (181+ days booked per year), highlighting successful long-term rental strategies or significant owner usage.
Theux Airbnb Minimum Stay Requirements Analysis
Distribution of Listings by Minimum Night Requirement
1 Night
21 listings
25% of total
2 Nights
40 listings
47.6% of total
3 Nights
1 listings
1.2% of total
30+ Nights
22 listings
26.2% of total
Key Insights
- The most prevalent minimum stay requirement in Theux is 2 Nights, adopted by 47.6% of listings. This highlights the market's preference for shorter, flexible bookings.
- A strong majority (72.6%) of the Theux Airbnb data shows acceptance of very short stays (1-2 nights), indicating a dynamic, high-turnover market.
- A significant segment (26.2%) caters to monthly stays (30+ nights) in Theux, pointing to opportunities in the extended-stay market.
Recommendations
- Align with the market by considering a 2 Nights minimum stay, as 47.6% of Theux hosts use this setting.
- If feasible, allowing 1-night stays, especially midweek or during low season, could capture last-minute bookings, as only 25% currently do.
- Explore offering discounts for stays of 30+ nights to attract the 26.2% of the market seeking extended stays.
- Adjust minimum nights based on seasonality – potentially shorter during low season and longer during peak demand periods in Theux.
Theux Airbnb Cancellation Policy Trends Analysis (2026)
Super Strict 60 Days
10 listings
11.9% of total
Limited
1 listings
1.2% of total
Super Strict 30 Days
2 listings
2.4% of total
Flexible
16 listings
19% of total
Moderate
14 listings
16.7% of total
Firm
33 listings
39.3% of total
Strict
8 listings
9.5% of total
Cancellation Policy Insights for Theux
- The prevailing Airbnb cancellation policy trend in Theux is Firm, used by 39.3% of listings.
- There's a relatively balanced mix between guest-friendly (35.7%) and stricter (48.8%) policies, offering choices for different guest needs.
- Strict cancellation policies are quite rare (9.5%), potentially making listings with this policy less competitive unless justified by high demand or property type.
Recommendations for Hosts
- Consider adopting a Firm policy to align with the 39.3% market standard in Theux.
- Using a Strict policy might deter some guests, as only 9.5% of listings use it. Evaluate if potential revenue protection outweighs possible lower booking rates.
- Regularly review your cancellation policy against competitors and market demand shifts in Theux.
Theux STR Booking Lead Time Analysis (2026)
Average Booking Lead Time by Month
Booking Lead Time Insights for Theux
- The overall average booking lead time for vacation rentals in Theux is 63 days.
- Guests book furthest in advance for stays during July (average 99 days), likely coinciding with peak travel demand or local events.
- The shortest booking windows occur for stays in February (average 29 days), indicating more last-minute travel plans during this time.
- Seasonally, Summer (85 days avg.) sees the longest lead times, while Winter (43 days avg.) has the shortest, reflecting typical travel planning cycles.
Recommendations for Hosts
- Use the overall average lead time (63 days) as a baseline for your pricing and availability strategy in Theux.
- For July stays, consider implementing length-of-stay discounts or slightly higher rates for bookings made less than 99 days out to capitalize on advance planning.
- Target marketing efforts for the Summer season well in advance (at least 85 days) to capture early planners.
- Monitor your own booking lead times against these Theux averages to identify opportunities for dynamic pricing adjustments.
Popular & Essential Airbnb Amenities in Theux (2026)
Amenity Prevalence
Amenity Insights for Theux
- Essential amenities in Theux that guests expect include: Wifi. Lacking these (this) could significantly impact bookings.
- Popular amenities like Heating, Free parking on premises, Kitchen are common but not universal. Offering these can provide a competitive edge.
Recommendations for Hosts
- Ensure your listing includes all essential amenities for Theux: Wifi.
- Prioritize adding missing essentials: Wifi.
- Consider adding popular differentiators like Heating or Free parking on premises to increase appeal.
- Highlight unique or less common amenities you offer (e.g., hot tub, dedicated workspace, EV charger) in your listing description and photos.
- Regularly check competitor amenities in Theux to stay competitive.
Theux Airbnb Guest Demographics & Profile Analysis (2026)
Guest Profile Summary for Theux
- The typical guest profile for Airbnb in Theux consists of predominantly international visitors (67%), with top international origins including Netherlands, typically belonging to the Post-2000s (Gen Z/Alpha) group (50%), primarily speaking English or French.
- Domestic travelers account for 32.8% of guests.
- Key international markets include Belgium (32.8%) and Netherlands (26.1%).
- Top languages spoken are English (36.8%) followed by French (18.8%).
- A significant demographic segment is the Post-2000s (Gen Z/Alpha) group, representing 50% of guests.
Recommendations for Hosts
- Focus marketing internationally, particularly towards travelers from Netherlands.
- Tailor amenities and listing descriptions to appeal to the dominant Post-2000s (Gen Z/Alpha) demographic (e.g., highlight fast WiFi, smart home features, local guides).
- Highlight unique local experiences or amenities relevant to the primary guest profile.
- Consider seasonal promotions aligned with peak travel times for key origin markets.
Nearby Short-Term Rental Market Comparison
How does the Theux Airbnb market stack up against its neighbors? Compare key performance metrics like average monthly revenue, ADR, and occupancy rates in surrounding areas to understand the broader regional STR landscape.
| Market | Active Properties | Monthly Revenue | Daily Rate | Avg. Occupancy |
|---|---|---|---|---|
| Raamsdonksveer | 16 | $7,756 | $736.17 | 38% |
| Haghorst | 11 | $5,995 | $480.40 | 40% |
| Baarlo | 20 | $5,442 | $332.61 | 51% |
| Merksplas | 12 | $5,367 | $356.64 | 43% |
| Incourt | 13 | $4,412 | $303.48 | 52% |
| Wellin | 12 | $4,365 | $446.64 | 42% |
| Aubel | 26 | $4,191 | $283.88 | 46% |
| Dion | 12 | $4,104 | $270.32 | 50% |
| Bertogne | 26 | $3,839 | $325.90 | 42% |
| Mettet | 21 | $3,771 | $283.66 | 42% |