Sprimont Airbnb Market Analysis 2026: Short Term Rental Data & Vacation Rental Statistics in Liège, Belgium
Is Airbnb profitable in Sprimont in 2026? Explore comprehensive Airbnb analytics for Sprimont, Liège, Belgium to uncover income potential. This 2026 STR market report for Sprimont, based on AirROI data from February 2025 to January 2026, reveals key trends in the niche market of 37 active listings.
Whether you're considering an Airbnb investment in Sprimont, optimizing your existing vacation rental, or exploring rental arbitrage opportunities, understanding the Sprimont Airbnb data is crucial. Leveraging the low regulation environment is key to maximizing your short term rental income potential. Let's dive into the specifics.
Key Sprimont Airbnb Performance Metrics Overview
Monthly Airbnb Revenue Variations & Income Potential in Sprimont (2026)
Understanding the monthly revenue variations for Airbnb listings in Sprimont is key to maximizing your short term rental income potential. Seasonality significantly impacts earnings. Our analysis, based on data from the past 12 months, shows that the peak revenue month for STRs in Sprimont is typically July, while January often presents the lowest earnings, highlighting opportunities for strategic pricing adjustments during shoulder and low seasons. Explore the typical Airbnb income in Sprimont across different performance tiers:
- Best-in-class properties (Top 10%) achieve $6,695+ monthly, often utilizing dynamic pricing and superior guest experiences.
- Strong performing properties (Top 25%) earn $2,733 or more, indicating effective management and desirable locations/amenities.
- Typical properties (Median) generate around $1,728 per month, representing the average market performance.
- Entry-level properties (Bottom 25%) see earnings around $1,081, often with potential for optimization.
Average Monthly Airbnb Earnings Trend in Sprimont
Sprimont Airbnb Occupancy Rate Trends (2026)
Maximize your bookings by understanding the Sprimont STR occupancy trends. Seasonal demand shifts significantly influence how often properties are booked. Typically, Julysees the highest demand (peak season occupancy), while January experiences the lowest (low season). Effective strategies, like adjusting minimum stays or offering promotions, can boost occupancy during slower periods. Here's how different property tiers perform in Sprimont:
- Best-in-class properties (Top 10%) achieve 73%+ occupancy, indicating high desirability and potentially optimized availability.
- Strong performing properties (Top 25%) maintain 61% or higher occupancy, suggesting good market fit and guest satisfaction.
- Typical properties (Median) have an occupancy rate around 42%.
- Entry-level properties (Bottom 25%) average 24% occupancy, potentially facing higher vacancy.
Average Monthly Occupancy Rate Trend in Sprimont
Average Daily Rate (ADR) Airbnb Trends in Sprimont (2026)
Effective short term rental pricing strategy in Sprimont involves understanding monthly ADR fluctuations. The Average Daily Rate (ADR) for Airbnb in Sprimont typically peaks in December and dips lowest during March. Leveraging Airbnb dynamic pricing tools or strategies based on this seasonality can significantly boost revenue. Here's a look at the typical nightly rates achieved:
- Best-in-class properties (Top 10%) command rates of $460+ per night, often due to premium features or locations.
- Strong performing properties (Top 25%) achieve nightly rates of $268 or more.
- Typical properties (Median) charge around $146 per night.
- Entry-level properties (Bottom 25%) earn around $102 per night.
Average Daily Rate (ADR) Trend by Month in Sprimont
Get Live Sprimont Market Intelligence 👇

Explore Real-time Analytics
Airbnb Seasonality Analysis & Trends in Sprimont (2026)
Peak Season (July, November, October)
- Revenue averages $3,510 per month
- Occupancy rates average 51.2%
- Daily rates average $241
Shoulder Season
- Revenue averages $2,883 per month
- Occupancy maintains around 44.5%
- Daily rates hold near $217
Low Season (January, February, March)
- Revenue drops to average $2,206 per month
- Occupancy decreases to average 32.2%
- Daily rates adjust to average $212
Seasonality Insights for Sprimont
- The Airbnb seasonality in Sprimont shows moderate seasonality with distinct peak and low periods. While the sections above show seasonal averages, it's also insightful to look at the extremes:
- During the high season, the absolute peak month showcases Sprimont's highest earning potential, with monthly revenues capable of climbing to $3,551, occupancy reaching a high of 63.2%, and ADRs peaking at $255.
- Conversely, the slowest single month of the year, typically falling within the low season, marks the market's lowest point. In this month, revenue might dip to $2,042, occupancy could drop to 23.5%, and ADRs may adjust down to $194.
- Understanding both the seasonal averages and these monthly peaks and troughs in revenue, occupancy, and ADR is crucial for maximizing your Airbnb profit potential in Sprimont.
Seasonal Strategies for Maximizing Profit
- Peak Season: Maximize revenue through premium pricing and potentially longer minimum stays. Ensure high availability.
- Low Season: Offer competitive pricing, special promotions (e.g., extended stay discounts), and flexible cancellation policies. Target off-season travelers like remote workers or budget-conscious guests.
- Shoulder Seasons: Implement dynamic pricing that balances peak and low rates. Target weekend travelers or specific events. Offer slightly more flexible terms than peak season.
- Regularly analyze your own performance against these Sprimont seasonality benchmarks and adjust your pricing and availability strategy accordingly.
Best Areas for Airbnb Investment in Sprimont (2026)
Exploring the top neighborhoods for short-term rentals in Sprimont? This section highlights key areas, outlining why they are attractive for hosts and guests, along with notable local attractions. Consider these locations based on your target guest profile and investment strategy.
| Neighborhood / Area | Why Host Here? (Target Guests & Appeal) | Key Attractions & Landmarks |
|---|---|---|
| Sprimont Center | The heart of Sprimont, offering access to local shops, cafes, and restaurants. It's a charming area that attracts visitors looking to experience local culture and amenities. | Sprimont Town Hall, Local cafes, Shops and boutiques, Markets on weekends |
| Franchimont Castle | An impressive historical site providing a unique glimpse into the region's past. It attracts history enthusiasts and families looking for educational experiences. | Franchimont Castle ruins, Guided tours, Scenic views from the castle, Picnic areas nearby |
| Outremeuse | A picturesque area near the river, known for its natural beauty and serene environment, ideal for those seeking relaxation and tranquility. | River walks, Nature reserves, Local parks, Cycling paths |
| Les Avins | A quiet residential area that provides a peaceful escape. It offers beautiful landscapes and is popular among nature lovers and hikers. | Hiking trails, Natural reserves, Local fauna and flora, Scenic viewpoints |
| Moucron | A charming village close to Sprimont, where traditional Belgian culture can be experienced. A great spot for tourists wanting to explore beyond the main town. | Local festivals, Traditional eateries, Historic architecture, Artisan shops |
| Sprimont's Nature Park | A lush green space that attracts outdoor enthusiasts. Perfect for hiking, biking, and enjoying nature, making it appealing to active travelers. | Hiking trails, Bird watching, Picnic spots, Playgrounds |
| Crisnée | Nearby town known for its friendly community and vibrant local market scene. Ideal for visitors looking for an authentic Belgian experience. | Local market days, Cafés and bistros, Crisnée village events, Cultural workshops |
| Vaux-sous-Chèvremont | This area offers a mix of scenic town life and easy access to nearby attractions. It caters to those who appreciate a balance of nature and convenience. | Vaux Park, Walking trails, Community events, Local artisans |
Understanding Airbnb License Requirements & STR Laws in Sprimont (2026)
While Sprimont, Liège, Belgium currently shows low STR regulations, specific Airbnb license requirements might still exist or change. Always verify the latest short term rental regulations and Airbnb license requirements directly with local government authorities for Sprimont to ensure full compliance before hosting.
(Source: AirROI data, 2026, finding no licensed listings among those analyzed)
Top Performing Airbnb Properties in Sprimont (2026)
Benchmark your potential! Explore examples of top-performing Airbnb properties in Sprimontbased on Trailing Twelve Month (TTM) revenue. Analyze their characteristics, revenue, occupancy rate, and ADR to understand what drives success in this market.
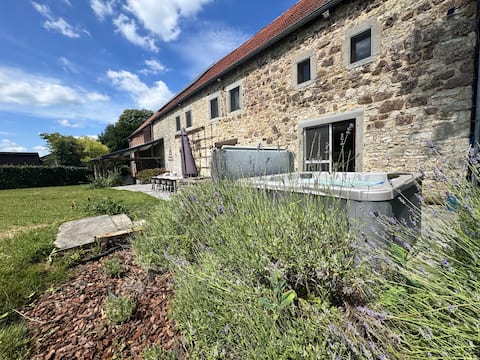
Charming house with Jacuzzi, sauna, large garden
Entire Place • 5 bedrooms
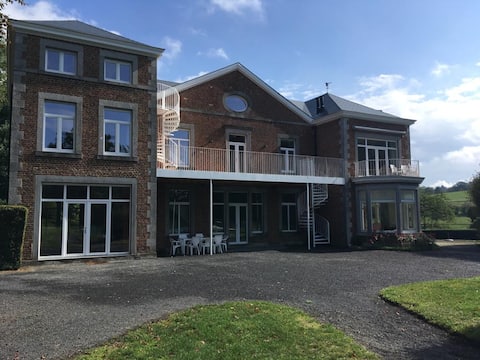
Gîte/House 30 people with wooded park + tennis
Entire Place • 11 bedrooms

La Fermette d'Hayen
Entire Place • 4 bedrooms

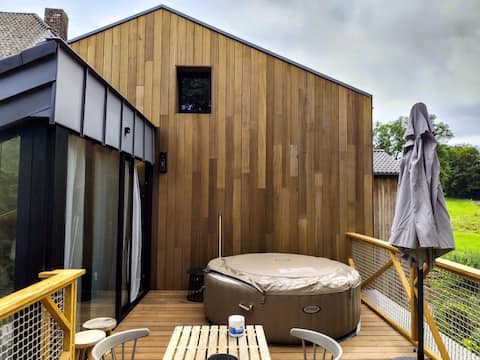
Family home with a hot tub and a quiet garden.
Entire Place • 4 bedrooms

Le Clos du Montys, villa with private pool
Entire Place • 3 bedrooms
Marie in the Countryside
Entire Place • 3 bedrooms
Note: Performance varies based on location, size, amenities, seasonality, and management quality. Data reflects the past 12 months.
Top Performing Airbnb Hosts in Sprimont (2026)
Learn from the best! This table showcases top-performing Airbnb hosts in Sprimont based on the number of properties managed and estimated total revenue over the past year. Analyze their scale and performance metrics.
| Host Name | Properties | Grossing Revenue | Stay Reviews | Avg Rating |
|---|---|---|---|---|
| Kristina | 1 | $117,537 | 67 | 4.93/5.0 |
| Hautgné 17 | 1 | $116,086 | 17 | 4.88/5.0 |
| Marie | 1 | $95,273 | 98 | 4.98/5.0 |
| Cédric | 1 | $63,125 | 47 | 4.79/5.0 |
| Annick | 1 | $57,596 | 26 | 5.00/5.0 |
| Aldijana | 2 | $42,050 | 294 | 4.72/5.0 |
| Les Suites Wellness | 2 | $37,383 | 9 | 4.63/5.0 |
| Carine | 1 | $33,690 | 139 | 4.75/5.0 |
| Sylvie | 1 | $30,122 | 144 | 4.68/5.0 |
| Laurence | 2 | $27,801 | 82 | 4.88/5.0 |
Analyzing the strategies of top hosts, such as their property selection, pricing, and guest communication, can offer valuable lessons for optimizing your own Airbnb operations in Sprimont.
Dive Deeper: Advanced Sprimont STR Market Data (2026)
Ready to unlock more insights? AirROI provides access to advanced metrics and comprehensive Airbnb data for Sprimont. Explore detailed analytics beyond this report to refine your investment strategy, optimize pricing, and maximize your vacation rental profits.
Explore Advanced MetricsSprimont Short-Term Rental Market Composition (2026): Property & Room Types
Room Type Distribution
Property Type Distribution
Market Composition Insights for Sprimont
- The Sprimont Airbnb market composition is heavily skewed towards Entire Home/Apt listings, which make up 94.6% of the 37 active rentals. This indicates strong guest preference for privacy and space.
- Looking at the property type distribution in Sprimont, House properties are the most common (48.6%), reflecting the local real estate landscape.
- Houses represent a significant 48.6% portion, catering likely to families or larger groups.
- The presence of 10.8% Hotel/Boutique listings indicates integration with traditional hospitality.
- Smaller segments like outdoor/unique (combined 2.7%) offer potential for unique stay experiences.
Sprimont Airbnb Room Capacity Analysis (2026): Bedroom Distribution
Distribution of Listings by Number of Bedrooms
Room Capacity Insights for Sprimont
- The dominant room capacity in Sprimont is 1 bedroom listings, making up 43.2% of the market. This suggests a strong demand for properties suitable for couples or solo travelers.
- Together, 1 bedroom and 2 bedrooms properties represent 62.1% of the active Airbnb listings in Sprimont, indicating a high concentration in these sizes.
- A significant 35.1% of listings offer 3+ bedrooms, catering to larger groups and families seeking more space in Sprimont.
Sprimont Vacation Rental Guest Capacity Trends (2026)
Distribution of Listings by Guest Capacity
Guest Capacity Insights for Sprimont
- The most common guest capacity trend in Sprimont vacation rentals is listings accommodating 4 guests (29.7%). This suggests the primary traveler segment is likely small families or groups.
- Properties designed for 4 guests and 2 guests dominate the Sprimont STR market, accounting for 56.7% of listings.
- 35.1% of properties accommodate 6+ guests, serving the market segment for larger families or group travel in Sprimont.
- On average, properties in Sprimont are equipped to host 4.6 guests.
Sprimont Airbnb Booking Patterns (2026): Available vs. Booked Days
Available Days Distribution
Booked Days Distribution
Booking Pattern Insights for Sprimont
- The most common availability pattern in Sprimont falls within the 181-270 days range, representing 40.5% of listings. This suggests many properties have significant open periods on their calendars.
- Approximately 78.3% of listings show high availability (181+ days open annually), indicating potential for increased bookings or specific owner usage patterns.
- For booked days, the 91-180 days range is most frequent in Sprimont (40.5%), reflecting common guest stay durations or potential owner blocking patterns.
- A notable 21.6% of properties secure long booking periods (181+ days booked per year), highlighting successful long-term rental strategies or significant owner usage.
Sprimont Airbnb Minimum Stay Requirements Analysis
Distribution of Listings by Minimum Night Requirement
1 Night
20 listings
54.1% of total
2 Nights
10 listings
27% of total
3 Nights
2 listings
5.4% of total
7-29 Nights
1 listings
2.7% of total
30+ Nights
4 listings
10.8% of total
Key Insights
- The most prevalent minimum stay requirement in Sprimont is 1 Night, adopted by 54.1% of listings. This highlights the market's preference for shorter, flexible bookings.
- A strong majority (81.1%) of the Sprimont Airbnb data shows acceptance of very short stays (1-2 nights), indicating a dynamic, high-turnover market.
- A significant segment (10.8%) caters to monthly stays (30+ nights) in Sprimont, pointing to opportunities in the extended-stay market.
Recommendations
- Align with the market by considering a 1 Night minimum stay, as 54.1% of Sprimont hosts use this setting.
- Explore offering discounts for stays of 30+ nights to attract the 10.8% of the market seeking extended stays.
- Adjust minimum nights based on seasonality – potentially shorter during low season and longer during peak demand periods in Sprimont.
Sprimont Airbnb Cancellation Policy Trends Analysis (2026)
Super Strict 30 Days
1 listings
2.7% of total
Flexible
9 listings
24.3% of total
Moderate
15 listings
40.5% of total
Firm
9 listings
24.3% of total
Strict
3 listings
8.1% of total
Cancellation Policy Insights for Sprimont
- The prevailing Airbnb cancellation policy trend in Sprimont is Moderate, used by 40.5% of listings.
- There's a relatively balanced mix between guest-friendly (64.8%) and stricter (32.4%) policies, offering choices for different guest needs.
- Strict cancellation policies are quite rare (8.1%), potentially making listings with this policy less competitive unless justified by high demand or property type.
Recommendations for Hosts
- Consider adopting a Moderate policy to align with the 40.5% market standard in Sprimont.
- Using a Strict policy might deter some guests, as only 8.1% of listings use it. Evaluate if potential revenue protection outweighs possible lower booking rates.
- Regularly review your cancellation policy against competitors and market demand shifts in Sprimont.
Sprimont STR Booking Lead Time Analysis (2026)
Average Booking Lead Time by Month
Booking Lead Time Insights for Sprimont
- The overall average booking lead time for vacation rentals in Sprimont is 54 days.
- Guests book furthest in advance for stays during July (average 95 days), likely coinciding with peak travel demand or local events.
- The shortest booking windows occur for stays in March (average 25 days), indicating more last-minute travel plans during this time.
- Seasonally, Summer (73 days avg.) sees the longest lead times, while Winter (32 days avg.) has the shortest, reflecting typical travel planning cycles.
Recommendations for Hosts
- Use the overall average lead time (54 days) as a baseline for your pricing and availability strategy in Sprimont.
- For July stays, consider implementing length-of-stay discounts or slightly higher rates for bookings made less than 95 days out to capitalize on advance planning.
- Target marketing efforts for the Summer season well in advance (at least 73 days) to capture early planners.
- Monitor your own booking lead times against these Sprimont averages to identify opportunities for dynamic pricing adjustments.
Popular & Essential Airbnb Amenities in Sprimont (2026)
Amenity Prevalence
Amenity Insights for Sprimont
- Essential amenities in Sprimont that guests expect include: Kitchen, Wifi, Heating. Lacking these (any) could significantly impact bookings.
- Popular amenities like Free parking on premises, Dishes and silverware, TV are common but not universal. Offering these can provide a competitive edge.
Recommendations for Hosts
- Ensure your listing includes all essential amenities for Sprimont: Kitchen, Wifi, Heating.
- Consider adding popular differentiators like Free parking on premises or Dishes and silverware to increase appeal.
- Highlight unique or less common amenities you offer (e.g., hot tub, dedicated workspace, EV charger) in your listing description and photos.
- Regularly check competitor amenities in Sprimont to stay competitive.
Sprimont Airbnb Guest Demographics & Profile Analysis (2026)
Guest Profile Summary for Sprimont
- The typical guest profile for Airbnb in Sprimont consists of predominantly international visitors (67%), with top international origins including Netherlands, typically belonging to the Post-2000s (Gen Z/Alpha) group (50%), primarily speaking English or French.
- Domestic travelers account for 32.8% of guests.
- Key international markets include Belgium (32.8%) and Netherlands (26.6%).
- Top languages spoken are English (37.4%) followed by French (23.5%).
- A significant demographic segment is the Post-2000s (Gen Z/Alpha) group, representing 50% of guests.
Recommendations for Hosts
- Focus marketing internationally, particularly towards travelers from Netherlands.
- Tailor amenities and listing descriptions to appeal to the dominant Post-2000s (Gen Z/Alpha) demographic (e.g., highlight fast WiFi, smart home features, local guides).
- Highlight unique local experiences or amenities relevant to the primary guest profile.
- Consider seasonal promotions aligned with peak travel times for key origin markets.
Nearby Short-Term Rental Market Comparison
How does the Sprimont Airbnb market stack up against its neighbors? Compare key performance metrics like average monthly revenue, ADR, and occupancy rates in surrounding areas to understand the broader regional STR landscape.
| Market | Active Properties | Monthly Revenue | Daily Rate | Avg. Occupancy |
|---|---|---|---|---|
| Raamsdonksveer | 16 | $7,756 | $736.17 | 38% |
| Haghorst | 11 | $5,995 | $480.40 | 40% |
| Baarlo | 20 | $5,442 | $332.61 | 51% |
| Merksplas | 12 | $5,367 | $356.64 | 43% |
| Incourt | 13 | $4,412 | $303.48 | 52% |
| Wellin | 12 | $4,365 | $446.64 | 42% |
| Aubel | 26 | $4,191 | $283.88 | 46% |
| Dion | 12 | $4,104 | $270.32 | 50% |
| Bertogne | 26 | $3,839 | $325.90 | 42% |
| Mettet | 21 | $3,771 | $283.66 | 42% |