Tournai Airbnb Market Analysis 2026: Short Term Rental Data & Vacation Rental Statistics in Hainaut, Belgium
Is Airbnb profitable in Tournai in 2026? Explore comprehensive Airbnb analytics for Tournai, Hainaut, Belgium to uncover income potential. This 2026 STR market report for Tournai, based on AirROI data from February 2025 to January 2026, reveals key trends in the niche market of 106 active listings.
Whether you're considering an Airbnb investment in Tournai, optimizing your existing vacation rental, or exploring rental arbitrage opportunities, understanding the Tournai Airbnb data is crucial. Leveraging the low regulation environment is key to maximizing your short term rental income potential. Let's dive into the specifics.
Key Tournai Airbnb Performance Metrics Overview
Monthly Airbnb Revenue Variations & Income Potential in Tournai (2026)
Understanding the monthly revenue variations for Airbnb listings in Tournai is key to maximizing your short term rental income potential. Seasonality significantly impacts earnings. Our analysis, based on data from the past 12 months, shows that the peak revenue month for STRs in Tournai is typically August, while January often presents the lowest earnings, highlighting opportunities for strategic pricing adjustments during shoulder and low seasons. Explore the typical Airbnb income in Tournai across different performance tiers:
- Best-in-class properties (Top 10%) achieve $3,712+ monthly, often utilizing dynamic pricing and superior guest experiences.
- Strong performing properties (Top 25%) earn $2,419 or more, indicating effective management and desirable locations/amenities.
- Typical properties (Median) generate around $1,323 per month, representing the average market performance.
- Entry-level properties (Bottom 25%) see earnings around $524, often with potential for optimization.
Average Monthly Airbnb Earnings Trend in Tournai
Tournai Airbnb Occupancy Rate Trends (2026)
Maximize your bookings by understanding the Tournai STR occupancy trends. Seasonal demand shifts significantly influence how often properties are booked. Typically, Augustsees the highest demand (peak season occupancy), while January experiences the lowest (low season). Effective strategies, like adjusting minimum stays or offering promotions, can boost occupancy during slower periods. Here's how different property tiers perform in Tournai:
- Best-in-class properties (Top 10%) achieve 77%+ occupancy, indicating high desirability and potentially optimized availability.
- Strong performing properties (Top 25%) maintain 62% or higher occupancy, suggesting good market fit and guest satisfaction.
- Typical properties (Median) have an occupancy rate around 33%.
- Entry-level properties (Bottom 25%) average 15% occupancy, potentially facing higher vacancy.
Average Monthly Occupancy Rate Trend in Tournai
Average Daily Rate (ADR) Airbnb Trends in Tournai (2026)
Effective short term rental pricing strategy in Tournai involves understanding monthly ADR fluctuations. The Average Daily Rate (ADR) for Airbnb in Tournai typically peaks in January and dips lowest during March. Leveraging Airbnb dynamic pricing tools or strategies based on this seasonality can significantly boost revenue. Here's a look at the typical nightly rates achieved:
- Best-in-class properties (Top 10%) command rates of $316+ per night, often due to premium features or locations.
- Strong performing properties (Top 25%) achieve nightly rates of $175 or more.
- Typical properties (Median) charge around $117 per night.
- Entry-level properties (Bottom 25%) earn around $88 per night.
Average Daily Rate (ADR) Trend by Month in Tournai
Get Live Tournai Market Intelligence 👇

Explore Real-time Analytics
Airbnb Seasonality Analysis & Trends in Tournai (2026)
Peak Season (August, July, December)
- Revenue averages $2,321 per month
- Occupancy rates average 44.1%
- Daily rates average $166
Shoulder Season
- Revenue averages $1,817 per month
- Occupancy maintains around 37.9%
- Daily rates hold near $165
Low Season (January, February, March)
- Revenue drops to average $1,513 per month
- Occupancy decreases to average 34.7%
- Daily rates adjust to average $161
Seasonality Insights for Tournai
- The Airbnb seasonality in Tournai shows moderate seasonality with distinct peak and low periods. While the sections above show seasonal averages, it's also insightful to look at the extremes:
- During the high season, the absolute peak month showcases Tournai's highest earning potential, with monthly revenues capable of climbing to $2,481, occupancy reaching a high of 47.1%, and ADRs peaking at $177.
- Conversely, the slowest single month of the year, typically falling within the low season, marks the market's lowest point. In this month, revenue might dip to $1,384, occupancy could drop to 26.7%, and ADRs may adjust down to $152.
- Understanding both the seasonal averages and these monthly peaks and troughs in revenue, occupancy, and ADR is crucial for maximizing your Airbnb profit potential in Tournai.
Seasonal Strategies for Maximizing Profit
- Peak Season: Maximize revenue through premium pricing and potentially longer minimum stays. Ensure high availability.
- Low Season: Offer competitive pricing, special promotions (e.g., extended stay discounts), and flexible cancellation policies. Target off-season travelers like remote workers or budget-conscious guests.
- Shoulder Seasons: Implement dynamic pricing that balances peak and low rates. Target weekend travelers or specific events. Offer slightly more flexible terms than peak season.
- Regularly analyze your own performance against these Tournai seasonality benchmarks and adjust your pricing and availability strategy accordingly.
Best Areas for Airbnb Investment in Tournai (2026)
Exploring the top neighborhoods for short-term rentals in Tournai? This section highlights key areas, outlining why they are attractive for hosts and guests, along with notable local attractions. Consider these locations based on your target guest profile and investment strategy.
| Neighborhood / Area | Why Host Here? (Target Guests & Appeal) | Key Attractions & Landmarks |
|---|---|---|
| Grand Place | The historic heart of Tournai, ideal for cultural tourism due to its stunning architecture and vibrant atmosphere. Tourists flock for the charm of medieval buildings and lively cafes. | Tournai Cathedral, Grand Market Square, Belfry of Tournai, Museum of Fine Arts, Église Saint-Jacques |
| Place de Lille | A bustling square near the city's main shopping area, perfect for visitors seeking local boutiques, cafes, and restaurants. It's a lively spot that's always buzzing with activity. | Shopping district, Nearby restaurants, Local markets, Cafés with outdoor seating, Cultural events |
| Esplanade | A picturesque location along the river with beautiful walks and parks, attractive to families and nature lovers. Provides a peaceful escape from the urban hustle. | City Park, Riverside walks, Playgrounds, Outdoor sports areas, Picnic spots |
| Collegiate Church of St. Peter | Famous for its historical significance and architecture, attracting visitors interested in history and culture. A must-see for art and architecture aficionados. | Historical architecture, Guided tours, Cultural exhibitions, Art displays, Photography opportunities |
| Tournai's Museum of Fine Arts | An essential spot for art lovers, showcasing local and international artworks. Ideal for those interested in the local culture and heritage. | Fine art collections, Rotating exhibits, Cultural events, Workshops, Historical artifacts |
| Charleroi-Tournai Canal | Great for outdoor enthusiasts and those looking to enjoy scenic views and tranquil walks. Appeals to tourists who enjoy cycling or walking along beautiful waterways. | Scenic canal walks, Cycling paths, Picnic areas, Water sports, Wildlife viewing |
| La Table d'Amis | A popular eatery known for its local cuisine and warm atmosphere. Perfect for foodies and those looking to experience local dining. | Local Belgian dishes, Dining ambiance, Wine tastings, Culinary events, Catering services |
| Tournai's Historic Centre | Offers a blend of history, culture, and architecture, attracting diverse tourists. The ancient streets are perfect for exploring on foot and discovering local gems. | Historic architecture, Cafés and shops, Guided walking tours, Locally made products, Artisan workshops |
Understanding Airbnb License Requirements & STR Laws in Tournai (2026)
While Tournai, Hainaut, Belgium currently shows low STR regulations, specific Airbnb license requirements might still exist or change. Always verify the latest short term rental regulations and Airbnb license requirements directly with local government authorities for Tournai to ensure full compliance before hosting.
(Source: AirROI data, 2026, finding no licensed listings among those analyzed)
Top Performing Airbnb Properties in Tournai (2026)
Benchmark your potential! Explore examples of top-performing Airbnb properties in Tournaibased on Trailing Twelve Month (TTM) revenue. Analyze their characteristics, revenue, occupancy rate, and ADR to understand what drives success in this market.

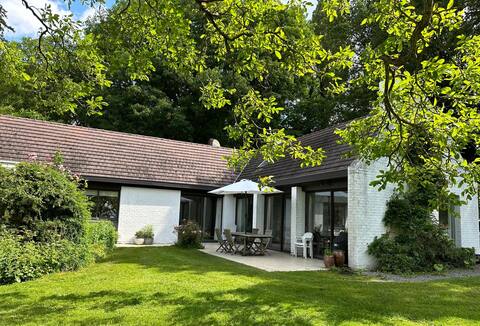
Chateau Villami at the foot of Mont St Aubert
Entire Place • 10 bedrooms
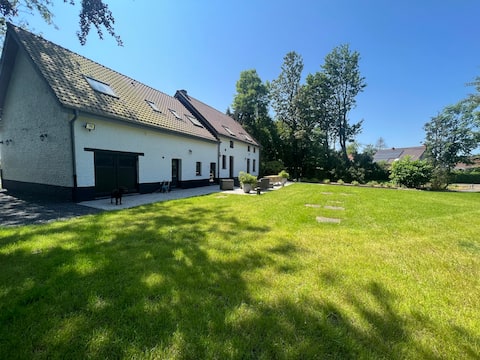
Family home
Entire Place • 4 bedrooms

Bar for rent with 2 bedrooms, 1 dormitory
Entire Place • 3 bedrooms

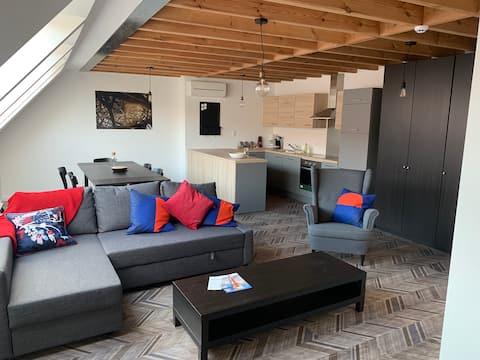
Spacious eco-house with unique view of the mill
Entire Place • 3 bedrooms
The Gardener's Lodge
Entire Place • 5 bedrooms
Gîte de Tournai-Cathédrale-Centre-Historique
Entire Place • 2 bedrooms
Note: Performance varies based on location, size, amenities, seasonality, and management quality. Data reflects the past 12 months.
Top Performing Airbnb Hosts in Tournai (2026)
Learn from the best! This table showcases top-performing Airbnb hosts in Tournai based on the number of properties managed and estimated total revenue over the past year. Analyze their scale and performance metrics.
| Host Name | Properties | Grossing Revenue | Stay Reviews | Avg Rating |
|---|---|---|---|---|
| Geert | 1 | $185,842 | 11 | 4.91/5.0 |
| Sophie | 5 | $95,265 | 125 | 4.96/5.0 |
| Eugène | 3 | $93,746 | 15 | 5.00/5.0 |
| Cedric | 3 | $77,977 | 202 | 4.91/5.0 |
| Béatrice | 1 | $67,634 | 48 | 4.54/5.0 |
| Inthemia | 5 | $60,601 | 30 | 4.89/5.0 |
| Anne Marie | 2 | $57,636 | 73 | 4.68/5.0 |
| Eric | 1 | $54,017 | 54 | 4.98/5.0 |
| Bruno | 1 | $43,465 | 13 | 4.92/5.0 |
| Marie-Line | 3 | $41,068 | 145 | 4.68/5.0 |
Analyzing the strategies of top hosts, such as their property selection, pricing, and guest communication, can offer valuable lessons for optimizing your own Airbnb operations in Tournai.
Dive Deeper: Advanced Tournai STR Market Data (2026)
Ready to unlock more insights? AirROI provides access to advanced metrics and comprehensive Airbnb data for Tournai. Explore detailed analytics beyond this report to refine your investment strategy, optimize pricing, and maximize your vacation rental profits.
Explore Advanced MetricsTournai Short-Term Rental Market Composition (2026): Property & Room Types
Room Type Distribution
Property Type Distribution
Market Composition Insights for Tournai
- The Tournai Airbnb market composition is heavily skewed towards Entire Home/Apt listings, which make up 70.8% of the 106 active rentals. This indicates strong guest preference for privacy and space.
- Looking at the property type distribution in Tournai, House properties are the most common (35.8%), reflecting the local real estate landscape.
- Houses represent a significant 35.8% portion, catering likely to families or larger groups.
- The presence of 21.7% Hotel/Boutique listings indicates integration with traditional hospitality.
- Smaller segments like others, unique stays (combined 3.8%) offer potential for unique stay experiences.
Tournai Airbnb Room Capacity Analysis (2026): Bedroom Distribution
Distribution of Listings by Number of Bedrooms
Room Capacity Insights for Tournai
- The dominant room capacity in Tournai is 1 bedroom listings, making up 39.6% of the market. This suggests a strong demand for properties suitable for couples or solo travelers.
- Together, 1 bedroom and 2 bedrooms properties represent 61.3% of the active Airbnb listings in Tournai, indicating a high concentration in these sizes.
Tournai Vacation Rental Guest Capacity Trends (2026)
Distribution of Listings by Guest Capacity
Guest Capacity Insights for Tournai
- The most common guest capacity trend in Tournai vacation rentals is listings accommodating 4 guests (22.6%). This suggests the primary traveler segment is likely small families or groups.
- Properties designed for 4 guests and 2 guests dominate the Tournai STR market, accounting for 45.2% of listings.
- 25.5% of properties accommodate 6+ guests, serving the market segment for larger families or group travel in Tournai.
- On average, properties in Tournai are equipped to host 3.6 guests.
Tournai Airbnb Booking Patterns (2026): Available vs. Booked Days
Available Days Distribution
Booked Days Distribution
Booking Pattern Insights for Tournai
- The most common availability pattern in Tournai falls within the 271-366 days range, representing 51.9% of listings. This suggests many properties have significant open periods on their calendars.
- Approximately 73.6% of listings show high availability (181+ days open annually), indicating potential for increased bookings or specific owner usage patterns.
- For booked days, the 31-90 days range is most frequent in Tournai (36.8%), reflecting common guest stay durations or potential owner blocking patterns.
- A notable 27.4% of properties secure long booking periods (181+ days booked per year), highlighting successful long-term rental strategies or significant owner usage.
Tournai Airbnb Minimum Stay Requirements Analysis
Distribution of Listings by Minimum Night Requirement
1 Night
50 listings
47.2% of total
2 Nights
28 listings
26.4% of total
3 Nights
4 listings
3.8% of total
4-6 Nights
4 listings
3.8% of total
7-29 Nights
4 listings
3.8% of total
30+ Nights
16 listings
15.1% of total
Key Insights
- The most prevalent minimum stay requirement in Tournai is 1 Night, adopted by 47.2% of listings. This highlights the market's preference for shorter, flexible bookings.
- A strong majority (73.6%) of the Tournai Airbnb data shows acceptance of very short stays (1-2 nights), indicating a dynamic, high-turnover market.
- A significant segment (15.1%) caters to monthly stays (30+ nights) in Tournai, pointing to opportunities in the extended-stay market.
Recommendations
- Align with the market by considering a 1 Night minimum stay, as 47.2% of Tournai hosts use this setting.
- Explore offering discounts for stays of 30+ nights to attract the 15.1% of the market seeking extended stays.
- Adjust minimum nights based on seasonality – potentially shorter during low season and longer during peak demand periods in Tournai.
Tournai Airbnb Cancellation Policy Trends Analysis (2026)
Super Strict 30 Days
1 listings
1% of total
Limited
1 listings
1% of total
Flexible
36 listings
34.6% of total
Moderate
29 listings
27.9% of total
Firm
32 listings
30.8% of total
Strict
5 listings
4.8% of total
Cancellation Policy Insights for Tournai
- The prevailing Airbnb cancellation policy trend in Tournai is Flexible, used by 34.6% of listings.
- There's a relatively balanced mix between guest-friendly (62.5%) and stricter (35.6%) policies, offering choices for different guest needs.
- Strict cancellation policies are quite rare (4.8%), potentially making listings with this policy less competitive unless justified by high demand or property type.
Recommendations for Hosts
- Consider adopting a Flexible policy to align with the 34.6% market standard in Tournai.
- Using a Strict policy might deter some guests, as only 4.8% of listings use it. Evaluate if potential revenue protection outweighs possible lower booking rates.
- Regularly review your cancellation policy against competitors and market demand shifts in Tournai.
Tournai STR Booking Lead Time Analysis (2026)
Average Booking Lead Time by Month
Booking Lead Time Insights for Tournai
- The overall average booking lead time for vacation rentals in Tournai is 46 days.
- Guests book furthest in advance for stays during August (average 56 days), likely coinciding with peak travel demand or local events.
- The shortest booking windows occur for stays in February (average 25 days), indicating more last-minute travel plans during this time.
- Seasonally, Summer (53 days avg.) sees the longest lead times, while Winter (35 days avg.) has the shortest, reflecting typical travel planning cycles.
Recommendations for Hosts
- Use the overall average lead time (46 days) as a baseline for your pricing and availability strategy in Tournai.
- Target marketing efforts for the Summer season well in advance (at least 53 days) to capture early planners.
- Monitor your own booking lead times against these Tournai averages to identify opportunities for dynamic pricing adjustments.
Popular & Essential Airbnb Amenities in Tournai (2026)
Amenity Prevalence
Amenity Insights for Tournai
- Essential amenities in Tournai that guests expect include: Wifi. Lacking these (this) could significantly impact bookings.
- Popular amenities like Smoke alarm, Heating, Kitchen are common but not universal. Offering these can provide a competitive edge.
Recommendations for Hosts
- Ensure your listing includes all essential amenities for Tournai: Wifi.
- Prioritize adding missing essentials: Wifi.
- Consider adding popular differentiators like Smoke alarm or Heating to increase appeal.
- Highlight unique or less common amenities you offer (e.g., hot tub, dedicated workspace, EV charger) in your listing description and photos.
- Regularly check competitor amenities in Tournai to stay competitive.
Tournai Airbnb Guest Demographics & Profile Analysis (2026)
Guest Profile Summary for Tournai
- The typical guest profile for Airbnb in Tournai consists of predominantly international visitors (72%), with top international origins including Belgium, typically belonging to the Post-2000s (Gen Z/Alpha) group (50%), primarily speaking English or French.
- Domestic travelers account for 28.2% of guests.
- Key international markets include France (41.3%) and Belgium (28.2%).
- Top languages spoken are English (35.5%) followed by French (28.7%).
- A significant demographic segment is the Post-2000s (Gen Z/Alpha) group, representing 50% of guests.
Recommendations for Hosts
- Focus marketing internationally, particularly towards travelers from Belgium.
- Tailor amenities and listing descriptions to appeal to the dominant Post-2000s (Gen Z/Alpha) demographic (e.g., highlight fast WiFi, smart home features, local guides).
- Highlight unique local experiences or amenities relevant to the primary guest profile.
- Consider seasonal promotions aligned with peak travel times for key origin markets.
Nearby Short-Term Rental Market Comparison
How does the Tournai Airbnb market stack up against its neighbors? Compare key performance metrics like average monthly revenue, ADR, and occupancy rates in surrounding areas to understand the broader regional STR landscape.
| Market | Active Properties | Monthly Revenue | Daily Rate | Avg. Occupancy |
|---|---|---|---|---|
| Raamsdonksveer | 16 | $7,756 | $736.17 | 38% |
| Lo-Reninge | 13 | $5,989 | $454.03 | 42% |
| Mont-de-l'Enclus | 10 | $5,398 | $407.81 | 36% |
| Merksplas | 12 | $5,367 | $356.64 | 43% |
| Zerkegem | 10 | $4,846 | $437.71 | 57% |
| Anzegem | 10 | $4,425 | $460.61 | 35% |
| Incourt | 13 | $4,412 | $303.48 | 52% |
| Dizy | 11 | $4,106 | $250.48 | 49% |
| Dion | 12 | $4,104 | $270.32 | 50% |
| Ronse - Renaix | 18 | $3,878 | $411.21 | 35% |