Comines-Warneton Airbnb Market Analysis 2026: Short Term Rental Data & Vacation Rental Statistics in Hainaut, Belgium
Is Airbnb profitable in Comines-Warneton in 2026? Explore comprehensive Airbnb analytics for Comines-Warneton, Hainaut, Belgium to uncover income potential. This 2026 STR market report for Comines-Warneton, based on AirROI data from February 2025 to January 2026, reveals key trends in the niche market of 48 active listings.
Whether you're considering an Airbnb investment in Comines-Warneton, optimizing your existing vacation rental, or exploring rental arbitrage opportunities, understanding the Comines-Warneton Airbnb data is crucial. Leveraging the low regulation environment is key to maximizing your short term rental income potential. Let's dive into the specifics.
Key Comines-Warneton Airbnb Performance Metrics Overview
Monthly Airbnb Revenue Variations & Income Potential in Comines-Warneton (2026)
Understanding the monthly revenue variations for Airbnb listings in Comines-Warneton is key to maximizing your short term rental income potential. Seasonality significantly impacts earnings. Our analysis, based on data from the past 12 months, shows that the peak revenue month for STRs in Comines-Warneton is typically May, while January often presents the lowest earnings, highlighting opportunities for strategic pricing adjustments during shoulder and low seasons. Explore the typical Airbnb income in Comines-Warneton across different performance tiers:
- Best-in-class properties (Top 10%) achieve $8,002+ monthly, often utilizing dynamic pricing and superior guest experiences.
- Strong performing properties (Top 25%) earn $3,648 or more, indicating effective management and desirable locations/amenities.
- Typical properties (Median) generate around $1,997 per month, representing the average market performance.
- Entry-level properties (Bottom 25%) see earnings around $1,055, often with potential for optimization.
Average Monthly Airbnb Earnings Trend in Comines-Warneton
Comines-Warneton Airbnb Occupancy Rate Trends (2026)
Maximize your bookings by understanding the Comines-Warneton STR occupancy trends. Seasonal demand shifts significantly influence how often properties are booked. Typically, Augustsees the highest demand (peak season occupancy), while January experiences the lowest (low season). Effective strategies, like adjusting minimum stays or offering promotions, can boost occupancy during slower periods. Here's how different property tiers perform in Comines-Warneton:
- Best-in-class properties (Top 10%) achieve 73%+ occupancy, indicating high desirability and potentially optimized availability.
- Strong performing properties (Top 25%) maintain 56% or higher occupancy, suggesting good market fit and guest satisfaction.
- Typical properties (Median) have an occupancy rate around 39%.
- Entry-level properties (Bottom 25%) average 23% occupancy, potentially facing higher vacancy.
Average Monthly Occupancy Rate Trend in Comines-Warneton
Average Daily Rate (ADR) Airbnb Trends in Comines-Warneton (2026)
Effective short term rental pricing strategy in Comines-Warneton involves understanding monthly ADR fluctuations. The Average Daily Rate (ADR) for Airbnb in Comines-Warneton typically peaks in June and dips lowest during January. Leveraging Airbnb dynamic pricing tools or strategies based on this seasonality can significantly boost revenue. Here's a look at the typical nightly rates achieved:
- Best-in-class properties (Top 10%) command rates of $557+ per night, often due to premium features or locations.
- Strong performing properties (Top 25%) achieve nightly rates of $249 or more.
- Typical properties (Median) charge around $142 per night.
- Entry-level properties (Bottom 25%) earn around $97 per night.
Average Daily Rate (ADR) Trend by Month in Comines-Warneton
Get Live Comines-Warneton Market Intelligence 👇

Explore Real-time Analytics
Airbnb Seasonality Analysis & Trends in Comines-Warneton (2026)
Peak Season (May, July, August)
- Revenue averages $4,108 per month
- Occupancy rates average 50.1%
- Daily rates average $248
Shoulder Season
- Revenue averages $3,429 per month
- Occupancy maintains around 40.6%
- Daily rates hold near $237
Low Season (January, February, September)
- Revenue drops to average $2,268 per month
- Occupancy decreases to average 33.7%
- Daily rates adjust to average $236
Seasonality Insights for Comines-Warneton
- The Airbnb seasonality in Comines-Warneton shows highly seasonal trends requiring careful strategy. While the sections above show seasonal averages, it's also insightful to look at the extremes:
- During the high season, the absolute peak month showcases Comines-Warneton's highest earning potential, with monthly revenues capable of climbing to $4,159, occupancy reaching a high of 51.7%, and ADRs peaking at $256.
- Conversely, the slowest single month of the year, typically falling within the low season, marks the market's lowest point. In this month, revenue might dip to $1,708, occupancy could drop to 20.7%, and ADRs may adjust down to $225.
- Understanding both the seasonal averages and these monthly peaks and troughs in revenue, occupancy, and ADR is crucial for maximizing your Airbnb profit potential in Comines-Warneton.
Seasonal Strategies for Maximizing Profit
- Peak Season: Maximize revenue through premium pricing and potentially longer minimum stays. Ensure high availability.
- Low Season: Offer competitive pricing, special promotions (e.g., extended stay discounts), and flexible cancellation policies. Target off-season travelers like remote workers or budget-conscious guests.
- Shoulder Seasons: Implement dynamic pricing that balances peak and low rates. Target weekend travelers or specific events. Offer slightly more flexible terms than peak season.
- Regularly analyze your own performance against these Comines-Warneton seasonality benchmarks and adjust your pricing and availability strategy accordingly.
Best Areas for Airbnb Investment in Comines-Warneton (2026)
Exploring the top neighborhoods for short-term rentals in Comines-Warneton? This section highlights key areas, outlining why they are attractive for hosts and guests, along with notable local attractions. Consider these locations based on your target guest profile and investment strategy.
| Neighborhood / Area | Why Host Here? (Target Guests & Appeal) | Key Attractions & Landmarks |
|---|---|---|
| Comines Town Center | Historic town center with charming architecture, local shops, and cafes. Ideal for tourists exploring local culture and history, with attractions within walking distance. | Comines Market Square, Saint Chrysole Church, Local restaurants, Cultural festivals, Historical buildings |
| Warneton | Offers a quiet, residential vibe with easy access to the local countryside and Belgium-France border. Attracts guests seeking tranquility and rural experiences. | Parks and gardens, Local farms, Cycling routes, Rural landscapes, Cultural heritage sites |
| Lille (nearby) | Proximity to Lille, France, a vibrant city known for its cultural events and festivals. Great for attracting international travelers looking for a mix of Belgian and French culture. | Palais des Beaux-Arts de Lille, Old Lille, Lille Grand Palais, Shopping districts, Cafes and restaurants |
| Ypres (Ieper) | Historic city with significant World War I history and memorials. Attracts history buffs and tourists interested in exploring poignant cultural heritage. | Menin Gate, Ypres Market Square, In Flanders Fields Museum, Tyne Cot Cemetery, Historical reenactments |
| Mouscron (nearby) | A neighboring town with reasonably priced accommodations and access to cultural experiences. Popular for guests looking for a simpler stay close to larger cities. | Local parks, Community events, Nearby shopping centers, Restaurants, Cultural sites |
| Houthem | A small, picturesque village perfect for scenic getaways and immersing in Belgian rural life, attracting families and nature lovers seeking a quiet escape. | Nature walks, Local farms, Vineyards, Traditional Belgian cuisine, Rural festivals |
| Komen | A nearby town known for its lovely surroundings and local festivals. Great for those seeking a small-town atmosphere and community events. | Local markets, Community events, Cultural heritage, Parks, Historical landmarks |
| Bousbecque | A small, charming town that is often overlooked, offering a unique local experience for guests wanting to explore lesser-known areas of Belgium. | Quiet streets, Local food specialties, Historical buildings, Nearby cycling paths, Community gatherings |
Understanding Airbnb License Requirements & STR Laws in Comines-Warneton (2026)
While Comines-Warneton, Hainaut, Belgium currently shows low STR regulations, specific Airbnb license requirements might still exist or change. Always verify the latest short term rental regulations and Airbnb license requirements directly with local government authorities for Comines-Warneton to ensure full compliance before hosting.
(Source: AirROI data, 2026, finding no licensed listings among those analyzed)
Top Performing Airbnb Properties in Comines-Warneton (2026)
Benchmark your potential! Explore examples of top-performing Airbnb properties in Comines-Warnetonbased on Trailing Twelve Month (TTM) revenue. Analyze their characteristics, revenue, occupancy rate, and ADR to understand what drives success in this market.
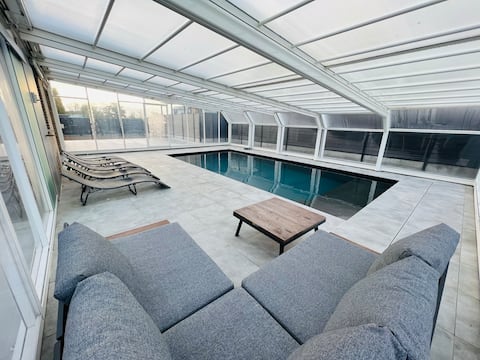
Villa with heated pool
Entire Place • 7 bedrooms
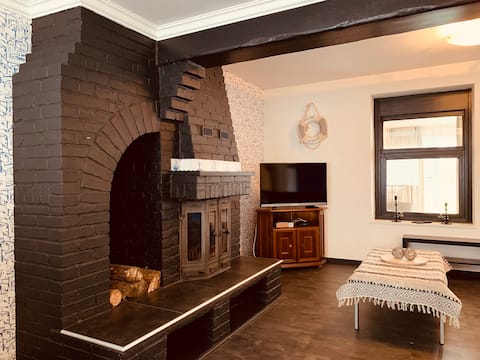
Vakantiewoning Au Bord de l'eau 14 people
Entire Place • 5 bedrooms
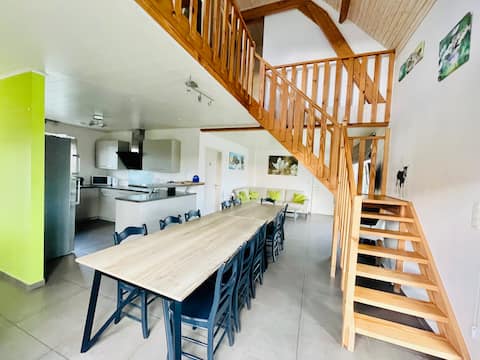
Vacation home La Prairie 18 people
Entire Place • 5 bedrooms

Gîte Le Fenil: Country house for 30 people.
Entire Place • 8 bedrooms

Comfortable gite Le Rivage 11
Entire Place • 5 bedrooms
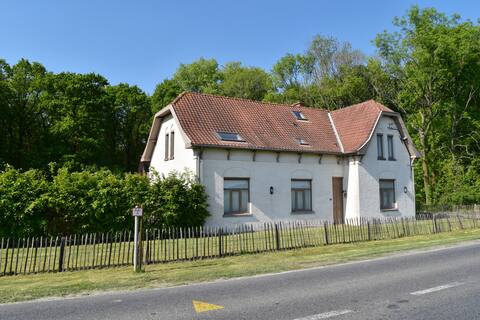
Authentically restored hunting lodge by the forest
Entire Place • 7 bedrooms
Note: Performance varies based on location, size, amenities, seasonality, and management quality. Data reflects the past 12 months.
Top Performing Airbnb Hosts in Comines-Warneton (2026)
Learn from the best! This table showcases top-performing Airbnb hosts in Comines-Warneton based on the number of properties managed and estimated total revenue over the past year. Analyze their scale and performance metrics.
| Host Name | Properties | Grossing Revenue | Stay Reviews | Avg Rating |
|---|---|---|---|---|
| Marie | 12 | $692,741 | 346 | 4.62/5.0 |
| Nancy | 2 | $99,903 | 7 | 4.67/5.0 |
| Alexandre | 5 | $95,152 | 258 | 4.69/5.0 |
| Agathe | 3 | $91,594 | 44 | 4.69/5.0 |
| Dominique | 6 | $61,096 | 43 | 4.85/5.0 |
| Enzo | 1 | $41,205 | 177 | 4.92/5.0 |
| Séverine | 1 | $40,671 | 121 | 4.99/5.0 |
| Berenice Et Olivier | 1 | $36,193 | 74 | 4.85/5.0 |
| Orlane | 2 | $34,206 | 55 | 4.80/5.0 |
| Marie | 2 | $24,612 | 11 | 4.70/5.0 |
Analyzing the strategies of top hosts, such as their property selection, pricing, and guest communication, can offer valuable lessons for optimizing your own Airbnb operations in Comines-Warneton.
Dive Deeper: Advanced Comines-Warneton STR Market Data (2026)
Ready to unlock more insights? AirROI provides access to advanced metrics and comprehensive Airbnb data for Comines-Warneton. Explore detailed analytics beyond this report to refine your investment strategy, optimize pricing, and maximize your vacation rental profits.
Explore Advanced MetricsComines-Warneton Short-Term Rental Market Composition (2026): Property & Room Types
Room Type Distribution
Property Type Distribution
Market Composition Insights for Comines-Warneton
- The Comines-Warneton Airbnb market composition is heavily skewed towards Entire Home/Apt listings, which make up 93.8% of the 48 active rentals. This indicates strong guest preference for privacy and space.
- Looking at the property type distribution in Comines-Warneton, House properties are the most common (72.9%), reflecting the local real estate landscape.
- Houses represent a significant 72.9% portion, catering likely to families or larger groups.
- Smaller segments like unique stays, outdoor/unique, hotel/boutique, others (combined 14.7%) offer potential for unique stay experiences.
Comines-Warneton Airbnb Room Capacity Analysis (2026): Bedroom Distribution
Distribution of Listings by Number of Bedrooms
Room Capacity Insights for Comines-Warneton
- The dominant room capacity in Comines-Warneton is 5+ bedrooms listings, making up 25% of the market. This suggests a strong demand for properties suitable for families or small groups.
- Together, 5+ bedrooms and 2 bedrooms properties represent 47.9% of the active Airbnb listings in Comines-Warneton, indicating a high concentration in these sizes.
- A significant 58.4% of listings offer 3+ bedrooms, catering to larger groups and families seeking more space in Comines-Warneton.
Comines-Warneton Vacation Rental Guest Capacity Trends (2026)
Distribution of Listings by Guest Capacity
Guest Capacity Insights for Comines-Warneton
- The most common guest capacity trend in Comines-Warneton vacation rentals is listings accommodating 8+ guests (50%). This suggests the primary traveler segment is likely larger groups.
- Properties designed for 8+ guests and 4 guests dominate the Comines-Warneton STR market, accounting for 66.7% of listings.
- 60.4% of properties accommodate 6+ guests, serving the market segment for larger families or group travel in Comines-Warneton.
- On average, properties in Comines-Warneton are equipped to host 5.9 guests.
Comines-Warneton Airbnb Booking Patterns (2026): Available vs. Booked Days
Available Days Distribution
Booked Days Distribution
Booking Pattern Insights for Comines-Warneton
- The most common availability pattern in Comines-Warneton falls within the 181-270 days range, representing 47.9% of listings. This suggests many properties have significant open periods on their calendars.
- Approximately 87.5% of listings show high availability (181+ days open annually), indicating potential for increased bookings or specific owner usage patterns.
- For booked days, the 91-180 days range is most frequent in Comines-Warneton (52.1%), reflecting common guest stay durations or potential owner blocking patterns.
- A notable 12.5% of properties secure long booking periods (181+ days booked per year), highlighting successful long-term rental strategies or significant owner usage.
Comines-Warneton Airbnb Minimum Stay Requirements Analysis
Distribution of Listings by Minimum Night Requirement
1 Night
13 listings
27.1% of total
2 Nights
6 listings
12.5% of total
3 Nights
1 listings
2.1% of total
4-6 Nights
2 listings
4.2% of total
7-29 Nights
17 listings
35.4% of total
30+ Nights
9 listings
18.8% of total
Key Insights
- The most prevalent minimum stay requirement in Comines-Warneton is 7-29 Nights, adopted by 35.4% of listings. This highlights the market's preference for shorter, flexible bookings.
- A significant segment (18.8%) caters to monthly stays (30+ nights) in Comines-Warneton, pointing to opportunities in the extended-stay market.
Recommendations
- Align with the market by considering a 7-29 Nights minimum stay, as 35.4% of Comines-Warneton hosts use this setting.
- If feasible, allowing 1-night stays, especially midweek or during low season, could capture last-minute bookings, as only 27.1% currently do.
- Explore offering discounts for stays of 30+ nights to attract the 18.8% of the market seeking extended stays.
- Adjust minimum nights based on seasonality – potentially shorter during low season and longer during peak demand periods in Comines-Warneton.
Comines-Warneton Airbnb Cancellation Policy Trends Analysis (2026)
Super Strict 60 Days
2 listings
4.2% of total
Super Strict 30 Days
1 listings
2.1% of total
Flexible
14 listings
29.2% of total
Moderate
9 listings
18.8% of total
Firm
20 listings
41.7% of total
Strict
2 listings
4.2% of total
Cancellation Policy Insights for Comines-Warneton
- The prevailing Airbnb cancellation policy trend in Comines-Warneton is Firm, used by 41.7% of listings.
- There's a relatively balanced mix between guest-friendly (48.0%) and stricter (45.9%) policies, offering choices for different guest needs.
- Strict cancellation policies are quite rare (4.2%), potentially making listings with this policy less competitive unless justified by high demand or property type.
Recommendations for Hosts
- Consider adopting a Firm policy to align with the 41.7% market standard in Comines-Warneton.
- Using a Strict policy might deter some guests, as only 4.2% of listings use it. Evaluate if potential revenue protection outweighs possible lower booking rates.
- Regularly review your cancellation policy against competitors and market demand shifts in Comines-Warneton.
Comines-Warneton STR Booking Lead Time Analysis (2026)
Average Booking Lead Time by Month
Booking Lead Time Insights for Comines-Warneton
- The overall average booking lead time for vacation rentals in Comines-Warneton is 50 days.
- Guests book furthest in advance for stays during August (average 79 days), likely coinciding with peak travel demand or local events.
- The shortest booking windows occur for stays in March (average 30 days), indicating more last-minute travel plans during this time.
- Seasonally, Fall (72 days avg.) sees the longest lead times, while Spring (53 days avg.) has the shortest, reflecting typical travel planning cycles.
Recommendations for Hosts
- Use the overall average lead time (50 days) as a baseline for your pricing and availability strategy in Comines-Warneton.
- For August stays, consider implementing length-of-stay discounts or slightly higher rates for bookings made less than 79 days out to capitalize on advance planning.
- Target marketing efforts for the Fall season well in advance (at least 72 days) to capture early planners.
- Monitor your own booking lead times against these Comines-Warneton averages to identify opportunities for dynamic pricing adjustments.
Popular & Essential Airbnb Amenities in Comines-Warneton (2026)
Amenity Prevalence
Amenity Insights for Comines-Warneton
- Essential amenities in Comines-Warneton that guests expect include: Wifi, TV. Lacking these (any) could significantly impact bookings.
- Popular amenities like Kitchen, Free parking on premises, Heating are common but not universal. Offering these can provide a competitive edge.
Recommendations for Hosts
- Ensure your listing includes all essential amenities for Comines-Warneton: Wifi, TV.
- Prioritize adding missing essentials: Wifi, TV.
- Consider adding popular differentiators like Kitchen or Free parking on premises to increase appeal.
- Highlight unique or less common amenities you offer (e.g., hot tub, dedicated workspace, EV charger) in your listing description and photos.
- Regularly check competitor amenities in Comines-Warneton to stay competitive.
Comines-Warneton Airbnb Guest Demographics & Profile Analysis (2026)
Guest Profile Summary for Comines-Warneton
- The typical guest profile for Airbnb in Comines-Warneton consists of predominantly international visitors (79%), with top international origins including Belgium, typically belonging to the Post-2000s (Gen Z/Alpha) group (50%), primarily speaking English or French.
- Domestic travelers account for 20.8% of guests.
- Key international markets include France (46.4%) and Belgium (20.8%).
- Top languages spoken are English (36.2%) followed by French (32.9%).
- A significant demographic segment is the Post-2000s (Gen Z/Alpha) group, representing 50% of guests.
Recommendations for Hosts
- Focus marketing internationally, particularly towards travelers from Belgium.
- Tailor amenities and listing descriptions to appeal to the dominant Post-2000s (Gen Z/Alpha) demographic (e.g., highlight fast WiFi, smart home features, local guides).
- Highlight unique local experiences or amenities relevant to the primary guest profile.
- Consider seasonal promotions aligned with peak travel times for key origin markets.
Nearby Short-Term Rental Market Comparison
How does the Comines-Warneton Airbnb market stack up against its neighbors? Compare key performance metrics like average monthly revenue, ADR, and occupancy rates in surrounding areas to understand the broader regional STR landscape.
| Market | Active Properties | Monthly Revenue | Daily Rate | Avg. Occupancy |
|---|---|---|---|---|
| Lo-Reninge | 13 | $5,989 | $454.03 | 42% |
| Mont-de-l'Enclus | 10 | $5,398 | $407.81 | 36% |
| Zerkegem | 10 | $4,846 | $437.72 | 57% |
| Anzegem | 10 | $4,425 | $460.61 | 35% |
| Dizy | 11 | $4,106 | $250.48 | 49% |
| Ronse - Renaix | 18 | $3,878 | $411.21 | 35% |
| Ellezelles | 15 | $3,752 | $277.86 | 44% |
| Rosoy-en-Multien | 15 | $3,680 | $347.93 | 47% |
| Kluisbergen | 19 | $3,524 | $394.17 | 36% |
| Beernem | 25 | $3,515 | $313.01 | 41% |