Lille Airbnb Market Analysis 2026: Short Term Rental Data & Vacation Rental Statistics in Antwerp, Belgium
Is Airbnb profitable in Lille in 2026? Explore comprehensive Airbnb analytics for Lille, Antwerp, Belgium to uncover income potential. This 2026 STR market report for Lille, based on AirROI data from February 2025 to January 2026, reveals key trends in the niche market of 30 active listings.
Whether you're considering an Airbnb investment in Lille, optimizing your existing vacation rental, or exploring rental arbitrage opportunities, understanding the Lille Airbnb data is crucial. Leveraging the low regulation environment is key to maximizing your short term rental income potential. Let's dive into the specifics.
Key Lille Airbnb Performance Metrics Overview
Monthly Airbnb Revenue Variations & Income Potential in Lille (2026)
Understanding the monthly revenue variations for Airbnb listings in Lille is key to maximizing your short term rental income potential. Seasonality significantly impacts earnings. Our analysis, based on data from the past 12 months, shows that the peak revenue month for STRs in Lille is typically August, while January often presents the lowest earnings, highlighting opportunities for strategic pricing adjustments during shoulder and low seasons. Explore the typical Airbnb income in Lille across different performance tiers:
- Best-in-class properties (Top 10%) achieve $3,212+ monthly, often utilizing dynamic pricing and superior guest experiences.
- Strong performing properties (Top 25%) earn $2,311 or more, indicating effective management and desirable locations/amenities.
- Typical properties (Median) generate around $1,290 per month, representing the average market performance.
- Entry-level properties (Bottom 25%) see earnings around $728, often with potential for optimization.
Average Monthly Airbnb Earnings Trend in Lille
Lille Airbnb Occupancy Rate Trends (2026)
Maximize your bookings by understanding the Lille STR occupancy trends. Seasonal demand shifts significantly influence how often properties are booked. Typically, Februarysees the highest demand (peak season occupancy), while November experiences the lowest (low season). Effective strategies, like adjusting minimum stays or offering promotions, can boost occupancy during slower periods. Here's how different property tiers perform in Lille:
- Best-in-class properties (Top 10%) achieve 72%+ occupancy, indicating high desirability and potentially optimized availability.
- Strong performing properties (Top 25%) maintain 57% or higher occupancy, suggesting good market fit and guest satisfaction.
- Typical properties (Median) have an occupancy rate around 33%.
- Entry-level properties (Bottom 25%) average 19% occupancy, potentially facing higher vacancy.
Average Monthly Occupancy Rate Trend in Lille
Average Daily Rate (ADR) Airbnb Trends in Lille (2026)
Effective short term rental pricing strategy in Lille involves understanding monthly ADR fluctuations. The Average Daily Rate (ADR) for Airbnb in Lille typically peaks in October and dips lowest during March. Leveraging Airbnb dynamic pricing tools or strategies based on this seasonality can significantly boost revenue. Here's a look at the typical nightly rates achieved:
- Best-in-class properties (Top 10%) command rates of $196+ per night, often due to premium features or locations.
- Strong performing properties (Top 25%) achieve nightly rates of $158 or more.
- Typical properties (Median) charge around $127 per night.
- Entry-level properties (Bottom 25%) earn around $112 per night.
Average Daily Rate (ADR) Trend by Month in Lille
Get Live Lille Market Intelligence 👇

Explore Real-time Analytics
Airbnb Seasonality Analysis & Trends in Lille (2026)
Peak Season (August, September, October)
- Revenue averages $2,081 per month
- Occupancy rates average 45.4%
- Daily rates average $145
Shoulder Season
- Revenue averages $1,665 per month
- Occupancy maintains around 40.2%
- Daily rates hold near $134
Low Season (January, May, November)
- Revenue drops to average $1,249 per month
- Occupancy decreases to average 28.4%
- Daily rates adjust to average $144
Seasonality Insights for Lille
- The Airbnb seasonality in Lille shows moderate seasonality with distinct peak and low periods. While the sections above show seasonal averages, it's also insightful to look at the extremes:
- During the high season, the absolute peak month showcases Lille's highest earning potential, with monthly revenues capable of climbing to $2,257, occupancy reaching a high of 51.9%, and ADRs peaking at $151.
- Conversely, the slowest single month of the year, typically falling within the low season, marks the market's lowest point. In this month, revenue might dip to $1,158, occupancy could drop to 27.0%, and ADRs may adjust down to $125.
- Understanding both the seasonal averages and these monthly peaks and troughs in revenue, occupancy, and ADR is crucial for maximizing your Airbnb profit potential in Lille.
Seasonal Strategies for Maximizing Profit
- Peak Season: Maximize revenue through premium pricing and potentially longer minimum stays. Ensure high availability.
- Low Season: Offer competitive pricing, special promotions (e.g., extended stay discounts), and flexible cancellation policies. Target off-season travelers like remote workers or budget-conscious guests.
- Shoulder Seasons: Implement dynamic pricing that balances peak and low rates. Target weekend travelers or specific events. Offer slightly more flexible terms than peak season.
- Regularly analyze your own performance against these Lille seasonality benchmarks and adjust your pricing and availability strategy accordingly.
Best Areas for Airbnb Investment in Lille (2026)
Exploring the top neighborhoods for short-term rentals in Lille? This section highlights key areas, outlining why they are attractive for hosts and guests, along with notable local attractions. Consider these locations based on your target guest profile and investment strategy.
| Neighborhood / Area | Why Host Here? (Target Guests & Appeal) | Key Attractions & Landmarks |
|---|---|---|
| Vieux Lille | Historic district with charming cobblestone streets, vibrant cafes, and boutiques. It attracts tourists looking for a cultural experience and is close to major attractions. | Place du Général de Gaulle, Palais des Beaux-Arts, Lille Cathedral, Vieille Bourse, Kennedy Park |
| Lille Centre | The heart of Lille, bustling with activity and shopping, making it an ideal location for travelers wanting to explore the city. Offers a mix of old and new charm. | Galeries Lafayette, Euralille Shopping Centre, Train Station Lille Europe, The Grand Place, Lille's Opera House |
| Wazemmes | Known for its lively market and multicultural atmosphere, Wazemmes attracts visitors who enjoy local flavors and an authentic experience of Lille. | Wazemmes Market, Lille's Church of St. Peter and St. Paul, Street art, Cafes and local eateries, Lille's Botanical Garden |
| Euralille | Modern business district that is well connected and offers a mixture of business and leisure options. Suitable for business travelers and tourists alike. | Euralille Shopping Centre, Lille Europe Station, Musee de l'Hospice Comtesse, La Poste, Modern architecture |
| Antwerp City Centre | Vibrant hub of fashion, arts, and history, with stunning architecture and a rich cultural scene. A popular choice for short-term visitors. | Antwerp Cathedral, Grote Markt, Royal Museum of Fine Arts Antwerp, Museum aan de Stroom (MAS), ZOO Antwerpen |
| Zurenborg | Famous for its beautiful 19th-century architecture and tranquil atmosphere. Ideal for those looking for a unique stay in a peaceful neighborhood. | Cogels-Osylei, Zurenborg Park, Local cafes, Art nouveau architecture, Queen Astrid Park |
| Meir | The main shopping street in Antwerp, bustling with local shops and international brands. Perfect for travelers looking to indulge in shopping and local dining. | Meir Shopping Street, Stadsfeestzaal, Antwerp Diamond District, Culture and entertainment options, Historical architecture |
| Sint Andries | A charming district known for its unique boutiques, art studios, and exceptional dining. Great for those looking to explore local culture away from the tourist crowds. | Art galleries, Dining spots, Quiet streets, Local markets, Unique shops |
Understanding Airbnb License Requirements & STR Laws in Lille (2026)
While Lille, Antwerp, Belgium currently shows low STR regulations, specific Airbnb license requirements might still exist or change. Always verify the latest short term rental regulations and Airbnb license requirements directly with local government authorities for Lille to ensure full compliance before hosting.
(Source: AirROI data, 2026, finding no licensed listings among those analyzed)
Top Performing Airbnb Properties in Lille (2026)
Benchmark your potential! Explore examples of top-performing Airbnb properties in Lillebased on Trailing Twelve Month (TTM) revenue. Analyze their characteristics, revenue, occupancy rate, and ADR to understand what drives success in this market.
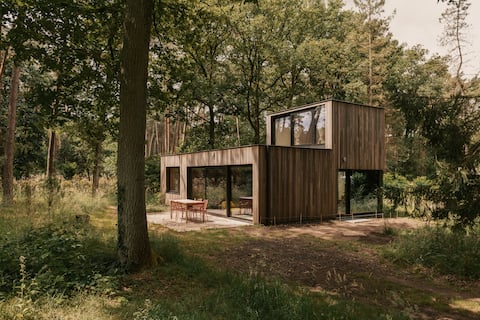
Gierle nature house
Entire Place • 2 bedrooms

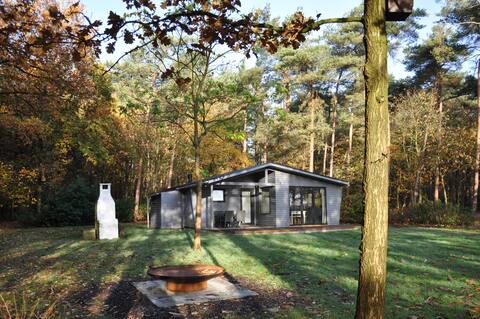
Lillehouse in large nature reserve with hot tub
Entire Place • 2 bedrooms

Osbos Chalets
Entire Place • 3 bedrooms
Tiny cottage
Entire Place • 1 bedroom

Welcome
Entire Place • 2 bedrooms

Rooyen : Cozy chalet with enclosed garden
Entire Place • 1 bedroom
Note: Performance varies based on location, size, amenities, seasonality, and management quality. Data reflects the past 12 months.
Top Performing Airbnb Hosts in Lille (2026)
Learn from the best! This table showcases top-performing Airbnb hosts in Lille based on the number of properties managed and estimated total revenue over the past year. Analyze their scale and performance metrics.
| Host Name | Properties | Grossing Revenue | Stay Reviews | Avg Rating |
|---|---|---|---|---|
| Ellen | 1 | $61,967 | 22 | 5.00/5.0 |
| Camping | 10 | $59,545 | 101 | 4.42/5.0 |
| Stijn | 1 | $38,151 | 107 | 4.84/5.0 |
| Dries | 1 | $33,286 | 74 | 4.85/5.0 |
| Peter | 1 | $33,271 | 190 | 4.96/5.0 |
| Katrin | 1 | $26,291 | 223 | 4.97/5.0 |
| Carine | 1 | $24,627 | 360 | 4.86/5.0 |
| Stefanie | 3 | $23,638 | 5 | Not Rated |
| Anouk - BELVILLA | 2 | $20,643 | 49 | 4.85/5.0 |
| Adrienne | 2 | $15,815 | 49 | 4.96/5.0 |
Analyzing the strategies of top hosts, such as their property selection, pricing, and guest communication, can offer valuable lessons for optimizing your own Airbnb operations in Lille.
Dive Deeper: Advanced Lille STR Market Data (2026)
Ready to unlock more insights? AirROI provides access to advanced metrics and comprehensive Airbnb data for Lille. Explore detailed analytics beyond this report to refine your investment strategy, optimize pricing, and maximize your vacation rental profits.
Explore Advanced MetricsLille Short-Term Rental Market Composition (2026): Property & Room Types
Room Type Distribution
Property Type Distribution
Market Composition Insights for Lille
- The Lille Airbnb market composition is heavily skewed towards Entire Home/Apt listings, which make up 86.7% of the 30 active rentals. This indicates strong guest preference for privacy and space.
- Looking at the property type distribution in Lille, Hotel/Boutique properties are the most common (43.3%), reflecting the local real estate landscape.
- Houses represent a significant 26.7% portion, catering likely to families or larger groups.
- The presence of 43.3% Hotel/Boutique listings indicates integration with traditional hospitality.
- Smaller segments like apartment/condo (combined 3.3%) offer potential for unique stay experiences.
Lille Airbnb Room Capacity Analysis (2026): Bedroom Distribution
Distribution of Listings by Number of Bedrooms
Room Capacity Insights for Lille
- The dominant room capacity in Lille is 2 bedrooms listings, making up 33.3% of the market. This suggests a strong demand for properties suitable for couples or solo travelers.
- Together, 2 bedrooms and 1 bedroom properties represent 63.3% of the active Airbnb listings in Lille, indicating a high concentration in these sizes.
- A significant 23.3% of listings offer 3+ bedrooms, catering to larger groups and families seeking more space in Lille.
Lille Vacation Rental Guest Capacity Trends (2026)
Distribution of Listings by Guest Capacity
Guest Capacity Insights for Lille
- The most common guest capacity trend in Lille vacation rentals is listings accommodating 4 guests (56.7%). This suggests the primary traveler segment is likely small families or groups.
- Properties designed for 4 guests and 6 guests dominate the Lille STR market, accounting for 73.4% of listings.
- 16.7% of properties accommodate 6+ guests, serving the market segment for larger families or group travel in Lille.
- On average, properties in Lille are equipped to host 3.7 guests.
Lille Airbnb Booking Patterns (2026): Available vs. Booked Days
Available Days Distribution
Booked Days Distribution
Booking Pattern Insights for Lille
- The most common availability pattern in Lille falls within the 271-366 days range, representing 70% of listings. This suggests many properties have significant open periods on their calendars.
- Approximately 80.0% of listings show high availability (181+ days open annually), indicating potential for increased bookings or specific owner usage patterns.
- For booked days, the 31-90 days range is most frequent in Lille (56.7%), reflecting common guest stay durations or potential owner blocking patterns.
- A notable 23.3% of properties secure long booking periods (181+ days booked per year), highlighting successful long-term rental strategies or significant owner usage.
Lille Airbnb Minimum Stay Requirements Analysis
Distribution of Listings by Minimum Night Requirement
1 Night
7 listings
23.3% of total
2 Nights
15 listings
50% of total
4-6 Nights
1 listings
3.3% of total
30+ Nights
7 listings
23.3% of total
Key Insights
- The most prevalent minimum stay requirement in Lille is 2 Nights, adopted by 50% of listings. This highlights the market's preference for shorter, flexible bookings.
- A strong majority (73.3%) of the Lille Airbnb data shows acceptance of very short stays (1-2 nights), indicating a dynamic, high-turnover market.
- A significant segment (23.3%) caters to monthly stays (30+ nights) in Lille, pointing to opportunities in the extended-stay market.
Recommendations
- Align with the market by considering a 2 Nights minimum stay, as 50% of Lille hosts use this setting.
- If feasible, allowing 1-night stays, especially midweek or during low season, could capture last-minute bookings, as only 23.3% currently do.
- Explore offering discounts for stays of 30+ nights to attract the 23.3% of the market seeking extended stays.
- Adjust minimum nights based on seasonality – potentially shorter during low season and longer during peak demand periods in Lille.
Lille Airbnb Cancellation Policy Trends Analysis (2026)
Super Strict 30 Days
1 listings
3.3% of total
Flexible
15 listings
50% of total
Moderate
8 listings
26.7% of total
Firm
4 listings
13.3% of total
Strict
2 listings
6.7% of total
Cancellation Policy Insights for Lille
- The prevailing Airbnb cancellation policy trend in Lille is Flexible, used by 50% of listings.
- The market strongly favors guest-friendly terms, with 76.7% of listings offering Flexible or Moderate policies. This suggests guests in Lille may expect booking flexibility.
- Strict cancellation policies are quite rare (6.7%), potentially making listings with this policy less competitive unless justified by high demand or property type.
Recommendations for Hosts
- Consider adopting a Flexible policy to align with the 50% market standard in Lille.
- Using a Strict policy might deter some guests, as only 6.7% of listings use it. Evaluate if potential revenue protection outweighs possible lower booking rates.
- Regularly review your cancellation policy against competitors and market demand shifts in Lille.
Lille STR Booking Lead Time Analysis (2026)
Average Booking Lead Time by Month
Booking Lead Time Insights for Lille
- The overall average booking lead time for vacation rentals in Lille is 75 days.
- Guests book furthest in advance for stays during July (average 105 days), likely coinciding with peak travel demand or local events.
- The shortest booking windows occur for stays in January (average 36 days), indicating more last-minute travel plans during this time.
- Seasonally, Summer (91 days avg.) sees the longest lead times, while Fall (56 days avg.) has the shortest, reflecting typical travel planning cycles.
Recommendations for Hosts
- Use the overall average lead time (75 days) as a baseline for your pricing and availability strategy in Lille.
- For July stays, consider implementing length-of-stay discounts or slightly higher rates for bookings made less than 105 days out to capitalize on advance planning.
- Target marketing efforts for the Summer season well in advance (at least 91 days) to capture early planners.
- Monitor your own booking lead times against these Lille averages to identify opportunities for dynamic pricing adjustments.
Popular & Essential Airbnb Amenities in Lille (2026)
Amenity Prevalence
Amenity Insights for Lille
- Popular amenities like Wifi, Kitchen, TV are common but not universal. Offering these can provide a competitive edge.
- Warning: Wifi is not universally provided but is considered essential globally. Ensure reliable Wifi is offered.
Recommendations for Hosts
- Consider adding popular differentiators like Wifi or Kitchen to increase appeal.
- Highlight unique or less common amenities you offer (e.g., hot tub, dedicated workspace, EV charger) in your listing description and photos.
- Regularly check competitor amenities in Lille to stay competitive.
Lille Airbnb Guest Demographics & Profile Analysis (2026)
Guest Profile Summary for Lille
- The typical guest profile for Airbnb in Lille consists of predominantly international visitors (71%), with top international origins including Belgium, typically belonging to the Post-2000s (Gen Z/Alpha) group (50%), primarily speaking English or Dutch.
- Domestic travelers account for 29.4% of guests.
- Key international markets include Netherlands (33.1%) and Belgium (29.4%).
- Top languages spoken are English (35.5%) followed by Dutch (20.7%).
- A significant demographic segment is the Post-2000s (Gen Z/Alpha) group, representing 50% of guests.
Recommendations for Hosts
- Focus marketing internationally, particularly towards travelers from Belgium.
- Tailor amenities and listing descriptions to appeal to the dominant Post-2000s (Gen Z/Alpha) demographic (e.g., highlight fast WiFi, smart home features, local guides).
- Highlight unique local experiences or amenities relevant to the primary guest profile.
- Consider seasonal promotions aligned with peak travel times for key origin markets.
Nearby Short-Term Rental Market Comparison
How does the Lille Airbnb market stack up against its neighbors? Compare key performance metrics like average monthly revenue, ADR, and occupancy rates in surrounding areas to understand the broader regional STR landscape.
| Market | Active Properties | Monthly Revenue | Daily Rate | Avg. Occupancy |
|---|---|---|---|---|
| Raamsdonksveer | 16 | $7,756 | $736.17 | 38% |
| Kockengen | 11 | $6,027 | $485.77 | 53% |
| Haghorst | 11 | $5,995 | $480.40 | 40% |
| Mont-de-l'Enclus | 10 | $5,398 | $407.81 | 36% |
| Merksplas | 12 | $5,367 | $356.64 | 43% |
| Zerkegem | 10 | $4,846 | $437.71 | 57% |
| Bentveld | 15 | $4,727 | $517.02 | 50% |
| Anzegem | 10 | $4,425 | $460.61 | 35% |
| Incourt | 13 | $4,412 | $303.48 | 52% |
| Wellin | 12 | $4,365 | $446.64 | 42% |