Bornem Airbnb Market Analysis 2026: Short Term Rental Data & Vacation Rental Statistics in Antwerp, Belgium
Is Airbnb profitable in Bornem in 2026? Explore comprehensive Airbnb analytics for Bornem, Antwerp, Belgium to uncover income potential. This 2026 STR market report for Bornem, based on AirROI data from February 2025 to January 2026, reveals key trends in the niche market of 21 active listings.
Whether you're considering an Airbnb investment in Bornem, optimizing your existing vacation rental, or exploring rental arbitrage opportunities, understanding the Bornem Airbnb data is crucial. Leveraging the low regulation environment is key to maximizing your short term rental income potential. Let's dive into the specifics.
Key Bornem Airbnb Performance Metrics Overview
Monthly Airbnb Revenue Variations & Income Potential in Bornem (2026)
Understanding the monthly revenue variations for Airbnb listings in Bornem is key to maximizing your short term rental income potential. Seasonality significantly impacts earnings. Our analysis, based on data from the past 12 months, shows that the peak revenue month for STRs in Bornem is typically July, while February often presents the lowest earnings, highlighting opportunities for strategic pricing adjustments during shoulder and low seasons. Explore the typical Airbnb income in Bornem across different performance tiers:
- Best-in-class properties (Top 10%) achieve $4,272+ monthly, often utilizing dynamic pricing and superior guest experiences.
- Strong performing properties (Top 25%) earn $2,598 or more, indicating effective management and desirable locations/amenities.
- Typical properties (Median) generate around $1,113 per month, representing the average market performance.
- Entry-level properties (Bottom 25%) see earnings around $702, often with potential for optimization.
Average Monthly Airbnb Earnings Trend in Bornem
Bornem Airbnb Occupancy Rate Trends (2026)
Maximize your bookings by understanding the Bornem STR occupancy trends. Seasonal demand shifts significantly influence how often properties are booked. Typically, Augustsees the highest demand (peak season occupancy), while January experiences the lowest (low season). Effective strategies, like adjusting minimum stays or offering promotions, can boost occupancy during slower periods. Here's how different property tiers perform in Bornem:
- Best-in-class properties (Top 10%) achieve 82%+ occupancy, indicating high desirability and potentially optimized availability.
- Strong performing properties (Top 25%) maintain 66% or higher occupancy, suggesting good market fit and guest satisfaction.
- Typical properties (Median) have an occupancy rate around 39%.
- Entry-level properties (Bottom 25%) average 26% occupancy, potentially facing higher vacancy.
Average Monthly Occupancy Rate Trend in Bornem
Average Daily Rate (ADR) Airbnb Trends in Bornem (2026)
Effective short term rental pricing strategy in Bornem involves understanding monthly ADR fluctuations. The Average Daily Rate (ADR) for Airbnb in Bornem typically peaks in July and dips lowest during January. Leveraging Airbnb dynamic pricing tools or strategies based on this seasonality can significantly boost revenue. Here's a look at the typical nightly rates achieved:
- Best-in-class properties (Top 10%) command rates of $288+ per night, often due to premium features or locations.
- Strong performing properties (Top 25%) achieve nightly rates of $148 or more.
- Typical properties (Median) charge around $102 per night.
- Entry-level properties (Bottom 25%) earn around $69 per night.
Average Daily Rate (ADR) Trend by Month in Bornem
Get Live Bornem Market Intelligence 👇

Explore Real-time Analytics
Airbnb Seasonality Analysis & Trends in Bornem (2026)
Peak Season (July, December, October)
- Revenue averages $2,335 per month
- Occupancy rates average 46.7%
- Daily rates average $174
Shoulder Season
- Revenue averages $1,945 per month
- Occupancy maintains around 47.6%
- Daily rates hold near $173
Low Season (January, February, March)
- Revenue drops to average $1,451 per month
- Occupancy decreases to average 39.3%
- Daily rates adjust to average $165
Seasonality Insights for Bornem
- The Airbnb seasonality in Bornem shows moderate seasonality with distinct peak and low periods. While the sections above show seasonal averages, it's also insightful to look at the extremes:
- During the high season, the absolute peak month showcases Bornem's highest earning potential, with monthly revenues capable of climbing to $2,396, occupancy reaching a high of 59.7%, and ADRs peaking at $188.
- Conversely, the slowest single month of the year, typically falling within the low season, marks the market's lowest point. In this month, revenue might dip to $1,317, occupancy could drop to 34.0%, and ADRs may adjust down to $163.
- Understanding both the seasonal averages and these monthly peaks and troughs in revenue, occupancy, and ADR is crucial for maximizing your Airbnb profit potential in Bornem.
Seasonal Strategies for Maximizing Profit
- Peak Season: Maximize revenue through premium pricing and potentially longer minimum stays. Ensure high availability.
- Low Season: Offer competitive pricing, special promotions (e.g., extended stay discounts), and flexible cancellation policies. Target off-season travelers like remote workers or budget-conscious guests.
- Shoulder Seasons: Implement dynamic pricing that balances peak and low rates. Target weekend travelers or specific events. Offer slightly more flexible terms than peak season.
- Regularly analyze your own performance against these Bornem seasonality benchmarks and adjust your pricing and availability strategy accordingly.
Best Areas for Airbnb Investment in Bornem (2026)
Exploring the top neighborhoods for short-term rentals in Bornem? This section highlights key areas, outlining why they are attractive for hosts and guests, along with notable local attractions. Consider these locations based on your target guest profile and investment strategy.
| Neighborhood / Area | Why Host Here? (Target Guests & Appeal) | Key Attractions & Landmarks |
|---|---|---|
| City Center | The vibrant heart of Bornem with historic architecture and local shops. Perfect for tourists looking to explore the culture and history of the area. | Bornem Castle, The church of St. Bernardus, Local bakeries and cafes, Parks and recreational areas, Local markets |
| Park area | A tranquil area surrounded by parks, ideal for families and nature lovers. Attracts guests looking for relaxation and outdoor activities. | Parks for picnicking, Nature trails, Cycling paths, Playgrounds, Community gardens |
| Old Town | Historical section with charming streets and traditional Belgian houses. Attracts tourists interested in architecture and local history. | Historic buildings, Local restaurants, Artisan shops, Guided tours, Heritage events |
| Nearby Sports Complex | Attracts sports fans and families attending events. A great location for short-term rentals during tournaments or sports meets. | Sports events, Fitness facilities, Family-friendly activities, Food and beverage options, Community events |
| River Front | Scenic area by the river offering beautiful views and walking paths. Popular with couples and visitors looking for a romantic getaway. | River walks, Boating activities, Fishing spots, Scenic picnic areas, Local dining with river views |
| Cultural District | Home to many cultural activities, such as arts and music festivals. Great for tourists wanting to immerse themselves in local culture. | Music events, Art exhibitions, Cultural festivals, Local theaters, Workshops and classes |
| Commercial District | Ideal for business travelers due to proximity to offices and amenities. Attracts professionals and those visiting for work purposes. | Business centers, Conference venues, Restaurants and cafes, Shopping options, Transport facilities |
| Educational Hub | Close to schools and educational institutions. Suitable for families and students visiting for educational purposes. | Local schools, Educational events, Libraries, Student activities, Cafes popular with students |
Understanding Airbnb License Requirements & STR Laws in Bornem (2026)
While Bornem, Antwerp, Belgium currently shows low STR regulations, specific Airbnb license requirements might still exist or change. Always verify the latest short term rental regulations and Airbnb license requirements directly with local government authorities for Bornem to ensure full compliance before hosting.
(Source: AirROI data, 2026, based on 5% licensed listings)
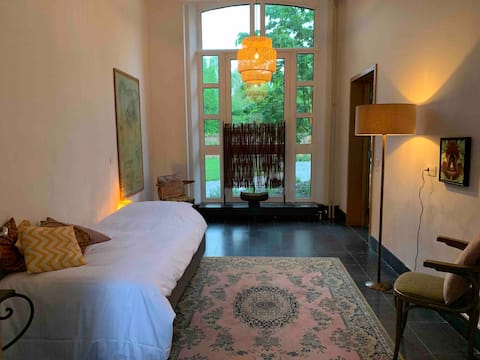
Top Performing Airbnb Properties in Bornem (2026)
Benchmark your potential! Explore examples of top-performing Airbnb properties in Bornembased on Trailing Twelve Month (TTM) revenue. Analyze their characteristics, revenue, occupancy rate, and ADR to understand what drives success in this market.

de scheldepolder
Entire Place • 3 bedrooms

Cozy cottage with garden on the Schelde river
Entire Place • 2 bedrooms

A charming cottage between water and greenery
Entire Place • 2 bedrooms

Quiet apartment in the greenery on the Scheldt
Entire Place • 2 bedrooms
The Lotus Gate, retreat place in the Abbey of Bornem
Private Room • 6 bedrooms

Pond view
Entire Place • 2 bedrooms
Note: Performance varies based on location, size, amenities, seasonality, and management quality. Data reflects the past 12 months.
Top Performing Airbnb Hosts in Bornem (2026)
Learn from the best! This table showcases top-performing Airbnb hosts in Bornem based on the number of properties managed and estimated total revenue over the past year. Analyze their scale and performance metrics.
| Host Name | Properties | Grossing Revenue | Stay Reviews | Avg Rating |
|---|---|---|---|---|
| Hilde | 7 | $93,964 | 39 | 4.61/5.0 |
| Tim | 1 | $91,539 | 103 | 4.83/5.0 |
| Katja | 1 | $40,311 | 170 | 4.86/5.0 |
| Isabel | 1 | $38,064 | 128 | 4.89/5.0 |
| Ria | 1 | $30,687 | 94 | 4.99/5.0 |
| Filip | 1 | $19,134 | 27 | 4.93/5.0 |
| Bart | 1 | $18,942 | 61 | 4.89/5.0 |
| Fenna | 1 | $17,827 | 24 | 4.75/5.0 |
| Martine | 4 | $16,184 | 207 | 4.74/5.0 |
| Joke | 1 | $5,009 | 49 | 4.71/5.0 |
Analyzing the strategies of top hosts, such as their property selection, pricing, and guest communication, can offer valuable lessons for optimizing your own Airbnb operations in Bornem.
Dive Deeper: Advanced Bornem STR Market Data (2026)
Ready to unlock more insights? AirROI provides access to advanced metrics and comprehensive Airbnb data for Bornem. Explore detailed analytics beyond this report to refine your investment strategy, optimize pricing, and maximize your vacation rental profits.
Explore Advanced MetricsBornem Short-Term Rental Market Composition (2026): Property & Room Types
Room Type Distribution
Property Type Distribution
Market Composition Insights for Bornem
- The Bornem Airbnb market composition is heavily skewed towards Private Room listings, which make up 61.9% of the 21 active rentals. This indicates strong guest preference for privacy and space.
- Looking at the property type distribution in Bornem, House properties are the most common (47.6%), reflecting the local real estate landscape.
- Houses represent a significant 47.6% portion, catering likely to families or larger groups.
- The presence of 33.3% Hotel/Boutique listings indicates integration with traditional hospitality.
- Smaller segments like unique stays, others (combined 9.6%) offer potential for unique stay experiences.
Bornem Airbnb Room Capacity Analysis (2026): Bedroom Distribution
Distribution of Listings by Number of Bedrooms
Room Capacity Insights for Bornem
- The dominant room capacity in Bornem is 2 bedrooms listings, making up 33.3% of the market. This suggests a strong demand for properties suitable for couples or solo travelers.
- Together, 2 bedrooms and 1 bedroom properties represent 42.8% of the active Airbnb listings in Bornem, indicating a high concentration in these sizes.
- Listings with 3+ bedrooms (9.6%) represent a smaller niche, potentially indicating an underserved market for larger group accommodations in Bornem.
Bornem Vacation Rental Guest Capacity Trends (2026)
Distribution of Listings by Guest Capacity
Guest Capacity Insights for Bornem
- The most common guest capacity trend in Bornem vacation rentals is listings accommodating 4 guests (23.8%). This suggests the primary traveler segment is likely small families or groups.
- Properties designed for 4 guests and 2 guests dominate the Bornem STR market, accounting for 33.3% of listings.
- Listings for large groups (6+ guests) are relatively rare (4.8%), potentially indicating an opportunity for hosts targeting this segment in Bornem.
- On average, properties in Bornem are equipped to host 1.5 guests.
Bornem Airbnb Booking Patterns (2026): Available vs. Booked Days
Available Days Distribution
Booked Days Distribution
Booking Pattern Insights for Bornem
- The most common availability pattern in Bornem falls within the 271-366 days range, representing 38.1% of listings. This suggests many properties have significant open periods on their calendars.
- Approximately 71.4% of listings show high availability (181+ days open annually), indicating potential for increased bookings or specific owner usage patterns.
- For booked days, the 91-180 days range is most frequent in Bornem (33.3%), reflecting common guest stay durations or potential owner blocking patterns.
- A notable 28.6% of properties secure long booking periods (181+ days booked per year), highlighting successful long-term rental strategies or significant owner usage.
Bornem Airbnb Minimum Stay Requirements Analysis
Distribution of Listings by Minimum Night Requirement
1 Night
14 listings
66.7% of total
2 Nights
2 listings
9.5% of total
3 Nights
2 listings
9.5% of total
30+ Nights
3 listings
14.3% of total
Key Insights
- The most prevalent minimum stay requirement in Bornem is 1 Night, adopted by 66.7% of listings. This highlights the market's preference for shorter, flexible bookings.
- A strong majority (76.2%) of the Bornem Airbnb data shows acceptance of very short stays (1-2 nights), indicating a dynamic, high-turnover market.
- A significant segment (14.3%) caters to monthly stays (30+ nights) in Bornem, pointing to opportunities in the extended-stay market.
Recommendations
- Align with the market by considering a 1 Night minimum stay, as 66.7% of Bornem hosts use this setting.
- Explore offering discounts for stays of 30+ nights to attract the 14.3% of the market seeking extended stays.
- Adjust minimum nights based on seasonality – potentially shorter during low season and longer during peak demand periods in Bornem.
Bornem Airbnb Cancellation Policy Trends Analysis (2026)
Flexible
12 listings
57.1% of total
Moderate
7 listings
33.3% of total
Firm
2 listings
9.5% of total
Cancellation Policy Insights for Bornem
- The prevailing Airbnb cancellation policy trend in Bornem is Flexible, used by 57.1% of listings.
- The market strongly favors guest-friendly terms, with 90.4% of listings offering Flexible or Moderate policies. This suggests guests in Bornem may expect booking flexibility.
Recommendations for Hosts
- Consider adopting a Flexible policy to align with the 57.1% market standard in Bornem.
- Given the high prevalence of Flexible policies (57.1%), offering this can enhance booking appeal, especially during shoulder seasons.
- Regularly review your cancellation policy against competitors and market demand shifts in Bornem.
Bornem STR Booking Lead Time Analysis (2026)
Average Booking Lead Time by Month
Booking Lead Time Insights for Bornem
- The overall average booking lead time for vacation rentals in Bornem is 58 days.
- Guests book furthest in advance for stays during August (average 119 days), likely coinciding with peak travel demand or local events.
- The shortest booking windows occur for stays in February (average 29 days), indicating more last-minute travel plans during this time.
- Seasonally, Summer (96 days avg.) sees the longest lead times, while Winter (42 days avg.) has the shortest, reflecting typical travel planning cycles.
Recommendations for Hosts
- Use the overall average lead time (58 days) as a baseline for your pricing and availability strategy in Bornem.
- For August stays, consider implementing length-of-stay discounts or slightly higher rates for bookings made less than 119 days out to capitalize on advance planning.
- Target marketing efforts for the Summer season well in advance (at least 96 days) to capture early planners.
- Monitor your own booking lead times against these Bornem averages to identify opportunities for dynamic pricing adjustments.
Popular & Essential Airbnb Amenities in Bornem (2026)
Amenity Prevalence
Amenity Insights for Bornem
- Essential amenities in Bornem that guests expect include: Wifi, Smoke alarm, Free parking on premises. Lacking these (any) could significantly impact bookings.
- Popular amenities like Dedicated workspace, Outdoor dining area, Heating are common but not universal. Offering these can provide a competitive edge.
Recommendations for Hosts
- Ensure your listing includes all essential amenities for Bornem: Wifi, Smoke alarm, Free parking on premises.
- Prioritize adding missing essentials: Smoke alarm, Free parking on premises.
- Consider adding popular differentiators like Dedicated workspace or Outdoor dining area to increase appeal.
- Highlight unique or less common amenities you offer (e.g., hot tub, dedicated workspace, EV charger) in your listing description and photos.
- Regularly check competitor amenities in Bornem to stay competitive.
Bornem Airbnb Guest Demographics & Profile Analysis (2026)
Guest Profile Summary for Bornem
- The typical guest profile for Airbnb in Bornem consists of predominantly international visitors (77%), with top international origins including Belgium, typically belonging to the Post-2000s (Gen Z/Alpha) group (50%), primarily speaking English or French.
- Domestic travelers account for 22.9% of guests.
- Key international markets include Netherlands (25.5%) and Belgium (22.9%).
- Top languages spoken are English (35.4%) followed by French (19%).
- A significant demographic segment is the Post-2000s (Gen Z/Alpha) group, representing 50% of guests.
Recommendations for Hosts
- Focus marketing internationally, particularly towards travelers from Belgium.
- Tailor amenities and listing descriptions to appeal to the dominant Post-2000s (Gen Z/Alpha) demographic (e.g., highlight fast WiFi, smart home features, local guides).
- Highlight unique local experiences or amenities relevant to the primary guest profile.
- Consider seasonal promotions aligned with peak travel times for key origin markets.
Nearby Short-Term Rental Market Comparison
How does the Bornem Airbnb market stack up against its neighbors? Compare key performance metrics like average monthly revenue, ADR, and occupancy rates in surrounding areas to understand the broader regional STR landscape.
| Market | Active Properties | Monthly Revenue | Daily Rate | Avg. Occupancy |
|---|---|---|---|---|
| Raamsdonksveer | 16 | $7,756 | $736.17 | 38% |
| Kockengen | 11 | $6,027 | $485.77 | 53% |
| Haghorst | 11 | $5,995 | $480.40 | 40% |
| Mont-de-l'Enclus | 10 | $5,398 | $407.81 | 36% |
| Merksplas | 12 | $5,367 | $356.64 | 43% |
| Zerkegem | 10 | $4,846 | $437.72 | 57% |
| Bentveld | 15 | $4,727 | $517.02 | 50% |
| Anzegem | 10 | $4,425 | $460.61 | 35% |
| Incourt | 13 | $4,412 | $303.48 | 52% |
| Wellin | 12 | $4,365 | $446.64 | 42% |