Boom Airbnb Market Analysis 2026: Short Term Rental Data & Vacation Rental Statistics in Antwerp, Belgium
Is Airbnb profitable in Boom in 2026? Explore comprehensive Airbnb analytics for Boom, Antwerp, Belgium to uncover income potential. This 2026 STR market report for Boom, based on AirROI data from February 2025 to January 2026, reveals key trends in the niche market of 81 active listings.
Whether you're considering an Airbnb investment in Boom, optimizing your existing vacation rental, or exploring rental arbitrage opportunities, understanding the Boom Airbnb data is crucial. Leveraging the low regulation environment is key to maximizing your short term rental income potential. Let's dive into the specifics.
Key Boom Airbnb Performance Metrics Overview
Monthly Airbnb Revenue Variations & Income Potential in Boom (2026)
Understanding the monthly revenue variations for Airbnb listings in Boom is key to maximizing your short term rental income potential. Seasonality significantly impacts earnings. Our analysis, based on data from the past 12 months, shows that the peak revenue month for STRs in Boom is typically August, while February often presents the lowest earnings, highlighting opportunities for strategic pricing adjustments during shoulder and low seasons. Explore the typical Airbnb income in Boom across different performance tiers:
- Best-in-class properties (Top 10%) achieve $11,827+ monthly, often utilizing dynamic pricing and superior guest experiences.
- Strong performing properties (Top 25%) earn $6,025 or more, indicating effective management and desirable locations/amenities.
- Typical properties (Median) generate around $3,055 per month, representing the average market performance.
- Entry-level properties (Bottom 25%) see earnings around $1,211, often with potential for optimization.
Average Monthly Airbnb Earnings Trend in Boom
Boom Airbnb Occupancy Rate Trends (2026)
Maximize your bookings by understanding the Boom STR occupancy trends. Seasonal demand shifts significantly influence how often properties are booked. Typically, Augustsees the highest demand (peak season occupancy), while January experiences the lowest (low season). Effective strategies, like adjusting minimum stays or offering promotions, can boost occupancy during slower periods. Here's how different property tiers perform in Boom:
- Best-in-class properties (Top 10%) achieve 70%+ occupancy, indicating high desirability and potentially optimized availability.
- Strong performing properties (Top 25%) maintain 55% or higher occupancy, suggesting good market fit and guest satisfaction.
- Typical properties (Median) have an occupancy rate around 29%.
- Entry-level properties (Bottom 25%) average 13% occupancy, potentially facing higher vacancy.
Average Monthly Occupancy Rate Trend in Boom
Average Daily Rate (ADR) Airbnb Trends in Boom (2026)
Effective short term rental pricing strategy in Boom involves understanding monthly ADR fluctuations. The Average Daily Rate (ADR) for Airbnb in Boom typically peaks in January and dips lowest during February. Leveraging Airbnb dynamic pricing tools or strategies based on this seasonality can significantly boost revenue. Here's a look at the typical nightly rates achieved:
- Best-in-class properties (Top 10%) command rates of $1,496+ per night, often due to premium features or locations.
- Strong performing properties (Top 25%) achieve nightly rates of $1,104 or more.
- Typical properties (Median) charge around $568 per night.
- Entry-level properties (Bottom 25%) earn around $325 per night.
Average Daily Rate (ADR) Trend by Month in Boom
Get Live Boom Market Intelligence 👇
Explore Real-time Analytics
Airbnb Seasonality Analysis & Trends in Boom (2026)
Peak Season (August, July, June)
- Revenue averages $8,998 per month
- Occupancy rates average 47.7%
- Daily rates average $675
Shoulder Season
- Revenue averages $3,704 per month
- Occupancy maintains around 27.7%
- Daily rates hold near $776
Low Season (February, March, November)
- Revenue drops to average $2,121 per month
- Occupancy decreases to average 34.3%
- Daily rates adjust to average $712
Seasonality Insights for Boom
- The Airbnb seasonality in Boom shows highly seasonal trends requiring careful strategy. While the sections above show seasonal averages, it's also insightful to look at the extremes:
- During the high season, the absolute peak month showcases Boom's highest earning potential, with monthly revenues capable of climbing to $9,503, occupancy reaching a high of 50.7%, and ADRs peaking at $868.
- Conversely, the slowest single month of the year, typically falling within the low season, marks the market's lowest point. In this month, revenue might dip to $1,327, occupancy could drop to 21.1%, and ADRs may adjust down to $640.
- Understanding both the seasonal averages and these monthly peaks and troughs in revenue, occupancy, and ADR is crucial for maximizing your Airbnb profit potential in Boom.
Seasonal Strategies for Maximizing Profit
- Peak Season: Maximize revenue through premium pricing and potentially longer minimum stays. Ensure high availability.
- Low Season: Offer competitive pricing, special promotions (e.g., extended stay discounts), and flexible cancellation policies. Target off-season travelers like remote workers or budget-conscious guests.
- Shoulder Seasons: Implement dynamic pricing that balances peak and low rates. Target weekend travelers or specific events. Offer slightly more flexible terms than peak season.
- Regularly analyze your own performance against these Boom seasonality benchmarks and adjust your pricing and availability strategy accordingly.
Best Areas for Airbnb Investment in Boom (2026)
Exploring the top neighborhoods for short-term rentals in Boom? This section highlights key areas, outlining why they are attractive for hosts and guests, along with notable local attractions. Consider these locations based on your target guest profile and investment strategy.
| Neighborhood / Area | Why Host Here? (Target Guests & Appeal) | Key Attractions & Landmarks |
|---|---|---|
| Antwerp City Center | The bustling heart of Antwerp filled with historic architecture, shopping, and dining. A prime spot for tourists eager to explore famous landmarks and cultural attractions. | Cathedral of Our Lady, Grote Markt, Antwerp Zoo, Museum aan de Stroom (MAS), Meir shopping street |
| Zurenborg | A picturesque neighborhood known for its stunning architectural styles, particularly Art Nouveau. It's attracting visitors looking for a tranquil yet artistic vibe close to the city center. | Cogels-Osylei, Delaure Street, Charlottalei, Zurenborg district parks |
| Meir | Antwerp's main shopping street known for its high-end shops, bustling atmosphere, and accessibility. Ideal for short-term rentals catering to shopping enthusiasts and business travelers alike. | Meir shopping street, Diamond District, Stadsfeestzaal, Wapper Square |
| Het Eilandje | A trendy harbor district revitalized into a modern residential area with great eateries and scenic views of the water. This area attracts tourists seeking a vibrant maritime atmosphere. | Museum aan de Stroom (MAS), Red Star Line Museum, Het Eilandje harbor, Flanders Marine Institute |
| Borgerhout | A multicultural neighborhood known for its diverse community and dynamic street art scene. It's growing in popularity with travelers seeking authentic local experiences. | Bourlaschouwburg, De Roma, Various street artworks, Borgerhout district parks |
| South Antwerp | A diverse area popular with both locals and tourists, featuring parks, cafes, and unique shops. Great for visitors looking to explore the city from a residential perspective. | Antwerp Botanical Garden, Middelheim Park, Art installations in nature, Local boutiques |
| Kiel | An up-and-coming neighborhood near the city center that offers affordable rental options and a community feel. It's ideal for budget-conscious travelers exploring Antwerp. | Kiel Park, Local markets, Community events, Cafes and eateries |
| Sintandries | A charming and quiet neighborhood with a familial vibe, making it perfect for families and travelers seeking a serene environment close to city attractions. | St. Andrew's Church, Quiet parks, Local playgrounds, Community events |
Understanding Airbnb License Requirements & STR Laws in Boom (2026)
While Boom, Antwerp, Belgium currently shows low STR regulations, specific Airbnb license requirements might still exist or change. Always verify the latest short term rental regulations and Airbnb license requirements directly with local government authorities for Boom to ensure full compliance before hosting.
(Source: AirROI data, 2026, finding no licensed listings among those analyzed)
Top Performing Airbnb Properties in Boom (2026)
Benchmark your potential! Explore examples of top-performing Airbnb properties in Boombased on Trailing Twelve Month (TTM) revenue. Analyze their characteristics, revenue, occupancy rate, and ADR to understand what drives success in this market.
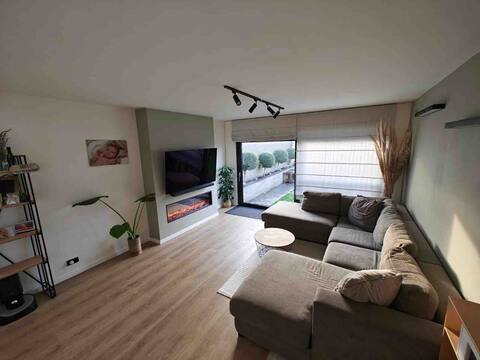
Beautiful house with air conditioning (close to TML)
Entire Place • 2 bedrooms

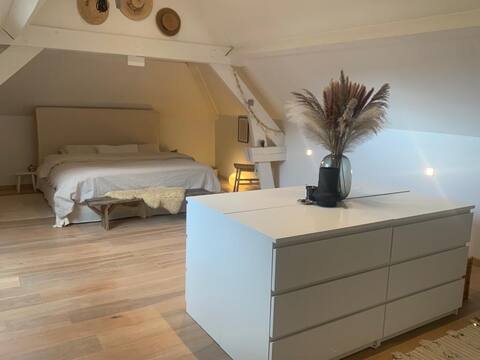
Recently renovated bell floor.
Entire Place • 4 bedrooms
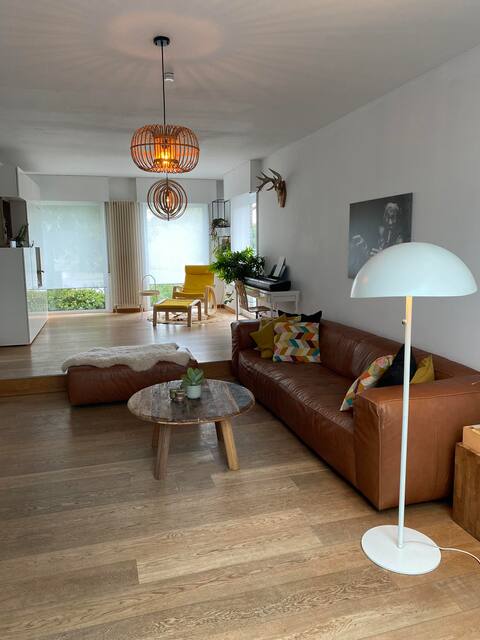
Ideal for Tommorowland!
Entire Place • 3 bedrooms
Cozy home 5 minutes from Tomorrowland
Entire Place • 3 bedrooms
Family home on Boom Rubensstraat
Entire Place • 3 bedrooms

Entire house near De Schorre (Tomorrowland)
Entire Place • 4 bedrooms
Note: Performance varies based on location, size, amenities, seasonality, and management quality. Data reflects the past 12 months.
Top Performing Airbnb Hosts in Boom (2026)
Learn from the best! This table showcases top-performing Airbnb hosts in Boom based on the number of properties managed and estimated total revenue over the past year. Analyze their scale and performance metrics.
| Host Name | Properties | Grossing Revenue | Stay Reviews | Avg Rating |
|---|---|---|---|---|
| Lena | 1 | $123,469 | 3 | 5.00/5.0 |
| Marjan | 1 | $116,155 | 2 | Not Rated |
| Danielle | 1 | $102,085 | 2 | Not Rated |
| Marijke | 1 | $89,040 | 7 | 5.00/5.0 |
| Valerie | 1 | $76,846 | 3 | 5.00/5.0 |
| Marlies | 1 | $73,987 | 6 | 5.00/5.0 |
| Simke | 1 | $71,254 | 6 | 5.00/5.0 |
| Pierre | 1 | $64,250 | 5 | 4.80/5.0 |
| Yves | 3 | $62,904 | 10 | 5.00/5.0 |
| Robin | 1 | $59,030 | 4 | 5.00/5.0 |
Analyzing the strategies of top hosts, such as their property selection, pricing, and guest communication, can offer valuable lessons for optimizing your own Airbnb operations in Boom.
Dive Deeper: Advanced Boom STR Market Data (2026)
Ready to unlock more insights? AirROI provides access to advanced metrics and comprehensive Airbnb data for Boom. Explore detailed analytics beyond this report to refine your investment strategy, optimize pricing, and maximize your vacation rental profits.
Explore Advanced MetricsBoom Short-Term Rental Market Composition (2026): Property & Room Types
Room Type Distribution
Property Type Distribution
Market Composition Insights for Boom
- The Boom Airbnb market composition is heavily skewed towards Entire Home/Apt listings, which make up 58% of the 81 active rentals. This indicates strong guest preference for privacy and space.
- However, a notable 40.7% share for Private Rooms suggests opportunities for budget-conscious travelers or hosts renting out spare rooms.
- Looking at the property type distribution in Boom, House properties are the most common (60.5%), reflecting the local real estate landscape.
- Houses represent a significant 60.5% portion, catering likely to families or larger groups.
- The presence of 8.6% Hotel/Boutique listings indicates integration with traditional hospitality.
- Smaller segments like outdoor/unique, others (combined 6.1%) offer potential for unique stay experiences.
Boom Airbnb Room Capacity Analysis (2026): Bedroom Distribution
Distribution of Listings by Number of Bedrooms
Room Capacity Insights for Boom
- The dominant room capacity in Boom is 2 bedrooms listings, making up 22.2% of the market. This suggests a strong demand for properties suitable for couples or solo travelers.
- Together, 2 bedrooms and 3 bedrooms properties represent 43.2% of the active Airbnb listings in Boom, indicating a high concentration in these sizes.
- A significant 33.3% of listings offer 3+ bedrooms, catering to larger groups and families seeking more space in Boom.
Boom Vacation Rental Guest Capacity Trends (2026)
Distribution of Listings by Guest Capacity
Guest Capacity Insights for Boom
- The most common guest capacity trend in Boom vacation rentals is listings accommodating 4 guests (22.2%). This suggests the primary traveler segment is likely small families or groups.
- Properties designed for 4 guests and 6 guests dominate the Boom STR market, accounting for 37.0% of listings.
- 28.4% of properties accommodate 6+ guests, serving the market segment for larger families or group travel in Boom.
- On average, properties in Boom are equipped to host 3.1 guests.
Boom Airbnb Booking Patterns (2026): Available vs. Booked Days
Available Days Distribution
Booked Days Distribution
Booking Pattern Insights for Boom
- The most common availability pattern in Boom falls within the 271-366 days range, representing 91.4% of listings. This suggests many properties have significant open periods on their calendars.
- Approximately 97.6% of listings show high availability (181+ days open annually), indicating potential for increased bookings or specific owner usage patterns.
- For booked days, the 1-30 days range is most frequent in Boom (54.3%), reflecting common guest stay durations or potential owner blocking patterns.
- A notable 3.7% of properties secure long booking periods (181+ days booked per year), highlighting successful long-term rental strategies or significant owner usage.
Boom Airbnb Minimum Stay Requirements Analysis
Distribution of Listings by Minimum Night Requirement
1 Night
21 listings
25.9% of total
2 Nights
5 listings
6.2% of total
3 Nights
13 listings
16% of total
4-6 Nights
25 listings
30.9% of total
7-29 Nights
1 listings
1.2% of total
30+ Nights
16 listings
19.8% of total
Key Insights
- The most prevalent minimum stay requirement in Boom is 4-6 Nights, adopted by 30.9% of listings. This highlights the market's preference for longer commitments.
- A significant segment (19.8%) caters to monthly stays (30+ nights) in Boom, pointing to opportunities in the extended-stay market.
Recommendations
- Align with the market by considering a 4-6 Nights minimum stay, as 30.9% of Boom hosts use this setting.
- If feasible, allowing 1-night stays, especially midweek or during low season, could capture last-minute bookings, as only 25.9% currently do.
- Explore offering discounts for stays of 30+ nights to attract the 19.8% of the market seeking extended stays.
- Adjust minimum nights based on seasonality – potentially shorter during low season and longer during peak demand periods in Boom.
Boom Airbnb Cancellation Policy Trends Analysis (2026)
Flexible
17 listings
21% of total
Moderate
4 listings
4.9% of total
Firm
36 listings
44.4% of total
Strict
24 listings
29.6% of total
Cancellation Policy Insights for Boom
- The prevailing Airbnb cancellation policy trend in Boom is Firm, used by 44.4% of listings.
- A majority (74.0%) of hosts in Boom utilize Firm or Strict policies, indicating a market where hosts prioritize booking security.
Recommendations for Hosts
- Consider adopting a Firm policy to align with the 44.4% market standard in Boom.
- Regularly review your cancellation policy against competitors and market demand shifts in Boom.
Boom STR Booking Lead Time Analysis (2026)
Average Booking Lead Time by Month
Booking Lead Time Insights for Boom
- The overall average booking lead time for vacation rentals in Boom is 112 days.
- Guests book furthest in advance for stays during July (average 134 days), likely coinciding with peak travel demand or local events.
- The shortest booking windows occur for stays in January (average 9 days), indicating more last-minute travel plans during this time.
- Seasonally, Summer (97 days avg.) sees the longest lead times, while Winter (11 days avg.) has the shortest, reflecting typical travel planning cycles.
Recommendations for Hosts
- Use the overall average lead time (112 days) as a baseline for your pricing and availability strategy in Boom.
- For July stays, consider implementing length-of-stay discounts or slightly higher rates for bookings made less than 134 days out to capitalize on advance planning.
- During January, focus on last-minute booking availability and promotions, as guests book with very short notice (9 days avg.).
- Target marketing efforts for the Summer season well in advance (at least 97 days) to capture early planners.
- Monitor your own booking lead times against these Boom averages to identify opportunities for dynamic pricing adjustments.
Popular & Essential Airbnb Amenities in Boom (2026)
Amenity Prevalence
Amenity Insights for Boom
- Essential amenities in Boom that guests expect include: Wifi. Lacking these (this) could significantly impact bookings.
- Popular amenities like Kitchen, Smoke alarm, TV are common but not universal. Offering these can provide a competitive edge.
Recommendations for Hosts
- Ensure your listing includes all essential amenities for Boom: Wifi.
- Consider adding popular differentiators like Kitchen or Smoke alarm to increase appeal.
- Highlight unique or less common amenities you offer (e.g., hot tub, dedicated workspace, EV charger) in your listing description and photos.
- Regularly check competitor amenities in Boom to stay competitive.
Boom Airbnb Guest Demographics & Profile Analysis (2026)
Guest Profile Summary for Boom
- The typical guest profile for Airbnb in Boom consists of predominantly international visitors (87%), with top international origins including Netherlands, typically belonging to the Post-2000s (Gen Z/Alpha) group (50%), primarily speaking English or French.
- Domestic travelers account for 13.0% of guests.
- Key international markets include United States (21%) and Netherlands (17%).
- Top languages spoken are English (43.7%) followed by French (10.1%).
- A significant demographic segment is the Post-2000s (Gen Z/Alpha) group, representing 50% of guests.
Recommendations for Hosts
- Focus marketing internationally, particularly towards travelers from Netherlands.
- Tailor amenities and listing descriptions to appeal to the dominant Post-2000s (Gen Z/Alpha) demographic (e.g., highlight fast WiFi, smart home features, local guides).
- Highlight unique local experiences or amenities relevant to the primary guest profile.
- Consider seasonal promotions aligned with peak travel times for key origin markets.
Nearby Short-Term Rental Market Comparison
How does the Boom Airbnb market stack up against its neighbors? Compare key performance metrics like average monthly revenue, ADR, and occupancy rates in surrounding areas to understand the broader regional STR landscape.
| Market | Active Properties | Monthly Revenue | Daily Rate | Avg. Occupancy |
|---|---|---|---|---|
| Raamsdonksveer | 16 | $7,756 | $736.17 | 38% |
| Kockengen | 11 | $6,027 | $485.77 | 53% |
| Haghorst | 11 | $5,995 | $480.40 | 40% |
| Mont-de-l'Enclus | 10 | $5,398 | $407.81 | 36% |
| Merksplas | 12 | $5,367 | $356.64 | 43% |
| Zerkegem | 10 | $4,846 | $437.71 | 57% |
| Bentveld | 15 | $4,727 | $517.02 | 50% |
| Anzegem | 10 | $4,425 | $460.61 | 35% |
| Incourt | 13 | $4,412 | $303.48 | 52% |
| Wellin | 12 | $4,365 | $446.64 | 42% |