Nassau Airbnb Market Analysis 2026: Short Term Rental Data & Vacation Rental Statistics in New Providence, Bahamas
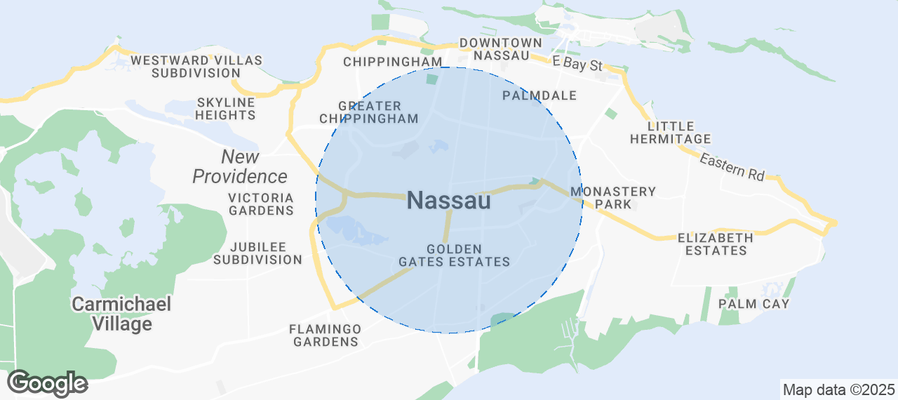
Is Airbnb profitable in Nassau in 2026? Explore comprehensive Airbnb analytics for Nassau, New Providence, Bahamas to uncover income potential. This 2026 STR market report for Nassau, based on AirROI data from February 2025 to January 2026, reveals key trends in the niche market of 68 active listings.
Whether you're considering an Airbnb investment in Nassau, optimizing your existing vacation rental, or exploring rental arbitrage opportunities, understanding the Nassau Airbnb data is crucial. Leveraging the low regulation environment is key to maximizing your short term rental income potential. Let's dive into the specifics.
Key Nassau Airbnb Performance Metrics Overview
Monthly Airbnb Revenue Variations & Income Potential in Nassau (2026)
Understanding the monthly revenue variations for Airbnb listings in Nassau is key to maximizing your short term rental income potential. Seasonality significantly impacts earnings. Our analysis, based on data from the past 12 months, shows that the peak revenue month for STRs in Nassau is typically December, while May often presents the lowest earnings, highlighting opportunities for strategic pricing adjustments during shoulder and low seasons. Explore the typical Airbnb income in Nassau across different performance tiers:
- Best-in-class properties (Top 10%) achieve $7,850+ monthly, often utilizing dynamic pricing and superior guest experiences.
- Strong performing properties (Top 25%) earn $4,002 or more, indicating effective management and desirable locations/amenities.
- Typical properties (Median) generate around $2,136 per month, representing the average market performance.
- Entry-level properties (Bottom 25%) see earnings around $1,307, often with potential for optimization.
Average Monthly Airbnb Earnings Trend in Nassau
Nassau Airbnb Occupancy Rate Trends (2026)
Maximize your bookings by understanding the Nassau STR occupancy trends. Seasonal demand shifts significantly influence how often properties are booked. Typically, Marchsees the highest demand (peak season occupancy), while May experiences the lowest (low season). Effective strategies, like adjusting minimum stays or offering promotions, can boost occupancy during slower periods. Here's how different property tiers perform in Nassau:
- Best-in-class properties (Top 10%) achieve 64%+ occupancy, indicating high desirability and potentially optimized availability.
- Strong performing properties (Top 25%) maintain 53% or higher occupancy, suggesting good market fit and guest satisfaction.
- Typical properties (Median) have an occupancy rate around 36%.
- Entry-level properties (Bottom 25%) average 26% occupancy, potentially facing higher vacancy.
Average Monthly Occupancy Rate Trend in Nassau
Average Daily Rate (ADR) Airbnb Trends in Nassau (2026)
Effective short term rental pricing strategy in Nassau involves understanding monthly ADR fluctuations. The Average Daily Rate (ADR) for Airbnb in Nassau typically peaks in September and dips lowest during August. Leveraging Airbnb dynamic pricing tools or strategies based on this seasonality can significantly boost revenue. Here's a look at the typical nightly rates achieved:
- Best-in-class properties (Top 10%) command rates of $682+ per night, often due to premium features or locations.
- Strong performing properties (Top 25%) achieve nightly rates of $363 or more.
- Typical properties (Median) charge around $218 per night.
- Entry-level properties (Bottom 25%) earn around $130 per night.
Average Daily Rate (ADR) Trend by Month in Nassau
Get Live Nassau Market Intelligence 👇
Explore Real-time Analytics
Airbnb Seasonality Analysis & Trends in Nassau (2026)
Peak Season (December, November, October)
- Revenue averages $4,849 per month
- Occupancy rates average 39.4%
- Daily rates average $333
Shoulder Season
- Revenue averages $3,778 per month
- Occupancy maintains around 43.4%
- Daily rates hold near $317
Low Season (February, April, May)
- Revenue drops to average $1,707 per month
- Occupancy decreases to average 36.6%
- Daily rates adjust to average $313
Seasonality Insights for Nassau
- The Airbnb seasonality in Nassau shows highly seasonal trends requiring careful strategy. While the sections above show seasonal averages, it's also insightful to look at the extremes:
- During the high season, the absolute peak month showcases Nassau's highest earning potential, with monthly revenues capable of climbing to $5,141, occupancy reaching a high of 77.4%, and ADRs peaking at $352.
- Conversely, the slowest single month of the year, typically falling within the low season, marks the market's lowest point. In this month, revenue might dip to $923, occupancy could drop to 9.5%, and ADRs may adjust down to $291.
- Understanding both the seasonal averages and these monthly peaks and troughs in revenue, occupancy, and ADR is crucial for maximizing your Airbnb profit potential in Nassau.
Seasonal Strategies for Maximizing Profit
- Peak Season: Maximize revenue through premium pricing and potentially longer minimum stays. Ensure high availability.
- Low Season: Offer competitive pricing, special promotions (e.g., extended stay discounts), and flexible cancellation policies. Target off-season travelers like remote workers or budget-conscious guests.
- Shoulder Seasons: Implement dynamic pricing that balances peak and low rates. Target weekend travelers or specific events. Offer slightly more flexible terms than peak season.
- Regularly analyze your own performance against these Nassau seasonality benchmarks and adjust your pricing and availability strategy accordingly.
Best Areas for Airbnb Investment in Nassau (2026)
Exploring the top neighborhoods for short-term rentals in Nassau? This section highlights key areas, outlining why they are attractive for hosts and guests, along with notable local attractions. Consider these locations based on your target guest profile and investment strategy.
| Neighborhood / Area | Why Host Here? (Target Guests & Appeal) | Key Attractions & Landmarks |
|---|---|---|
| Cable Beach | Famous for its stunning beaches, luxurious resorts, and vibrant nightlife. Ideal for tourists looking for a relaxing getaway with plenty of dining and entertainment options nearby. | Cable Beach, Baha Mar Resort, The Royal Blue Golf Club, Blue Lagoon Island, The Caves, Nassau's Ocean Club |
| Downtown Nassau | The heart of the city, overflowing with history and culture. Perfect for those seeking to explore local markets, historical sites, and enjoy proximity to sailing and cruises. | Queen's Staircase, Nassau Straw Market, Pirates Museum, Government House, The Bahamas Historical Society, Rawson Square |
| Paradise Island | Home to the famous Atlantis Resort, this area draws families and adventure seekers looking for entertainment, beaches, and water parks. A prime experience destination. | Atlantis Paradise Island, Aquaventure Water Park, The Dig, Cabbage Beach, The Cloisters, Casino at Atlantis |
| Old Fort Bay | A tranquil and upscale neighborhood known for its private beaches and exclusive villas. Great for travelers looking for luxury and privacy away from the hustle. | Old Fort Bay Beach, Baker's Bay Golf Club, Private Beach Access, Gated Communities, Bayside Marina |
| Lyford Cay | A posh residential community known for its exclusive vibe and serene environment. Attracts high-end tourists looking for luxury accommodations and privacy. | Lyford Cay Beach, Lyford Cay Club, The Golf Club at Lyford Cay, Private luxury homes, Exclusive marinas |
| Clifton Heritage National Park | This national park preserves the Bahamas' natural beauty and cultural heritage, offering hiking and exploration for nature lovers and those seeking tranquility. | Clifton Heritage National Park, Historical ruins, Nature trails, Beach areas, Bird watching |
| West Bay Street | Offers a mix of local life, restaurants, and beautiful views of the ocean. Perfect for travelers wanting to mix with locals and enjoy laid-back beach vibes. | Junkanoo Beach, Arawak Cay, Local Seafood Restaurants, Bars and Lounges, Beaches |
| Exuma Cays (day trips from Nassau) | Famous for its breathtaking beauty and swimming pigs, appealing to adventure travelers and nature enthusiasts seeking unique experiences. | Swimming Pigs at Big Major Cay, Thunderball Grotto, Sandbar Islands, Snorkeling and Diving, Uninhabited Islands |
Understanding Airbnb License Requirements & STR Laws in Nassau (2026)
While Nassau, New Providence, Bahamas currently shows low STR regulations, specific Airbnb license requirements might still exist or change. Always verify the latest short term rental regulations and Airbnb license requirements directly with local government authorities for Nassau to ensure full compliance before hosting.
(Source: AirROI data, 2026, finding no licensed listings among those analyzed)
Top Performing Airbnb Properties in Nassau (2026)
Benchmark your potential! Explore examples of top-performing Airbnb properties in Nassaubased on Trailing Twelve Month (TTM) revenue. Analyze their characteristics, revenue, occupancy rate, and ADR to understand what drives success in this market.

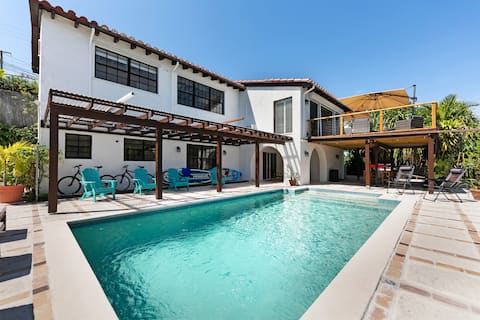
Luxury Villa on Cable Beach
Entire Place • 3 bedrooms

Dolphins Villa
Entire Place • 4 bedrooms
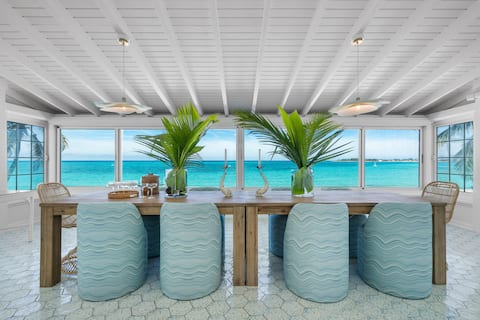
Azure Vista Villa - sea view - walk to beach
Entire Place • 4 bedrooms
Beach House at Emerald Wave- Upstairs
Entire Place • 4 bedrooms

Turtle Cove 3 BR Condo Right Beside Baha Mar!
Entire Place • 3 bedrooms

NEW: Cable Beach 5 BR, sleeps 13 - Pool & Beach
Entire Place • 5 bedrooms
Note: Performance varies based on location, size, amenities, seasonality, and management quality. Data reflects the past 12 months.
Top Performing Airbnb Hosts in Nassau (2026)
Learn from the best! This table showcases top-performing Airbnb hosts in Nassau based on the number of properties managed and estimated total revenue over the past year. Analyze their scale and performance metrics.
| Host Name | Properties | Grossing Revenue | Stay Reviews | Avg Rating |
|---|---|---|---|---|
| Isaac | 1 | $171,709 | 4 | 5.00/5.0 |
| Louisa | 1 | $131,598 | 5 | 5.00/5.0 |
| Brianne | 2 | $106,722 | 24 | 4.95/5.0 |
| Anton | 1 | $105,512 | 18 | 5.00/5.0 |
| Ports Properties Ltd | 1 | $102,466 | 8 | 5.00/5.0 |
| Sarah | 1 | $99,032 | 5 | 5.00/5.0 |
| Portum | 1 | $97,571 | 24 | 4.50/5.0 |
| Maggie | 3 | $87,013 | 48 | 4.60/5.0 |
| Julie And Patrick | 1 | $78,079 | 23 | 5.00/5.0 |
| Kelsi | 1 | $63,120 | 2 | Not Rated |
Analyzing the strategies of top hosts, such as their property selection, pricing, and guest communication, can offer valuable lessons for optimizing your own Airbnb operations in Nassau.
Dive Deeper: Advanced Nassau STR Market Data (2026)
Ready to unlock more insights? AirROI provides access to advanced metrics and comprehensive Airbnb data for Nassau. Explore detailed analytics beyond this report to refine your investment strategy, optimize pricing, and maximize your vacation rental profits.
Explore Advanced MetricsNassau Short-Term Rental Market Composition (2026): Property & Room Types
Room Type Distribution
Property Type Distribution
Market Composition Insights for Nassau
- The Nassau Airbnb market composition is heavily skewed towards Entire Home/Apt listings, which make up 91.2% of the 68 active rentals. This indicates strong guest preference for privacy and space.
- Looking at the property type distribution in Nassau, Apartment/Condo properties are the most common (57.4%), reflecting the local real estate landscape.
- Houses represent a significant 35.3% portion, catering likely to families or larger groups.
- The presence of 5.9% Hotel/Boutique listings indicates integration with traditional hospitality.
- Smaller segments like outdoor/unique (combined 1.5%) offer potential for unique stay experiences.
Nassau Airbnb Room Capacity Analysis (2026): Bedroom Distribution
Distribution of Listings by Number of Bedrooms
Room Capacity Insights for Nassau
- The dominant room capacity in Nassau is 1 bedroom listings, making up 32.4% of the market. This suggests a strong demand for properties suitable for couples or solo travelers.
- Together, 1 bedroom and 2 bedrooms properties represent 58.9% of the active Airbnb listings in Nassau, indicating a high concentration in these sizes.
- A significant 30.8% of listings offer 3+ bedrooms, catering to larger groups and families seeking more space in Nassau.
Nassau Vacation Rental Guest Capacity Trends (2026)
Distribution of Listings by Guest Capacity
Guest Capacity Insights for Nassau
- The most common guest capacity trend in Nassau vacation rentals is listings accommodating 4 guests (22.1%). This suggests the primary traveler segment is likely small families or groups.
- Properties designed for 4 guests and 6 guests dominate the Nassau STR market, accounting for 42.7% of listings.
- 42.7% of properties accommodate 6+ guests, serving the market segment for larger families or group travel in Nassau.
- On average, properties in Nassau are equipped to host 4.5 guests.
Nassau Airbnb Booking Patterns (2026): Available vs. Booked Days
Available Days Distribution
Booked Days Distribution
Booking Pattern Insights for Nassau
- The most common availability pattern in Nassau falls within the 271-366 days range, representing 70.6% of listings. This suggests many properties have significant open periods on their calendars.
- Approximately 97.1% of listings show high availability (181+ days open annually), indicating potential for increased bookings or specific owner usage patterns.
- For booked days, the 31-90 days range is most frequent in Nassau (39.7%), reflecting common guest stay durations or potential owner blocking patterns.
- A notable 4.4% of properties secure long booking periods (181+ days booked per year), highlighting successful long-term rental strategies or significant owner usage.
Nassau Airbnb Minimum Stay Requirements Analysis
Distribution of Listings by Minimum Night Requirement
1 Night
19 listings
27.9% of total
2 Nights
16 listings
23.5% of total
3 Nights
12 listings
17.6% of total
4-6 Nights
4 listings
5.9% of total
30+ Nights
17 listings
25% of total
Key Insights
- The most prevalent minimum stay requirement in Nassau is 1 Night, adopted by 27.9% of listings. This highlights the market's preference for shorter, flexible bookings.
- A significant segment (25%) caters to monthly stays (30+ nights) in Nassau, pointing to opportunities in the extended-stay market.
Recommendations
- Align with the market by considering a 1 Night minimum stay, as 27.9% of Nassau hosts use this setting.
- If feasible, allowing 1-night stays, especially midweek or during low season, could capture last-minute bookings, as only 27.9% currently do.
- Explore offering discounts for stays of 30+ nights to attract the 25% of the market seeking extended stays.
- Adjust minimum nights based on seasonality – potentially shorter during low season and longer during peak demand periods in Nassau.
Nassau Airbnb Cancellation Policy Trends Analysis (2026)
Super Strict 30 Days
1 listings
1.5% of total
Limited
1 listings
1.5% of total
Flexible
17 listings
25% of total
Moderate
12 listings
17.6% of total
Firm
31 listings
45.6% of total
Strict
6 listings
8.8% of total
Cancellation Policy Insights for Nassau
- The prevailing Airbnb cancellation policy trend in Nassau is Firm, used by 45.6% of listings.
- A majority (54.4%) of hosts in Nassau utilize Firm or Strict policies, indicating a market where hosts prioritize booking security.
- Strict cancellation policies are quite rare (8.8%), potentially making listings with this policy less competitive unless justified by high demand or property type.
Recommendations for Hosts
- Consider adopting a Firm policy to align with the 45.6% market standard in Nassau.
- Using a Strict policy might deter some guests, as only 8.8% of listings use it. Evaluate if potential revenue protection outweighs possible lower booking rates.
- Regularly review your cancellation policy against competitors and market demand shifts in Nassau.
Nassau STR Booking Lead Time Analysis (2026)
Average Booking Lead Time by Month
Booking Lead Time Insights for Nassau
- The overall average booking lead time for vacation rentals in Nassau is 28 days.
- Guests book furthest in advance for stays during April (average 88 days), likely coinciding with peak travel demand or local events.
- The shortest booking windows occur for stays in May (average 4 days), indicating more last-minute travel plans during this time.
- Seasonally, Spring (43 days avg.) sees the longest lead times, while Summer (17 days avg.) has the shortest, reflecting typical travel planning cycles.
Recommendations for Hosts
- Use the overall average lead time (28 days) as a baseline for your pricing and availability strategy in Nassau.
- For April stays, consider implementing length-of-stay discounts or slightly higher rates for bookings made less than 88 days out to capitalize on advance planning.
- During May, focus on last-minute booking availability and promotions, as guests book with very short notice (4 days avg.).
- Target marketing efforts for the Spring season well in advance (at least 43 days) to capture early planners.
- Monitor your own booking lead times against these Nassau averages to identify opportunities for dynamic pricing adjustments.
Popular & Essential Airbnb Amenities in Nassau (2026)
Amenity Prevalence
Amenity Insights for Nassau
- Essential amenities in Nassau that guests expect include: Wifi, Air conditioning, TV. Lacking these (any) could significantly impact bookings.
- Popular amenities like Free parking on premises, Kitchen, Washer are common but not universal. Offering these can provide a competitive edge.
Recommendations for Hosts
- Ensure your listing includes all essential amenities for Nassau: Wifi, Air conditioning, TV.
- Prioritize adding missing essentials: Air conditioning, TV.
- Consider adding popular differentiators like Free parking on premises or Kitchen to increase appeal.
- Highlight unique or less common amenities you offer (e.g., hot tub, dedicated workspace, EV charger) in your listing description and photos.
- Regularly check competitor amenities in Nassau to stay competitive.
Nassau Airbnb Guest Demographics & Profile Analysis (2026)
Guest Profile Summary for Nassau
- The typical guest profile for Airbnb in Nassau consists of predominantly international visitors (67%), with top international origins including Bahamas, typically belonging to the Post-2000s (Gen Z/Alpha) group (50%), primarily speaking English or Spanish.
- Domestic travelers account for 32.7% of guests.
- Key international markets include United States (40.3%) and Bahamas (32.7%).
- Top languages spoken are English (76.5%) followed by Spanish (9.3%).
- A significant demographic segment is the Post-2000s (Gen Z/Alpha) group, representing 50% of guests.
Recommendations for Hosts
- Focus marketing internationally, particularly towards travelers from Bahamas.
- Tailor amenities and listing descriptions to appeal to the dominant Post-2000s (Gen Z/Alpha) demographic (e.g., highlight fast WiFi, smart home features, local guides).
- Highlight unique local experiences or amenities relevant to the primary guest profile.
- Consider seasonal promotions aligned with peak travel times for key origin markets.
Nearby Short-Term Rental Market Comparison
How does the Nassau Airbnb market stack up against its neighbors? Compare key performance metrics like average monthly revenue, ADR, and occupancy rates in surrounding areas to understand the broader regional STR landscape.
| Market | Active Properties | Monthly Revenue | Daily Rate | Avg. Occupancy |
|---|---|---|---|---|
| Harbour Island | 87 | $8,607 | $1195.87 | 37% |
| Hope Town | 80 | $5,384 | $791.40 | 33% |
| North Eleuthera | 31 | $3,762 | $440.40 | 43% |
| Central Eleuthera | 335 | $3,696 | $486.62 | 37% |
| South Abaco | 24 | $3,284 | $391.65 | 38% |
| Spanish Wells | 87 | $3,126 | $343.45 | 41% |
| Green Turtle Cay | 49 | $3,091 | $468.40 | 35% |
| Central Abaco | 63 | $3,077 | $382.46 | 33% |
| West Grand Bahama | 21 | $2,896 | $614.02 | 26% |
| New Providence | 1,366 | $2,779 | $320.49 | 37% |